

Abstract
In Alzheimer disease, elevated levels of the BACE1 enzyme are correlated with increased production of amyloid peptides and disease pathology. The increase in BACE1 levels is post-transcriptional and may involve altered translation efficiency. Earlier studies have indicated that translation of BACE1 mRNA is cap-dependent. As ribosomal subunits move from the cap-structure to the initiation codon, they fail to recognize several AUG codons in the 5′ leader. In this study, we looked for physical evidence of the mechanism underlying ribosomal scanning or shunting along the BACE1 5′ leader by investigating structural stability in the 5′ leaders of endogenous mRNAs in vivo. To perform this analysis, we probed RNAs using lead(II) acetate, a cell-permeable chemical that induces cleavage of unpaired nucleotides having conformational flexibility. The data revealed that the ≈440-nt 5′ leader was generally resistant to cleavage except for a region upstream of the initiation codon. Cleavage continued into the coding region, consistent with destabilization of secondary structures by translating ribosomes. Evidence that a large segment of the BACE1 5′ leader was not cleaved indicates that this region is structurally stable and suggests that it is not scanned. The data support a mechanism of translation initiation in which ribosomal subunits bypass (shunt) part of the BACE1 5′ leader to reach the initiation codon. We suggest that a nucleotide bias in the 5′ leader may predispose the initiation codon to be more accessible than other AUG codons in the 5′ leader, leading to an increase in its relative utilization.
Keywords: BACE1, RNase P, mRNA, Translation, Initiation, Shunt, Ribosome
Cleavage of the Amyloid Precursor Protein (APP) by cellular proteases gives rise to various peptides, including a set of 38–43 amino acid peptides (Aβ) that are generated when APP is cleaved by the β-site APP cleaving enzyme 1 (BACE1) and γ-secretase.1,2 Although these peptides are generated normally, different factors including elevated BACE1 levels, can lead to increased levels of Aβ peptides in brain and have been postulated to cause Alzheimer disease pathology.3 Various studies have indicated that increased BACE1 levels are not the result of increases in its mRNA levels, but rather involve post-transcriptional mechanisms including translation.4
Translation of rat and human BACE1 mRNAs is 5′ cap-dependent and does not appear to involve internal initiation of translation.5-7 In addition, although the BACE1 5′ leader contains 4 AUG codons, various studies have shown that mutation of these codons had either relatively small effects on translation or no effect, suggesting that they are not used as translation start sites.5,8 By contrast, other studies reported that translation initiation at upstream AUG codons had significant inhibitory effects on translation.6,7 We showed that some of these differences were caused by the expression systems.9 Reporter mRNAs initiated translation more often at upstream AUG codons when in vitro transcripts were transfected into cells, or when mRNAs were transcribed in the cytoplasm. However, comparable mRNAs initiated translation predominantly at the initiation codon when transcribed in the nucleus. We have suggested that these various observations are more consistent with a mechanism in which ribosomal subunits bypass segments of the 5′ leader as they move from the cap to the initiation codon. This is inconsistent with a scanning-based mechanism of translation initiation.5,9
In this study, we looked for physical evidence of the BACE1 translation mechanism by using lead(II) acetate to probe the structural stability of endogenous BACE1 mRNAs in live cells. Pb2+ is cell permeable and induces RNA cleavage that is essentially sequence non-specific at bulged, looped, or single stranded nucleotides. It has been used previously to probe RNA structure in vitro and in bacteria.10-12 Pb2+ does not induce cleavage of double stranded RNA or RNA stabilized by other interactions such as stacking interactions between bases.13 The ability of Pb2+ to induce RNA cleavage involves transitions that require conformational flexibility of the hydrolyzed region.
This chemical is particularly well suited for the present efforts inasmuch as the coding region of an actively translated mRNA is continuously destabilized by ribosomes and should have sufficient conformational flexibility to be an ideal substrate for Pb2+-induced cleavage. The extent of cleavage in the 5′ leader should therefore provide an indication of the translation mechanism. For example, ribosomal scanning of the 5′ leader from the cap to the initiation codon, followed by translation of the coding region should fully destabilize both regions with each round of translation. By contrast, if segments in the 5′ leader are not destabilized compared with the coding region, this would suggest that they are bypassed as ribosomal subunits move from the cap to the initiation codon.
Results
Assessing feasibility of lead probing in mammalian cells
Inasmuch as lead(II) acetate has not been used previously to probe RNA structures in mammalian cells, we first assessed the feasibility of our methodology by probing RNase P RNA. This RNA was chosen as an exemplar inasmuch as it has been studied extensively and various data indicate that specific structural features in this RNA are universally conserved.14-19 For this analysis, B104 cells were incubated with different concentrations of lead(II) acetate. The Pb2+-treated cells excluded trypan blue dye in a degree comparable to that of control cells, indicating that they remained alive during treatment. RNA was extracted from the cells and an indication of the extent of cleavage was obtained by monitoring the integrity of the rRNA bands in agarose gels. It was found that the extent of cleavage depends on the exposure time and concentration of lead(II) acetate (Fig. 1A). Primer extension analysis (Fig. 1B, C) revealed a major band corresponding to the full-length RNase P RNA in control samples for each primer (0 mM Pb2+; see arrow). The lower molecular weight bands are likely to correspond to premature stops by the reverse transcriptase enzyme or represent extension products from fragmented templates. Exposing cells to lead(II) acetate led to degradation of the full-length RNase P RNA and the appearance of new bands corresponding to cleavage sites. To avoid secondary cuts, we sought to cleave target RNAs less than once per molecule on average. Suitable conditions were obtained by incubating cells with up to 100 mM lead(II) acetate for 15 min at 37°C. Secondary cuts appeared to be minimal or of no consequence because no new bands were observed when cells were exposed to the highest Pb2+concentration (100 mM) as compared with the lowest concentration (25 mM).

Figure 1.Lead(II) acetate-induced cleavage of endogenous RNase P RNAs. (A) B104 cells were incubated with control buffer (0 mM Pb(II); first lane in each panel) or increasing concentrations of a lead(II) acetate solution (25, 50, or 100 mM; represented by the triangles). RNA was visualized on a denaturing agarose gel. Bands corresponding to rRNAs are indicated. (B) Schematic representation of primer extension assay. The black bar represents the RNase P RNA; the arrows show locations of DNA oligonucleotide primers P1-P4. The graphic below illustrates primer extension products as dashed blue lines that extend from the primer to either the 5′ end of the RNA or cleavage sites, indicated by red arrowheads. (C) Primer extension analysis of endogenous RNase P RNAs using primers P1 to P4. Cells were incubated with 0, 25, 50, or 100 mM lead(II) acetate; represented by the triangles. Primer extension products were resolved on denaturing polyacrylamide gels. Primer extension products appear as bands in the autoradiograms. The arrows indicate the position of full-length RNase P RNAs. Nucleotide positions of various cleavage sites in the RNase P RNA sequence are indicated. (D) Cleavage data mapped onto a previously predicted secondary structure of rat RNase P RNA.16 Individual nucleotides are indicated schematically as different colored circles (G = closed black, A = closed gray, U = open gray, and C = open black). G-C and A-U base pairs are indicated by black bars; G-U base pairs are indicated by 2 black dots. Major cleavage sites identified from different primers are indicated by red arrowheads. Nucleotides in CR 1-V, P10/11, and P12 are indicated by blue bars. A pseudoknot between complementary nucleotides in CR1 and CRV is indicated by the dashed blue line.
The results showed that most of the primer P1 extension products had bands corresponding to those from other primers (Fig. 1C), suggesting that the observed extension products represented authentic cleavage sites and not products generated from spuriously primed RNA templates. Both strong and weak bands were observed within each primer extension reaction. In addition, the relative intensities of some bands varied with different primers. These differences may be related to the ability of some cleaved fragments to adopt altered conformations that allow hybridization to various primers with different efficiencies. By mapping the major sites of cleavage onto a previously predicted secondary structure of the RNase P RNA, it can be seen that the cleavage sites are consistent with various previously predicted structural features (Fig. 1D). For example, cleavage sites provide physical evidence for the occurrence of paired regions 10/11 (P10/11), conserved region II (CRII) and CRIII, and paired region P12, demonstrating the validity of this method in vivo.
Subcellular distribution of BACE1 mRNAs in cells
Investigations of RNA structural features in vivo may be complicated by the fact that RNAs do not necessarily occur as homogeneous populations within cells. Indeed, mRNA structures in the cytoplasm may differ significantly from those in the nucleus, particularly mRNAs that undergo significant processing in the nucleus and interact with different factors in each location. In the cytoplasm, translation is expected to disrupt secondary structures in coding regions. Whether translation also occurs in the nucleus remains unresolved; nevertheless, it is important to determine how an mRNA is distributed within cells to understand whether the Pb2+-probing results reflect cleavage of mRNAs that are primarily localized to the cytoplasm, nucleus, or present at a significant level in both compartments. To determine the subcellular distribution of BACE1 mRNAs, RNA was isolated from the nuclei or cytoplasm of rat PC12 and B104 cells and RNase protection assays (RPAs) were performed using a radiolabeled probe specific to the BACE1 mRNA. We observed that BACE1 mRNA levels are significantly lower in B104 than PC12 cells, and that this mRNA is found almost exclusively in the cytoplasm (Fig. 2A). This finding indicates that any cleavage sites mapped in the Pb2+-cleavage experiments are derived from cytoplasmic BACE1 mRNAs. To ensure that RNA was present in the nuclear fraction, we probed nuclear and cytoplasmic fractions for RNase P RNA, and showed that this RNA was present in both nuclear and cytoplasmic fractions as previously reported.20
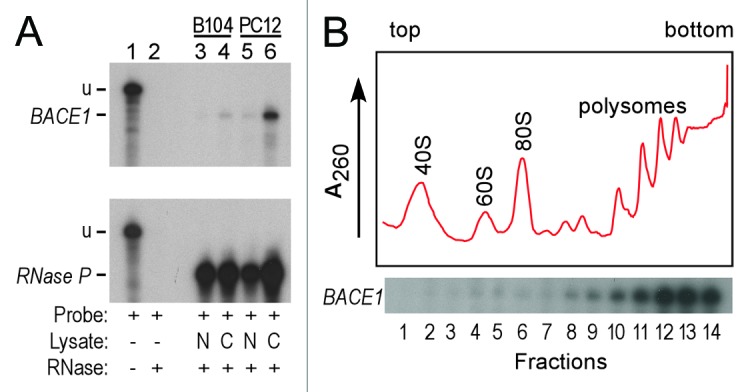
Figure 2.Subcellular distribution and polysome analysis of BACE1 mRNAs. (A) Analysis of BACE1 mRNAs by RPA. RNA was isolated from nuclei or cytoplasm of rat B104 and PC12 cells. The top panel probes BACE1 mRNA, the bottom panel probes RNase P RNA. For both autoradiograms, lane 1 is undigested probe (u). Lanes 2–6 are RPAs performed using no cell lysate (lane 2), RNA from nuclear lysates (N, lanes 3 and 5) and RNA from cytoplasmic lysate (C, lanes 4 and 6). The RPA products indicated in lanes 4 and 6 (BACE1) are protected from digestion by the BACE1 probe. The RPA products indicated in lanes 3- 6 (RNase P) are protected from digestion by the RNase P probe (B) Polysome analysis of BACE1 mRNAs. Cell lysates were fractionated on a linear 10–50% sucrose gradient. The top of the gradient is on the left. The positions of the 40S and 60S ribosomal subunits, 80S monosomes, and polysomes are indicated. The A260 absorbance tracing is indicated by the red line. RNA from 14 fractions was analyzed by RPA using a BACE1 specific probe.
Another potential source of heterogeneity in the BACE1 mRNA population arises from translation itself. If a subset of BACE1 mRNAs is not translated or if some mRNAs are translated with different efficiencies, then different mRNAs in the population may have different structural features. To investigate this potential source of heterogeneity, cell lysates were fractionated in sucrose density gradients and individual fractions were hybridized with radiolabeled probes for BACE1 mRNA (Fig. 2B). The polysome profiles show that this mRNA is localized in polysomes and is not detected in 80S monosomes or lighter fractions. The data indicate that BACE1 mRNAs are associated with several ribosomes, suggesting that this mRNA population is relatively uniform in its translation properties. This finding is consistent with our earlier finding that the BACE1 5′ leader mediates relatively efficient translation.5
Lead probing of endogenous BACE1 mRNAs in cells
Lead(II) acetate probing of endogenous BACE1 mRNA was performed in PC12 and B104 cells using the approach described above for RNase P RNA. Due to the low signals obtained with B104 cells, it was difficult to achieve complete coverage of the 5′ leader with at least 2 primers, even when reactions were scaled up. We therefore pursued this analysis in PC12 cells. Suitable conditions for Pb2+-induced RNA cleavage in PC12 cells (Fig. 3A) were similar to those in B104 cells (Fig. 1A). Primer extension reactions were performed using primers complementary to various sites in the BACE1 mRNA (Fig. 3B). Data from 3 primers which show the Pb2+ cleavage pattern throughout the BACE1 5′ leader, extending into the coding region, are presented in Figure 3C. The results reveal two primer extension products containing 441 or 445-nucleotides that appear to correspond to the 5′ end of the BACE1 mRNA (indicated by arrows in Figure 3C). These bands are respectively 14 and 18-nucleotides longer than the 427-nt cDNA sequence used in our earlier studies (see asterisk;5,9), and are similar in length to human BACE1 5′ leader sequences that comprise 446–457 nucleotides.21
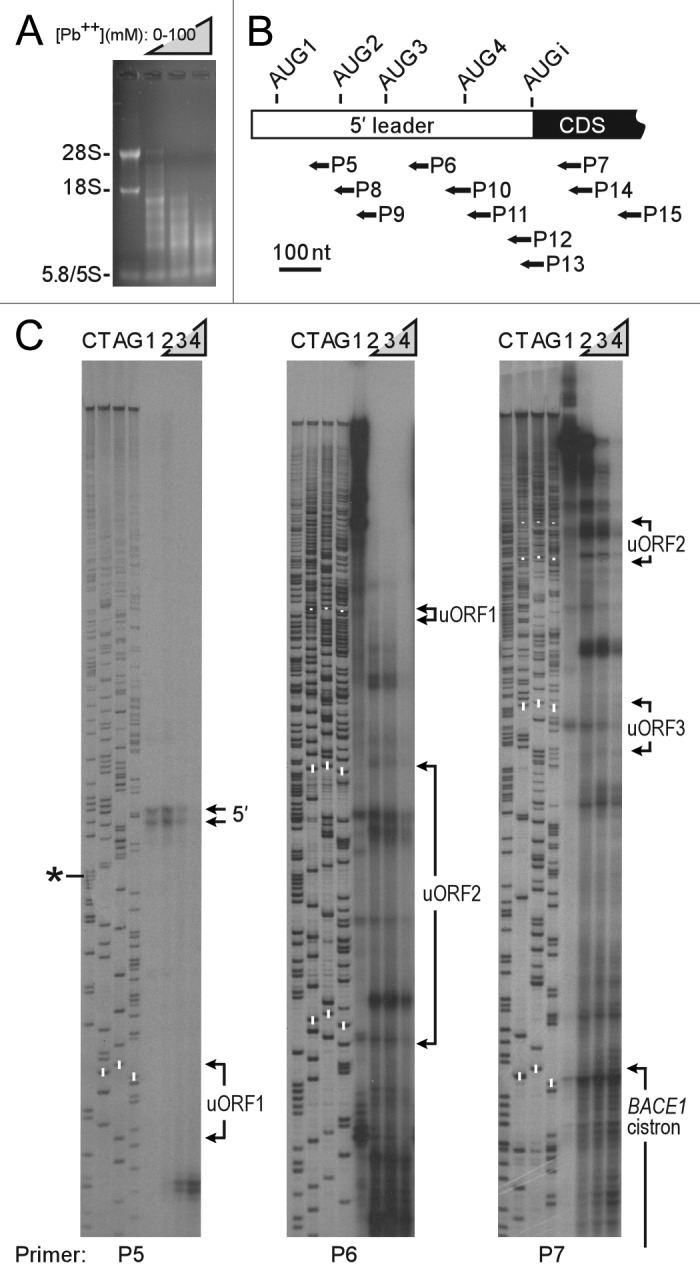
Figure 3.Lead(II) acetate-induced cleavage of endogenous BACE1 mRNAs in cells. (A) PC12 cells were incubated with lead(II) acetate as indicated for 10 min and RNA cleavage analyzed as in Figure 1A. (B) Primer sites in BACE1 mRNA. The bar represents the BACE1 mRNA, with the 5′ leader as an open bar and the coding sequence (CDS) as a black bar. The locations of oligonucleotide primers are indicated below. (C) Primer extension analysis of BACE1 mRNAs with primers P5-P7. Cells were incubated with control buffer (0 mM Pb(II); lane 1 in each panel) or increasing concentrations of a lead(II) acetate solution (25, 50, or 100 mM; lanes 2, 3, and 4, respectively). Primer extension products were resolved on denaturing polyacrylamide gels. The arrows (5′) indicate the position of full-length BACE1 mRNAs. Nucleotide positions of uORFs1-3 and the BACE1 cistron are indicated; upstream AUG codons are highlighted with white bars. Sequencing reactions using the same primers are indicated to the left. The asterisk corresponds to the length of the reported cDNA sequence (NCBI accession #NM_019204).
Cleavage sites that were observed with 2 or more primers were plotted on a linear representation of the BACE1 5′ leader and start of the coding region (Fig. 4A). Nucleotides downstream of the 5′ end for more than a 100-nucleotide length were highly resistant to cleavage. A few cleavage sites were observed further downstream, starting in the vicinity of the second upstream open reading frame (uORF2). However, extensive cleavage was only observed upstream of the BACE1 initiation codon for ≈150 nucleotides and extended into the coding region. Cleavage sites did not appear to coincide with any of the upstream AUG codons. We compared this data to the restricted data obtained from B104 cells and found that the cleavage patterns are almost identical, particularly when cleavage sites from single primers were included for comparison (Figure S1).
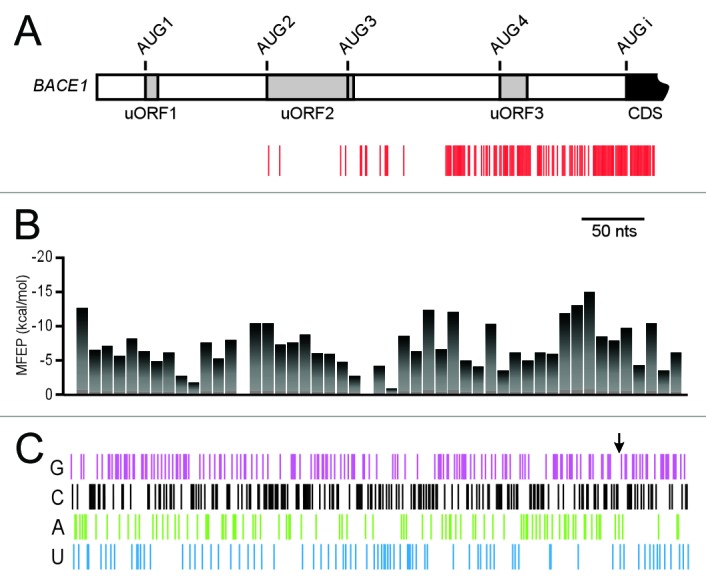
Figure 4.Comparison of Pb2+-induced cleavage sites in BACE1 mRNAs with predicted structural stabilities and nucleotide composition. (A) Linear representation of primer extension results. The BACE1 5′ leader and start of the coding region are indicated schematically. The range of the 5′ leader is indicated by an open bar, and uORF1, uORF2, and uORF3 are shown as gray boxes. Within uORF2 there is an AUG codon immediately upstream of the stop codon, which is indicated by a vertical line. The start of the coding sequence is indicated in black. Sites of Pb2+-induced cleavage are shown as red vertical bars and correspond to bands observed in primer extension reactions from at least two different primers in cells exposed to Pb2+ and not in control samples. (B) Minimum free energy predictions (MFEP) along BACE1 5′ leader and 5′ coding region. Each bar in the histogram is centered on the 15th nucleotide for each 30-nt window used for the RNAfold calculation. (C) Nucleotide composition of BACE1 5′ leader and 5′ coding region. Each nucleotide in the 5′ leader is indicated by a vertical bar: G is purple; C is black; A is green; and U is blue. The arrow is pointing to the start of the CDS (A1).
Sequence analysis of BACE1 5′ leader
To investigate whether the Pb2+ cleavage patterns observed in our experiments might be explained partially or fully by inherent differences in the ability of the BACE1 mRNA to form secondary structures in different parts of the mRNA, we compared the Pb2+ cleavage data to predicted stabilities in these regions of the mRNA. Predicted stabilities along the mRNA were calculated as minimum free energies using the RNA structure prediction program RNAfold (Fig. 4B;22). Stabilities were calculated using a sliding window of 30-nucleotides, walking 5′→3′ in 10-nt steps. For reference, the minimum free energy of an unstructured segment of RNA is 0 kcal/mol, and that of a structured segment is a negative number that becomes increasingly negative with increased stability. The results predict regions of high and low structural stability, but in general, the cleavage sites do not correspond to segments in the mRNA that have low predicted stability. For example, the region upstream of the initiation codon has relatively high predicted stability, but is highly susceptible to cleavage, whereas some segments located further upstream are predicted to be less structured, but are resistant to cleavage.
To further analyze the BACE1 5′ leader, we looked more closely at its nucleotide composition (Fig. 4C). We observed that both the 5′ leader and start of the coding sequence are rich in guanine and cytosine nucleotides (> 60% GC) and that the distribution of these nucleotides is relatively uniform across this region. By contrast, the distribution of adenine and uracil nucleotides is less uniform in the region surrounding the initiation codon (the arrow indicates the start of the coding region). Adenine nucleotides are more abundant upstream of the initiation codon than downstream and U has the opposite distribution. Although this nucleotide distribution appears to define a boundary between the 5′ leader and the coding region, there is no direct correlation between this distribution, the pattern of Pb2+-induced cleavage (Fig. 4A), or the predicted stabilities (Fig. 4B).
Determining the effects of the eIF4A helicase on BACE1 structure
Earlier studies indicated that translation initiated via the BACE1 5′ leader is cap-dependent.5-7 This suggests that ribosomal recruitment by this mRNA involves the eIF4F cap-binding complex. An important component of this complex is initiation factor eIF4A, an ATP-dependent non-processive RNA helicase.23,24 To investigate whether the extensive lead-induced cleavage observed upstream of the initiation codon might be due in part to destabilization of this region by the helicase activity of this initiation factor, we inhibited eIF4A activity using hippuristanol, a small molecule that is a selective and potent inhibitor of eIF4A RNA-binding activity.25 The results of 35S-Met labeling revealed that overall protein synthesis was inhibited by treating cells with increasing concentrations of hippuristanol. We observed that exposure of PC12 cells to 0.5 µM hippuristanol for 50 min decreased overall protein synthesis by 90%, and by 95% with 50 µM hippuristanol. To determine whether blocking eIF4A activity affects the structure of the BACE1 5′ leader, we probed endogenous BACE1 mRNAs with lead(II) acetate in hippuristanol-treated cells (Fig. S2). Surprisingly, only a few minor changes were observed, even after up to 8 h of treatment. Changes included the loss of some cleavage sites and the appearance of additional bands in the sample without Pb2+ (0 mM). However, the overall cleavage pattern was virtually unchanged from that in untreated control cells. This finding suggests that the structure of the BACE1 mRNA is largely unaffected by the helicase activity of eIF4A.
Discussion
For this work, we investigated the translation mechanism of BACE1 mRNA by probing the structural stability of the 5′ leader of endogenous BACE1 mRNAs in cells using lead(II) acetate. The ability of Pb2+ to induce cleavage of single stranded RNA with conformational flexibility made it ideal for assessing whether the BACE1 5′ leader is destabilized in vivo, consistent with a scanning mechanism, or whether the 5′ leader or parts of it remain structured, consistent with a shunting mechanism.
The Pb2+-probing results obtained for BACE1 mRNA indicate that the first ≈280 nucleotides of the 5′ leader are resistant to Pb2+-induced cleavage. The remainder of the 5′ leader (≈150 nucleotides) and start of the coding region are susceptible to cleavage. Cleavage in the coding region was anticipated, as this region is destabilized by ribosomes in the elongation phase of protein synthesis. However, the cleavage pattern in the 5′ leader is less obvious. The finding that the 5′ end of the mRNA is resistant to cleavage was somewhat unexpected as BACE1 translation appears to be cap-dependent, and it was thought that the helicase activity associated with the eIF4F complex, which is bound to the cap-structure, would destabilize RNA structures near the cap and render the 5′ end of the mRNA susceptible to cleavage. This does not appear to be the case indicating that the helicase activity of the cap-binding complex does not destabilize the BACE1 mRNA near the cap structure.
The non-uniform cleavage of the BACE1 5′ leader suggests that ribosomal subunits recruited at the 5′ cap-structure bypass a large segment of the 5′ leader to reach the initiation codon. Our earlier studies using BACE1/reporter constructs supported a similar conclusion.5,9 This cleavage pattern is not consistent with the scanning mechanism of initiation26,27 which proposes that ribosomal subunits destabilize and inspect the 5′ leader, base-by-base, until they recognize a start site. If each round of elongation involves a round of scanning, both 5′ leader and coding region should be equally destabilized in each round. This reasoning also applies to leaky scanning and reinitiation, which are variations of the scanning model. Nevertheless, we can imagine several supposable scenarios whereby scanning might explain the data. For example, if scanning is significantly faster than elongation, the 5′ leader might restabilize before cleavage can occur. However, this possibility seems unlikely as experiments performed in yeast have estimated the rate of scanning to be ≈10-nucleotides/second based on time differences observed for translation of mRNAs with 5′ leaders of different lengths.28 This estimate is not significantly different than the estimated rate of elongation, which is ≈9–24-nucleotides/second.29 Another possible scenario is that BACE1 mRNAs comprise structurally and functionally heterogeneous mRNA populations, and the Pb2+ probing results reflect cleavage of subpopulations of BACE1 mRNAs, some of which are highly structured and poorly translated. We cannot rule out this possibility completely, but it seems unlikely as we have shown that most BACE1 mRNAs are located in the cytoplasm and reside in large polysomes (Fig. 2). It is possible that these large polysomes contain stalled complexes. However, this possibility is also considered unlikely as large BACE1 polysomes are consistent with previous findings indicating that translation mediated by the BACE1 5′ leader is relatively efficient as assessed by comparison with a highly efficient reference 5′ leader.5
The extensive cleavage observed upstream of the BACE1 initiation codon may be due in part to native secondary structure adopted by the 5′ leader. This notion seems unlikely at first glance, given the high, relatively uniform GC content of this 5′ leader and its potential to adopt a secondary structure. However, the A-U composition upstream of the start site is biased in a way that may decrease stability in this region. This bias—toward A and against U—is reminiscent of those reported for yeast mRNAs.30 This yeast study examined mRNAs containing 5′ leaders of 100 or more nucleotides with translation start sites that had been established with a high level of confidence. They found that nucleotide frequencies are fairly constant throughout 5′ leaders, except for the region ≈40-nucleotides upstream of initiation codons, where the frequency of A increases and that of U decreases. The authors postulated that this distribution suggests a selection for reduced RNA structure inasmuch as the base pairing potential of A (A:U) is less than that of U (U:A, U:G). The nucleotide distribution in the BACE1 5′ leader suggests that the region upstream of the initiation codon for ≈80 nucleotides (downstream of uORF3) may be less structured than other parts of the 5′ leader. However, cleavage continues for another ≈70 nucleotides upstream of this region.
A possible explanation for why the upstream region is susceptible to cleavage is that it is actively destabilized by the translation of a uORF. Although the cleavage pattern does not line up with any of the uORFs, it does correspond to a CUG codon in good nucleotide context that is located 10-nucleotides downstream of where cleavage becomes relatively uniform. The CUG-initiated ORF extends 33-nucleotides before it overlaps uORF3 in the same reading frame, generating a 54-nt ORF. Initiation at this CUG codon might explain the observed cleavage pattern from ≈80–150 nucleotides upstream of the initiation codon.
In an earlier study, we demonstrated that the relative accessibility of AUG can affect how efficiently it functions as an initiation codon.31 If the intrinsic conformation of the BACE1 5′ leader predisposes the initiation codon to be more accessible than other potential start sites, this may help to determine the site of initiation for the first round of translation. This first round of translation should dramatically restructure the mRNA by destabilizing the coding region and bringing eIF4A to the vicinity of the initiation codon. We initially expected that the helicase activity of eIF4A might contribute to the accessibility observed upstream of the start site and increase the likelihood of subsequent initiation events. This did not appear to be the case: the cleavage pattern was essentially unaffected upon blocking eIF4A with hippuristanol. At present we cannot yet rule out the activities of other helicases.24
The present study provides a glimpse of the conformation of endogenous BACE1 mRNAs in live cells. The results show that a large segment of the 5′ leader is not destabilized. This is consistent with a ribosomal shunting mechanism of translation initiation. In other work, this laboratory has studied ribosomal shunting using synthetic constructs32-34 and proposed two initiation mechanisms that involve tethering or clustering of the translation machinery33. These mechanisms can account for nonlinear ribosomal movement during translation initiation and provide a plausible explanation for the BACE1 data.
We anticipate that improvements in the sensitivity of the Pb2+-probing method will facilitate future investigations of mRNA structure in postmortem human tissues in the future. The ability to perform such studies will enable a comparison of structural features in BACE1 mRNAs of normal and Alzheimer disease brains to determine whether increased BACE1 levels in the disease are accompanied by structural alterations in BACE1 mRNAs that may affect translation.
Materials and Methods
Cell culture and lead(II) acetate treatment
Rat pheochromocytoma PC12 and neuroblastoma B104 cells were cultured using Dulbecco's modified minimal essential medium (Gibco BRL, Life Technologies) supplemented with 10% fetal bovine serum and 1% penicillin-streptomycin-glutamine in 10 cm tissue culture plates at 37°C in 5% CO2. PC12 cells were supplemented with 5% fetal bovine and 5% horse serum and cultured on collagen coated plates. Cells were grown to 60–70% confluency and rinsed with phosphate buffered saline (PBS) prior to incubation with 3ml control buffer or lead(II) acetate trihydrate (Sigma Aldrich) solutions, which contained 10 mM TRIS-acetate (pH 7.5), 40 mM NaCl, and 5 mM MgCl2. Cells were incubated at 37°C for up to 30 min as indicated. Reactions were quenched with a 1.5 molar excess of EDTA to chelate the lead. RNA was extracted using Trizol reagent (Invitrogen).
The extent of Pb2+-induced RNA cleavage was determined by extracting total RNA with Trizol reagent, treating with DNase (DNAfree kit; Ambion) and analyzing the RNA on denaturing agarose gels stained with ethidium bromide. Primer extension analyses were performed using cloned AMV reverse transcriptase (Life Technologies). Reactions contained 0.2 pmol of end-labeled PAGE purified primer added up to 40 µg of DNase-treated total RNA from cells (final volume 7 µl). RNA/primer mixes were incubated at 85°C for 5 min and slowly cooled to 45°C prior to addition of other reagents. Extension products were RNase digested, pruified, and resolved on 8% sequencing gels (SequaGel-8; National Diagnostics). Positions of cleavage sites were determined using sequencing reactions from rat RNase P and BACE1 genes that were electrophoresed alongside the primer extension reactions.
RNA analysis
For RNA extraction from nuclear and cytoplasmic fractions, cell media was aspirated and tissue culture plates placed on ice. Nuclear and cytoplasmic fractions were prepared according to ref. 35. RNA was extracted using Trizol reagent. The nuclear pellet was washed with nuclear resuspension buffer and centrifuged at 5,000 rpm at 4°C for 5 min. RNA was extracted from the pellet using Trizol reagent. Polysome analysis using sucrose density gradients and RPAs were performed as previously described.34 Primer sequences used for RPAs:
P1 [3′-CCACTCCGTG GAGCGCCCGGAGTATTGGG-5′];
P2 [3′-GTTACCGACTCCACTCCGTGGAGCGCCCGG-5′];
P3 [3′-CAAGGGTCTCTCGTCCCGAGGTGCGCACCCG-5′]'
P4 [3′-GATTGGCCCGAG AGGGGCTCACCCCTCCAC-5′]'
P5 [5′-GTCTTCC AGGCGGACTTTGCAGCGTGAG-3′];
P6 [5′-GCTCCCGGCGGTGGAGAGTGGGCAGGAG -3′], and
P7 [5′-GATACCGAGATGGGTTCCCTGGGCAGGCAG-3′].
Predicted stabilities of 5′ leader and coding sequences in BACE1 mRNA were determined using the RNAfold algorithm (Vienna package).22 The minimum free energy was calculated for 30-nucleotide segments of the mRNA, walking along the mRNA from the 5′ end, in a 5′ to 3′ direction in steps of 10-nucleotides. For each window of 30-nucleotides, folding was predicted using 37°C energy parameters36 and unpaired helices were allowed to participate in at most one dangling end.
Hippuristanol treatment and analysis
For hippuristanol experiments, hippuristanol was dissolved in DMSO prior to use. For pulse-labeling experiments, cells were grown to 60–70% confluency in a 6-well plate and rinsed with PBS buffer prior to a 30 min incubation at 37°C with starvation media (l-methionine/cysteine-free DMEM, 10% FBS and 1X L-glutamine). Hippuristanol was then added to cells (0µM to 50µM) and cells were incubated for an additional 30 min. Control cell cultures received DMSO alone. Labeling was performed using 40µCi Trans 35S-Label (MP Bio), which was added to cells, followed by a 20 min incubation at 37°C before harvesting. Cells were centrifuged at 5,000 rpm for 5 min at 4°C in microfuge tubes. Cell pellets were washed with ice-cold PBS buffer and lysed in ice-cold RIPA buffer. Cell pellets were kept on ice for 5 min prior to centrifugation at 14,000 rpm for 15 min at 4°C. Supernatants were used directly for trichloroacetic acid (TCA) protein precipitation. Protein samples were spotted in duplicate on filter discs and left to dry. Filters were then washed with room temperature 5% TCA for 3 min, hot 5% TCA for 4 min, followed by two washes with room temperature 5% TCA for 3 min and a 100% ethanol for 2 min. The filters were dried prior to scintillation counting. For lead probing experiments, cells were incubated with 0.5µM hippuristanol for 6–8 h at 37°C prior to treatment with lead(II) acetate trihydrate solution. Control cells were incubated in media containing 0.5% DMSO.
Glossary
Abbreviations:
- APP
amyloid precursor protein
- BACE1
β-site APP cleaving enzyme 1
- CDS
coding sequence
- MFEP
minimum free energy predictions
- PBS
phosphate buffered saline
- RPAs
RNase protection assays
- TCA
trichloroacetic acid
- uORF
upstream open reading frame
Disclosure of Potential Conflicts of Interest
No potential conflicts of interest were disclosed.
Acknowledgments
Funding was provided by the National Institutes of Health (GM078071) and the Hearst Foundation to V.P.M, and by a postdoctoral fellowship from the Skaggs Institute for Chemical Biology to D.C.K. Hippuristanol was kindly provided by Dr. Jerry Pelletier.
Supplemental Material
Supplemental data for this article can be accessed on the publisher's website.
References
- 1.O’Brien RJ, Wong PC. . Amyloid precursor protein processing and Alzheimer’s disease. Annu Rev Neurosci 2011; 34:185 - 204; http://dx.doi.org/ 10.1146/annurev-neuro-061010-113613; PMID: 21456963 [DOI] [PMC free article] [PubMed] [Google Scholar]
- 2.Zhang H, Ma Q, Zhang YW, Xu H. . Proteolytic processing of Alzheimer’s β-amyloid precursor protein. J Neurochem 2012; 120:Suppl 1 9 - 21; http://dx.doi.org/ 10.1111/j.1471-4159.2011.07519.x; PMID: 22122372 [DOI] [PMC free article] [PubMed] [Google Scholar]
- 3.Tam JH, Pasternak SH. . Amyloid and Alzheimer’s disease: inside and out. Can J Neurol Sci 2012; 39:286 - 98; PMID: 22547507 [DOI] [PubMed] [Google Scholar]
- 4.Sun X, Bromley-Brits K, Song W. . Regulation of β-site APP-cleaving enzyme 1 gene expression and its role in Alzheimer’s disease. J Neurochem 2012; 120:Suppl 1 62 - 70; http://dx.doi.org/ 10.1111/j.1471-4159.2011.07515.x; PMID: 22122349 [DOI] [PubMed] [Google Scholar]
- 5.Rogers GW Jr., Edelman GM, Mauro VP. . Differential utilization of upstream AUGs in the beta-secretase mRNA suggests that a shunting mechanism regulates translation. Proc Natl Acad Sci U S A 2004; 101:2794 - 9; http://dx.doi.org/ 10.1073/pnas.0308576101; PMID: 14981268 [DOI] [PMC free article] [PubMed] [Google Scholar]
- 6.De Pietri Tonelli D, Mihailovich M, Di Cesare A, Codazzi F, Grohovaz F, Zacchetti D. . Translational regulation of BACE-1 expression in neuronal and non-neuronal cells. Nucleic Acids Res 2004; 32:1808 - 17; http://dx.doi.org/ 10.1093/nar/gkh348; PMID: 15034149 [DOI] [PMC free article] [PubMed] [Google Scholar]
- 7.Mihailovich M, Thermann R, Grohovaz F, Hentze MW, Zacchetti D. . Complex translational regulation of BACE1 involves upstream AUGs and stimulatory elements within the 5′ untranslated region. Nucleic Acids Res 2007; 35:2975 - 85; http://dx.doi.org/ 10.1093/nar/gkm191; PMID: 17439957 [DOI] [PMC free article] [PubMed] [Google Scholar]
- 8.Lammich S, Schöbel S, Zimmer AK, Lichtenthaler SF, Haass C. . Expression of the Alzheimer protease BACE1 is suppressed via its 5′-untranslated region. EMBO Rep 2004; 5:620 - 5; http://dx.doi.org/ 10.1038/sj.embor.7400166; PMID: 15167888 [DOI] [PMC free article] [PubMed] [Google Scholar]
- 9.Koh DC, Mauro VP. . Reconciling contradictory reports regarding translation of BACE1 mRNA: initiation mechanism is altered by different expression systems. RNA Biol 2009; 6:54 - 8; http://dx.doi.org/ 10.4161/rna.6.1.7567; PMID: 19106624 [DOI] [PubMed] [Google Scholar]
- 10.Ciesiolka J, Hardt WD, Schlegl J, Erdmann VA, Hartmann RK. . Lead-ion-induced cleavage of RNase P RNA. Eur J Biochem 1994; 219:49 - 56; http://dx.doi.org/ 10.1111/j.1432-1033.1994.tb19913.x; PMID: 8307015 [DOI] [PubMed] [Google Scholar]
- 11.Lindell M, Romby P, Wagner EG. . Lead(II) as a probe for investigating RNA structure in vivo. RNA 2002; 8:534 - 41; http://dx.doi.org/ 10.1017/S1355838201020416; PMID: 11991646 [DOI] [PMC free article] [PubMed] [Google Scholar]
- 12.Lindell M, Brännvall M, Wagner EG, Kirsebom LA. . Lead(II) cleavage analysis of RNase P RNA in vivo. RNA 2005; 11:1348 - 54; http://dx.doi.org/ 10.1261/rna.2590605; PMID: 16043496 [DOI] [PMC free article] [PubMed] [Google Scholar]
- 13.Ciesiołka J, Michałowski D, Wrzesinski J, Krajewski J, Krzyzosiak WJ. . Patterns of cleavages induced by lead ions in defined RNA secondary structure motifs. J Mol Biol 1998; 275:211 - 20; http://dx.doi.org/ 10.1006/jmbi.1997.1462; PMID: 9466904 [DOI] [PubMed] [Google Scholar]
- 14.Evans D, Marquez SM, Pace NR. . RNase P: interface of the RNA and protein worlds. Trends Biochem Sci 2006; 31:333 - 41; http://dx.doi.org/ 10.1016/j.tibs.2006.04.007; PMID: 16679018 [DOI] [PubMed] [Google Scholar]
- 15.Chen JL, Pace NR. . Identification of the universally conserved core of ribonuclease P RNA. RNA 1997; 3:557 - 60; PMID: 9174091 [PMC free article] [PubMed] [Google Scholar]
- 16.Brown JW. . The Ribonuclease P Database. Nucleic Acids Res 1999; 27:314; http://dx.doi.org/ 10.1093/nar/27.1.314; PMID: 9847214 [DOI] [PMC free article] [PubMed] [Google Scholar]
- 17.Frank DN, Adamidi C, Ehringer MA, Pitulle C, Pace NR. . Phylogenetic-comparative analysis of the eukaryal ribonuclease P RNA. RNA 2000; 6:1895 - 904; http://dx.doi.org/ 10.1017/S1355838200001461; PMID: 11142387 [DOI] [PMC free article] [PubMed] [Google Scholar]
- 18.Marquez SM, Chen JL, Evans D, Pace NR. . Structure and function of eukaryotic Ribonuclease P RNA. Mol Cell 2006; 24:445 - 56; http://dx.doi.org/ 10.1016/j.molcel.2006.09.011; PMID: 17081993 [DOI] [PMC free article] [PubMed] [Google Scholar]
- 19.Ellis JC, Brown JW. . The RNase P family. RNA Biol 2009; 6:362 - 9; http://dx.doi.org/ 10.4161/rna.6.4.9241; PMID: 19738420 [DOI] [PubMed] [Google Scholar]
- 20.Jarrous N, Gopalan V. . Archaeal/eukaryal RNase P: subunits, functions and RNA diversification. Nucleic Acids Res 2010; 38:7885 - 94; http://dx.doi.org/ 10.1093/nar/gkq701; PMID: 20716516 [DOI] [PMC free article] [PubMed] [Google Scholar]
- 21.Sambamurti K, Kinsey R, Maloney B, Ge YW, Lahiri DK. . Gene structure and organization of the human beta-secretase (BACE) promoter. FASEB J 2004; 18:1034 - 6; PMID: 15059975 [DOI] [PubMed] [Google Scholar]
- 22.Zuker M, Stiegler P. . Optimal computer folding of large RNA sequences using thermodynamics and auxiliary information. Nucleic Acids Res 1981; 9:133 - 48; http://dx.doi.org/ 10.1093/nar/9.1.133; PMID: 6163133 [DOI] [PMC free article] [PubMed] [Google Scholar]
- 23.Rogers GW Jr., Komar AA, Merrick WC. . eIF4A: the godfather of the DEAD box helicases. Prog Nucleic Acid Res Mol Biol 2002; 72:307 - 31; http://dx.doi.org/ 10.1016/S0079-6603(02)72073-4; PMID: 12206455 [DOI] [PubMed] [Google Scholar]
- 24.Parsyan A, Svitkin Y, Shahbazian D, Gkogkas C, Lasko P, Merrick WC, et al. . mRNA helicases: the tacticians of translational control. Nat Rev Mol Cell Biol 2011; 12:235 - 45; http://dx.doi.org/ 10.1038/nrm3083; PMID: 21427765 [DOI] [PubMed] [Google Scholar]
- 25.Bordeleau ME, Mori A, Oberer M, Lindqvist L, Chard LS, Higa T, et al. . Functional characterization of IRESes by an inhibitor of the RNA helicase eIF4A. Nat Chem Biol 2006; 2:213 - 20; http://dx.doi.org/ 10.1038/nchembio776; PMID: 16532013 [DOI] [PubMed] [Google Scholar]
- 26.Kozak M. . The scanning model for translation: an update. J Cell Biol 1989; 108:229 - 41; http://dx.doi.org/ 10.1083/jcb.108.2.229; PMID: 2645293 [DOI] [PMC free article] [PubMed] [Google Scholar]
- 27.Hinnebusch AG. . Molecular mechanism of scanning and start codon selection in eukaryotes. Microbiol Mol Biol Rev 2011; 75:434 - 67; http://dx.doi.org/ 10.1128/MMBR.00008-11; PMID: 21885680 [DOI] [PMC free article] [PubMed] [Google Scholar]
- 28.Berthelot K, Muldoon M, Rajkowitsch L, Hughes J, McCarthy JE. . Dynamics and processivity of 40S ribosome scanning on mRNA in yeast. Mol Microbiol 2004; 51:987 - 1001; http://dx.doi.org/ 10.1046/j.1365-2958.2003.03898.x; PMID: 14763975 [DOI] [PubMed] [Google Scholar]
- 29.Mathews MB, Sonenberg N, Hershey JWB. Origins and Principles of Translational Control. In: Sonenberg N, Hershey, J.W.B., and Mathews, M.B., ed. Translational Control of Gene Expression. Cold Spring Harbor, NY: Cold Spring Harbor Laboratory Press, 2000:1-31. [Google Scholar]
- 30.Robbins-Pianka A, Rice MD, Weir MP. . The mRNA landscape at yeast translation initiation sites. Bioinformatics 2010; 26:2651 - 5; http://dx.doi.org/ 10.1093/bioinformatics/btq509; PMID: 20819958 [DOI] [PubMed] [Google Scholar]
- 31.Matsuda D, Mauro VP. . Determinants of initiation codon selection during translation in mammalian cells. PLoS One 2010; 5:e15057; http://dx.doi.org/ 10.1371/journal.pone.0015057; PMID: 21124832 [DOI] [PMC free article] [PubMed] [Google Scholar]
- 32.Chappell SA, Dresios J, Edelman GM, Mauro VP. . Ribosomal shunting mediated by a translational enhancer element that base pairs to 18S rRNA. Proc Natl Acad Sci U S A 2006; 103:9488 - 93; http://dx.doi.org/ 10.1073/pnas.0603597103; PMID: 16769881 [DOI] [PMC free article] [PubMed] [Google Scholar]
- 33.Chappell SA, Edelman GM, Mauro VP. . Ribosomal tethering and clustering as mechanisms for translation initiation. Proc Natl Acad Sci U S A 2006; 103:18077 - 82; http://dx.doi.org/ 10.1073/pnas.0608212103; PMID: 17110442 [DOI] [PMC free article] [PubMed] [Google Scholar]
- 34.Mauro VP, Chappell SA, Dresios J. . Analysis of ribosomal shunting during translation initiation in eukaryotic mRNAs. Methods Enzymol 2007; 429:323 - 54; http://dx.doi.org/ 10.1016/S0076-6879(07)29015-9; PMID: 17913630 [DOI] [PubMed] [Google Scholar]
- 35.Schreiber E, Matthias P, Muller MM, Sshaffner W. . Rapid detection of octamer binding proteins with 'mini-extracts', prepared from a small number of cells.. Nucleic Acid Res 1989; 17:6419 - ; PMID: 2771659 [DOI] [PMC free article] [PubMed] [Google Scholar]
- 36.Mathews DH, Sabina J, Zuker M, Turner DH. . Expanded sequence dependence of thermodynamic parameters improves prediction of RNA secondary structure. J Mol Biol 1999; 288:911 - 40; http://dx.doi.org/ 10.1006/jmbi.1999.2700; PMID: 10329189 [DOI] [PubMed] [Google Scholar]
Associated Data
This section collects any data citations, data availability statements, or supplementary materials included in this article.