. 2015 Oct 20;7(43):18030–18035. doi: 10.1039/c5nr04982b

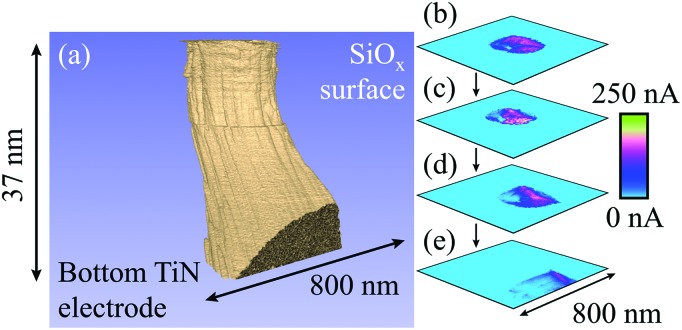
Fig. 3. Representation of a filament formed with +20 V at a current compliance of 0.1 μA. (a) Tomographic rendering of the filament, in which conductive regions are shown in beige and the surrounding, insulating oxide is shown in blue. It has a remarkably tubular shape that reflects an underlying, smaller columnar structure. (b) to (e) CAFM cross-sections at equal intervals through the switching layer showing the internal structure of the filament, with clear lateral variations in current at different depths into the SiOx. Note that there is some drift evident in the cross-sections that is likely instrumental and caused by the large forces applied to the sample during scanning. As a result of the drift the filament intercepts the edge of the scan region, causing a flattening of its lower edge. The rendering in (a) has been shown from an angle that best displays the columnar structure rather than the drift. 474 slices with a lateral resolution of 3.1 nm were used in this figure. A larger version of this figure is shown in the ESI, Fig. S3. .

Fig. 3