

Abstract
Study Design.
A retrospective analysis of a prospective, multicenter database.
Objective.
The aim of this study was to evaluate the health impact of symptomatic adult spinal deformity (SASD) by comparing Standard Form Version 2 (SF-36) scores for SASD with United States normative and chronic disease values.
Summary of Background Data.
Recent data have identified radiographic parameters correlating with poor health-related quality of life for SASD. Disability comparisons between SASD patients and patients with chronic diseases may provide further insight to the disease burden caused by SASD.
Methods.
Consecutive SASD patients, with no history of spine surgery, were enrolled into a multicenter database and evaluated for type and severity of spinal deformity. Baseline SF-36 physical component summary (PCS) and mental component summary (MCS) values for SASD patients were compared with reported U.S. normative and chronic disease SF-36 scores. SF-36 scores were reported as normative-based scores (NBS) and evaluated for minimally clinical important difference (MCID).
Results.
Between 2008 and 2011, 497 SASD patients were prospectively enrolled and evaluated. Mean PCS for all SASD was lower than U.S. total population (ASD = 40.9; US = 50; P < 0.05). Generational decline in PCS for SASD patients with no other reported comorbidities was more rapid than U.S. norms (P < 0.05). PCS worsened with lumbar scoliosis and increasing sagittal vertical axis (SVA). PCS scores for patients with isolated thoracic scoliosis were similar to values reported by individuals with chronic back pain (45.5 vs 45.7, respectively; P > 0.05), whereas patients with lumbar scoliosis combined with severe sagittal malalignment (SVA >10 cm) demonstrated worse PCS scores than values reported by patients with limited use of arms and legs (24.7 vs 29.1, respectively; P < 0.05).
Conclusions.
SASD is a heterogeneous condition that, depending upon the type and severity of the deformity, can have a debilitating impact on health often exceeding the disability of more recognized chronic diseases. Health care providers must be aware of the types of SASD that correlate with disability to facilitate appropriate diagnosis, treatment, and research efforts.
Level of Evidence: 3.
Keywords: adult spinal deformity, disability, health related quality of life, SF-36
Confusion persists regarding the severity of pain and disability associated with adult spinal deformity (ASD). Some reports indicate that ASD causes little disability other than back pain, whereas other reports indicate that ASD patients report greater functional limitations and worse quality of life compared with population norms.1–5 The incidence of ASD is rising in conjunction with the aging U.S. population; therefore, medical providers and third-party payers are increasingly called upon to evaluate, treat, and authorize payment for the care of ASD patients.6–9 A growing body of research has emerged demonstrating that ASD is a heterogeneous disease composed of a variety of deformity types.10–14 However, much of the historical literature characterized ASD as an adult version of adolescent idiopathic scoliosis (AIS); therefore, an incomplete understanding persists regarding the physiological reasons for disability associated with ASD because these studies only assessed scoliotic deformities rather than identifying that both coronal and sagittal plane deformities play an important role in the pathology that constitutes ASD.4,5
The Medical Outcomes Survey Short-Form 36 (Standard Form Version 2; SF-36) is a general health questionnaire that uses normative values for health assessment. Accordingly, SF-36 scores can be used to evaluate the health burden of a specific disease in relation to the general population and/or to other chronic diseases.15–20 Critical to interpreting SF-36 data and other health-related quality of life (HRQOL) measures is the concept of minimal clinically important difference (MCID), defined as the threshold value for a specific HRQOL score beyond which would be discernible by the patient as a clinically meaningful change.21–27 Although the SF-36 has been used in spine research to evaluate outcomes, little data exist to quantify the health impact of different types and severities of spinal deformities that exist within ASD in comparison to other more familiar chronic diseases.9,28,29 The purpose of this study was to (1) use the SF-36 questionnaire to compare the baseline physical and mental disability reported by a prospective cohort of consecutive symptomatic ASD (SASD) patients who have not had previous spine surgery to SF-36 scores reported by the U.S. general population and by patients with chronic diseases, (2) evaluate the impact that age has upon SASD by comparing generational SF-36 values for SASD patients to U.S. generational norms, and (3) evaluate the impact that specific types of spinal deformities have upon SASD patients in comparison to other chronic diseases.
MATERIALS AND METHODS
Data used for this study were obtained from a multicenter, prospective, longitudinal database (the database) consisting of consecutively enrolled ASD patients. Eleven participating sites located in the United States contributed patients to the database. Institutional review board (IRB) approval for this study was obtained at all participating centers before enrolling SASD patients into the database. Database inclusion criteria are age more than 18 years and minimum 1 of the following: scoliosis more than 20 degrees, sagittal vertical axis more than 5 cm (SVA; distance from C7 plumb line to the posterior, superior corner of S1), pelvic tilt more than 25 degrees (PT; angle between a vertical line and the line through the mid-point of the sacral plate to femoral heads axis), and/or thoracic kyphosis more than 60 degrees (TK; Cobb angle measured from superior endplate of T4 to inferior endplate of T12), as previously described.30,31 Exclusion criteria for database enrollment include spinal deformities associated with autoimmune, posttraumatic, neoplastic, neuromuscular, syndromic, and/or infectious disorders. An additional exclusion criterion for the current study was previous spine surgery.
All radiographic analyses of the spinal axis were performed using 36″ full-length films that visualized from the cervical spine to the pelvis. Patients were instructed to assume a free-standing posture, with elbows flexed at approximately 45 degrees and fingertips on the clavicles.32,33 Antero-posterior (AP) and lateral films were obtained and sagittal and frontal spino-pelvic parameters were assessed using Spineview® (Laboratory of Biomechanics, Paris, France).34,35
All demographic, radiographic, and SF-36 PCS and MCS values were obtained upon patient enrollment into the database, before treatment prescribed by the enrolling physician. All SF-36 data were reported as norm-based scores (NBS) with standard deviations (SDs). ASD SF-36 PCS and MCS values were compared with United States normative values, age-generational values, and disease-specific values, as reported by the User's Manual for the SF-36v2 Health Survey, Second Edition.19 Differences in SF-36 PCS and MCS values were assessed as total values and as MCID differences according to previously reported NBS mean values, percentile values, and MCID values for PCS and MCS.19 Recommended MCID values for SF-36 are between 2 and 3 NBS points for the PCS and 3 NBS points for the MCS.19 For consistency and to avoid overestimating the impact of SASD and other disease states, the MCID value was set at 3 NBS points for both the PCS and MCS, as previously recommended.19 SASD patients were divided into age generational cohorts as recommended by the User's Manual for the SF-36v2 Health Survey, Second Edition.19 Type and severity of spinal deformity was characterized as primarily scoliosis (patients with scoliosis ≥20 degrees and SVA <5 cm), primarily sagittal (SVA ≥5 cm and scoliosis <20 degrees), combined scoliosis, and sagittal deformities (scoliosis ≥20 degrees and SVA ≥5 cm), as previously recommended.36,37 The type of scoliosis was defined according to the apex of the scoliosis including thoracic (apex T2-T11–12 disc space), thoracolumbar (apex T12-L1 vertebra), or lumbar spine (apex L1–2 disc space-L4), as previously recommended.13,38 Severity of the sagittal deformity was quantified according to the magnitude of the SVA (<5, ≥5, ≥10 cm), as previously recommended.36,37,39
Statistical Methods
Statistical analysis was performed using Stata 12.1 (StataCorp, College Station, TX). Analysis of ASD HRQOL values compared with U.S. population norms groups was performed using 2-tailed t tests, and analysis across age groups was performed using analysis of variance (ANOVA). Linear regression analysis was used to assess the impact of radiographic measures of deformity on the deviation from population norms. P values less than 0.05 were considered statistically significant.
RESULTS
Between 2008 and 2011, 497 consecutive SASD patients met inclusion criteria and were evaluated for this study. Mean age of all SASD patients was 50.4 years (SD = 16.9), mean scoliosis was 45.3 degrees (SD = 18.3), and mean SVA was 1.99 cm (SD = 58.1; Table 1 and Fig. 1A–D). Mean PCS for all SASD patients was 40.9 (SD = 11.2) and mean MCS was 49.4 (SD = 11.3; Table 1 and Fig. 1E). Compared with the U.S. general population, the mean PCS for all SASD patients was 9 NBS points lower than the U.S. general population, and more than 3 NBS points below the 25th percentile for U.S. general population, whereas the MCS value for the total SASD cohort was similar to U.S. general population norms (Table 2). Generational PCS values for all SASD age groups were lower than respective U.S. generational values and were more than 3 NBS points below the 25th percentile for all respective U.S. generational norms for all age groups except for the youngest age group (P < 0.05), while MCS values for the each SASD generation were similar to U.S. generational norms (Table 2). SASD patients demonstrated a more rapid decline in generational PCS values than the U.S. general population, as the reduction in average SASD PCS across successive generations was greater than that of the U.S. successive generational decline (Table 2; P < 0.05). Analysis of a subset of SASD patients with no other reported comorbidities compared with U.S. total and generational norms demonstrated that the mean generational PCS for SASD patients with no other reported comorbidities was more than 3 NBS points lower than the respective U.S. generational norm for all generations except for the youngest and oldest age groups (P < 0.05; Table 3). Comparison of the mean PCS score for all SASD patients to PCS scores for chronic diseases demonstrated that the mean SASD PCS was more than 3 NBS points worse than chronic back pain and hypertension (P < 0.05), and was similar cancer, diabetes, and heart disease (Table 4).19
TABLE 1.
Symptomatic Adult Spinal Deformity Patients: Demographic, Radiographic, and SF-36 Values
| ASD (n = 497) | Mean Values (SD) |
| Age; years | 50.4 (16.9) |
| Body mass index; mean | 25.6 (6.4) |
| Sagittal vertical axis; cm | 1.99 (58.1) |
| Pelvic tilt; degrees | 18.8 (10.2) |
| Scoliosis; degrees | 45.3 (18.3) |
| SF-36 physical component score; mean | 40.9 (11.2) |
| SF-36 mental component score; mean | 49.4 (11.3) |
ASD indicates adult spinal deformity; SF-36, Medical Outcomes Survey Short Form-36 (Standard Form Version 2); SD, standard deviation.
Figure 1.

Percentage distribution of SASD patient population according to (A) age group, (B) scoliosis magnitude, (C) sagittal vertical axis, (D) pelvic tilt, and (E) SF-36 PCS values.
TABLE 2.
ASD Total and Generational PCS and MCS Values Compared With United States Total and Generational Norms19
| Generational Age Groups (n = total ASD patients) | ASD PCS; value (SD) | United States General Population Normative Value: PCS | PCS; Difference From Reported Generational Percentile Values (Percentile U.S. General Population; P) | ASD MCS; (SD) | United States General Population Normative Value: MCS | MCS Difference From Mean Reported US Generational Values (P) |
| 18-24 years (n = 42) | 51.3 (8) | 53.5 | −2.2 (total population; 0.10) | 48.2 (10.5) | 46.1 | +2.2 (0.23) |
| 25–34 years (n = 75) | 46.9 (9.2) | 53.6 | −6.7 (<25th; <0.05) | 50.8 (9.6) | 49.1 | +1.7 (0.14) |
| 35–44 years (n = 52) | 42.3 (9.5) | 52.3 | −10 (<25th; <0.05) | 49.7 (9.0) | 49.1 | +0.6 (0.62) |
| 45–54 years (n = 88) | 41.9 (10.5) | 49.7 | −7.8 (<25th; <0.05) | 50.4 (10.9) | 50.6 | −0.2 (0.8) |
| 55–64 years (n = 138) | 38.7 (10.6) | 47.4 | −8.7 (<25th; <0.005) | 47.1 (13.1) | 51.6 | −4.5 (<0.05) |
| 65–74 years (n = 73) | 33.6 (10.3) | 44.7 | −11.1 (<25th; <0.05) | 50.9 (11.7) | 52.8 | −1.9 (0.19) |
| ≥75 years (n = 29) | 31.7 (9.5) | 39.9 | −8.2 (<25th; <0.05) | 52.8 (8.5) | 50.2 | +2.6 (0.14) |
| Total population (n = 497) | 40.9 (11.2) | 50 | −9.1 (<25th; <0.05) | 49.4 (11.3) | 50 | −0.6 (0.30) |
ASD values reported as norm-based values and compared with United States generational population normative values and percentile norm-based values within each generation. ASD indicates adult spinal deformity; MCS, mental component summary; PCS, physical component summary; SD, standard deviation; SF-36, Medical Outcomes Survey Short Form-36 (Standard Form Version 2); P values based on 2-tailed t test of mean ASD PCS and MCS equal to respective U.S. population norm; P < 0.05, statistically significant.
TABLE 3.
ASD Total and Generational PCS and MCS Values for ASD Patients With no Other Comorbidities Compared with United States Total and Generational Norms19
| Generational Age Groups (n = total ASD patients) | ASD PCS; NBS value (SD) | US General Population PCS; NBS value | PCS Difference (percentile US general population; P) | ASD MCS: NBS value (SD) | US General Population MCS; NBS value | MCS Difference From Population Mean Value (P) |
| 18–24 years (n = 30) | 52.7 (7.3) | 53.5 | −0.8 (total population; 0.53) | 48.8 (10.7) | 46.1 | +2.7 (0.17) |
| 25–34 years (n = 58) | 46.8 (9.6) | 53.6 | −6.5 (<25th; <0.05) | 51.2 (8.9) | 49.1 | +2.1 (0.03) |
| 35–44 years (n = 34) | 43.2 (10.3) | 52.3 | −9.1 (<25th; <0.05) | 50.2 (9.6) | 49.1 | +1.1 (0.49) |
| 45–54 years (n = 47) | 43.2 (10.8) | 49.7 | −6.5 (<25th; <0.05) | 49.9 (11.3) | 50.6 | −0.7 (0.68) |
| 55–64 years (n = 57) | 42.4 (9.7) | 47.4 | −5.0 (<25th; <0.05) | 48.9 (11.4) | 51.6 | −2.7 (0.07) |
| 65–74 years (n = 14) | 35.8 (11.1) | 44.7 | −8.9 (<25th; <0.05) | 51.9 (12.2) | 52.8 | −0.9 (0.81) |
| ≥75 years (n = 6) | 36.8 (10.8) | 39.9 | −3.1 (total population; 0.52) | 51.4 (9.3) | 50.2 | +1.2 (0.77) |
| Total population (n = 246) | 44.4 (10.5) | 50 | −5.6 (<25th; <0.05) | 50.2 (10.5) | 50 | +0.2 (0.78) |
ASD values reported as norm-based values and compared with United States generational population normative values and percentile norm-based values within each generation. PCS, physical component summary; ASD indicates adult spinal deformity; MCS, mental component summary; SF-36, Medical Outcomes Survey Short Form-36 (Standard Form Version 2); P values based on 2-tailed t test of mean ASD PCS and MCS equal to respective U.S. population norm; P < 0.05, statistically significant.
TABLE 4.
Total ASD SF-36 PCS and MCS Values Compared With United States Healthy and Disease-Specific Norms19
| Chronic Disease | PCS; Mean NBS Points | MCS; Mean NBS Points |
| United States total population | 50 | 49.9 |
| United States healthy population | 55.4 | 52.9 |
| Back pain | 45.7 | 47.6 |
| Depression | 45.4 | 36.3 |
| Hypertension | 44.0 | 49.7 |
| Diabetes | 41.1 | 47.8 |
| Symptomatic adult spinal deformity | 40.9 | 49.4 |
| Cancer | 40.9 | 47.6 |
| Limited use arms legs | 38.9 | 43.0 |
| Heart disease | 38.9 | 48.3 |
| Lung disease | 38.3 | 45.6 |
MCS indicates mental component summary; PCS, physical component summary; SD, standard deviation; SF-36, Medical Outcomes Survey Short Form-36 (Standard Form Version 2).
Analysis of SASD according to the type and severity of spinal deformity demonstrated that patients with primarily scoliosis deformities in the lumbar spine (scoliosis >20 degrees, SVA <5 cm) had worse PCS scores than patients with primarily scoliosis deformities in the thoracic spine (PCS = 36.7 vs 45.5, respectively; P < 0.05), and patients with primarily sagittal deformities (scoliosis <20 degrees, SVA >5 cm) had worse PCS scores than patients with primarily scoliosis deformities (PCS = 32.4 vs 43.8, respectively; P < 0.05; Fig. 2). Patients with combined lumbar scoliosis and severe sagittal deformity (SVA >10 cm) demonstrated the worst PCS of all patients reported in this study (PCS = 24.7; P < 0.05). Comparison of the different deformity types to reported values for chronic diseases demonstrated that SASD patients with primarily thoracic scoliosis deformities had similar PCS scores as reported values for patients with chronic back pain (45.5 vs 45.7, respectively; Fig. 3A, B, and Fig. 2).19 Patients with primarily lumbar scoliosis deformities reported similar PCS scores as patients with osteoarthritis and chronic heart disease (36.7 vs 38.6 vs 38.9, respectively) and patients with primarily sagittal deformities (scoliosis <20 degrees, SVA >5 cm) reported similar PCS scores as patients with osteoarthritis and rheumatoid arthritis functioning below the 25th percentile for the disease group (30.4 vs 30.1 vs 31.7, respectively).19 Patients with primarily severe sagittal deformity (SVA >10 cm) had similar PCS scores as patients with chronic lung disease that function below the 25th percentile for the disease group (28.5 vs 30.1, respectively; Fig. 4A, B). Patients with combined lumbar scoliosis and severe sagittal deformities (SVA >10 cm) reported severe disability (PCS = 24.7) and had worse PCS scores than values reported for patients with limited vision and limited function of the arms and legs (Fig. 5A, B).19
Figure 2.

Adult spinal deformity SF-36 PCS values compared with PCS values for chronic diseases. SF-36 PCS values for the total ASD study population and different subtypes of spinal deformities (including primarily scoliosis deformity, primarily sagittal deformity and combined scoliosis and sagittal deformity) compared with analogous PCS values for other chronic diseases.
Figure 3.

A and B: Anteroposterior and lateral radiograph of 25-year-old female with a primarily scoliosis deformity with thoracic scoliosis. Thoracic scoliosis measures 47°. Thoracic kyphosis measures 26 degrees, lumbar lordosis is 53 degrees, sagittal vertical axis is -1 cm, and PT is 9 degrees. Reported PCS score was 57 and reported MCS score was 47, which are similar to age generational normative values.
Figure 4.

A and B: Anteroposterior and lateral radiograph of a 63-year-old female with a primarily severe sagittal deformity. Thoracic scoliosis and lumbar scoliosis are less than 20 degrees. Thoracic kyphosis measures 8 degrees, lumbar lordosis is 11 degrees, sagittal vertical axis is 19 cm, and PT is 30 degrees. Reported PCS was 20 and reported MCS was 34. Reported PCS score is similar to reported values for patients with chronic lung disease functioning below the 25th percentile.
Figure 5.
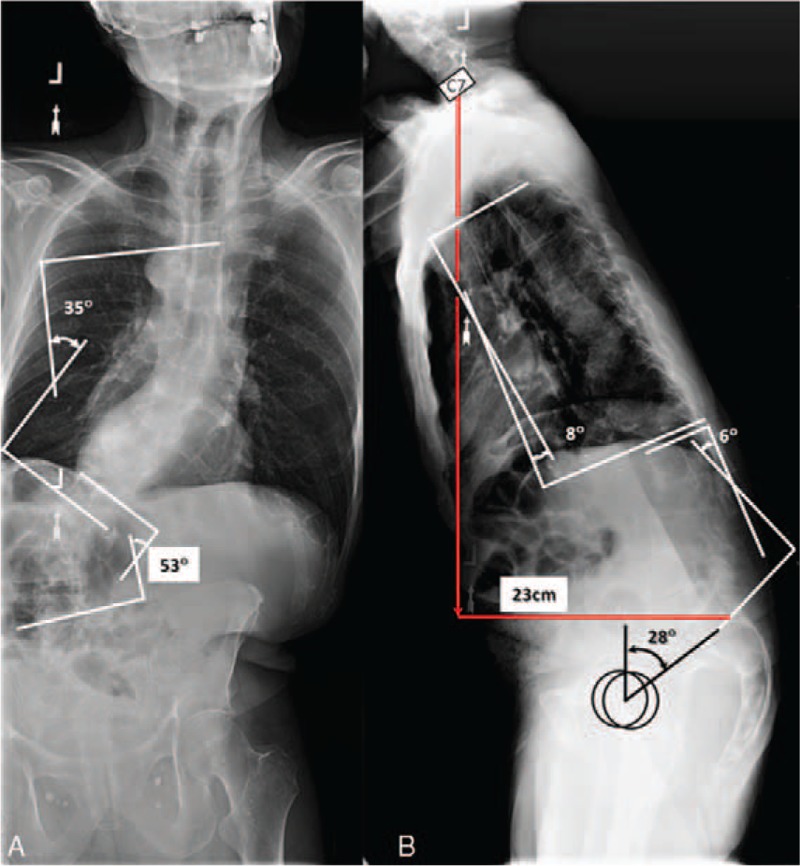
A and B: Anteroposterior and lateral radiograph of a 78-year-old male with combined scoliosis and sagittal deformities. Thoracic scoliosis is 35 degrees and thoracolumbar is 53 degrees. Thoracic kyphosis measures 8 degrees, lumbar lordosis is 6 degrees, sagittal vertical axis is 23 cm, and PT is 28 degrees. Reported PCS was 13 and reported MCS was 51. Reported PCS scores are worse than scores reported by patients with limited vision and for patients with limited use of arms and legs.
Table 5 summarizes the results of ordinary least squares (OLS) regression analysis specifying the deviation in a patient's PCS from United States generational norms as a function of body mass index (BMI), Charlson comorbidity index (CCI)40, gender, scoliosis, PT, and SVA. BMI, CCI, gender, PT, and SVA all demonstrated a significantly negative effect on the deviation in PCS from U.S. generational norms. Specifically, a 1-mm increase in SVA lead to a significant reduction in PCS of 0.06 points compared with the relevant U.S. generational norm. Similarly, a 1-degree increase in PT lead to a reduction in PCS of 0.12 points compared with the relevant U.S. generational norm. Separate regressions for each age group revealed that PT had the largest negative effect (−0.51, P = 0.004) on PCS relative to U.S. norms for patients aged 45 to 54 years, with a smaller but significant effect (−0.11) for patients aged 55 to 64 years, while SVA had the largest negative effect (−0.10, P = 0.001) on PCS relative to U.S. norms for patients aged 55 to 64 years, with a smaller but significant effect (−0.06) for patients aged 65 to 74 years.
TABLE 5.
Ordinary Least Squares Regression Analysis of ASD PCS Scores Compared With U.S. Generational Norms.19
| All Groups (n = 397) | 18–24 years (n = 29) | 25–34 years (n = 65) | 35–44 years (n = 45) | 45–54 years (n = 73) | 55–64 years (n = 112) | 65–74 years (n = 52) | >75 years (n = 21) | |
| Body mass index | −0.346 (0.11) | 0.024 (0.10) | −0.539 (0.05) | −0.311 (0.27) | −0.521 (0.09) | −0.579 (0.20) | −0.225 (0.13) | −0.608 (0.09) |
| P | 0.01 | 0.81 | 0.00 | 0.29 | 0.00 | 0.01 | 0.11 | 0.00 |
| Charlson comorbitiy index | −1.786 (0.44) | −0.623 (2.52) | −0.052 (1.08) | −1.898 (1.43) | −0.504 (0.58) | −2.881 (0.67) | −2.049 (1.02) | −0.726 (1.11) |
| P | 0.00 | 0.81 | 0.96 | 0.22 | 0.41 | 0.00 | 0.07 | 0.54 |
| Female gender | −3.217 (0.96) | −10.903 (3.02) | −4.420 (3.88) | −0.743 (7.77) | −5.220 (6.34) | −3.617 (1.18) | −0.905 (2.61) | 3.464 (6.17) |
| P | 0.01 | 0.01 | 0.29 | .093 | 0.43 | 0.01 | 0.74 | 0.60 |
| Maximal scoliosis angle | 0.050 (0.03) | −0.251 (0.15) | 0.045 (0.05) | 0.166 (0.10) | 0.083 (0.06) | 0.074 (0.04) | −0.049 (0.09) | −0.229 (0.13) |
| P | ||||||||
| Pelvic tilt | −0.123 (0.05) | 0.340 (0.18) | −0.114 (0.12) | 0.013 (0.25) | −0.507 (0.13) | −0.106 (0.04) | −0.010 (0.12) | 0.050 (0.21) |
| P | 0.05 | 0.10 | 0.38 | 0.96 | 0.00 | 0.02 | 0.94 | 0.83 |
| Sagittal vertical axis | −0.056 (0.01) | 0.030 (0.05) | −0.040 (0.05) | −0.037 (0.09) | −0.011 (0.03) | −0.096 (0.02) | −0.064 (0.02) | −0.032 (0.03) |
| P | 0.00 | 0.53 | 0.42 | 0.70 | 0.69 | 0.00 | 0.00 | 0.33 |
| R-squared | 0.23 | 0.40 | 0.18 | 0.15 | 0.31 | 0.33 | 0.29 | 0.30 |
Notes: Standard errors in parenthesis. Standard errors are robust to clustering at the hospital level. P values <0.05 considered statistically significant.
DISCUSSION
There is an increasing awareness in the spine community of the types of spinal deformities and radiographic parameters most associated with pain and disability; however, the greater medical community remains uneducated regarding the reasons for disability associated with SASD.30,41–43 We performed a multicenter, prospective evaluation of SF-36 scores from a large cohort of consecutive SASD patients who had no history of previous spine surgery and found that the SASD population demonstrated substantial disability compared with the U.S. population and demonstrated a greater generational worsening in physical function as measured by SF-36 PCS scores than the U.S. general population. Importantly, this study reinforces that SASD is a heterogeneous disease, composed of different deformity types, some of which are more disabling than others. In an attempt to draw analogies to alternate diseases that are more familiar to health care providers, we compared the SF-36 PCS and MCS values for SASD patients with values reported for other chronic diseases, and found that although patients with isolated thoracic scoliosis deformities reported similar disability as patients with chronic back pain, SASD patients with severe sagittal malalignment (SVA >10 cm), and patients with lumbar scoliosis combined with sagittal malalignment reported extreme disability with SF-36 PCS scores worse than patients who have limited use of their arms and legs.
A substantial amount of research has been devoted toward understanding if and why ASD patients are disabled. In a seminal, and often referenced, series of investigations, Weinstein et al4,5 evaluated the long-term outcome of untreated adult idiopathic scoliosis [termed late onset idiopathic scoliosis (LIS) in the studies]. The authors reported that at 50-year follow-up, patients with untreated LIS reported no more back pain than the general population.4 We hope that our findings expand those reported by Weinstein et al,4,5 because this study evaluated the health impact that coronal and sagittal plane deformities have upon SASD patients, whereas the reports by Weinstein et al4,5 did not evaluate the sagittal plane. Consistent with the data reported by Weinstein et al,4,5 the SASD patients with isolated thoracic scoliosis in our study population reported the least amount of disability, while patients with sagittal malalignment and patients with combined deformities that included coronal and sagittal malalignment reported the most disability. These findings are further explained by the ordinary least squares regression analysis, which demonstrated that sagittal malalignment (as measured by increased SVA) and sagittal spinopelvic malalignment (as measured by increased PT) had the greatest negative impact on ASD generational deviation from U.S. SF-36 PCS normative values, while maximal scoliosis had a little relative impact.
The SF-36 general health questionnaire is commonly used to evaluate outcomes following treatment for ASD. However, the SF-36 questionnaire can also be used to compare ASD with other diseases. Schwab et al29 compared SF-36 scores for adults with scoliosis with patients with hypertension and low back pain. Pellise et al44 compared SF-36 scores from ASD patients with published scores of patients with self-reported arthritis, lung disease, diabetes, and heart failure. Similar to our findings, the authors reported that ASD patients had worse SF-36 PCS scores than patients with the measured chronic diseases. Our data expand upon these findings, as we evaluated different age groups and specific spine deformity types and found that (1) the negative effect that SASD imparts upon physical health impacts all age generations, (2) the physical detriment associated with SASD worsens with age beyond what is expected from aging, and (3) chronic disease analogies can be created according to the disability associated the specific type and the severity of the spinal deformity.
Limitations of this study include the use of previously reported, standardized SF-36 data for U.S. population and chronic diseases. The SASD cohort evaluated for this study was a prospective, consecutively enrolled patient population; however, the SF-36 values for the ASD cohort were compared with previously reported normative SF-36 values. A benefit of the SF-36 questionnaire lies in the ability to quantify the impact on different disease states on physical and mental health and provide a standardized value for comparison to other disease states; however, it is possible that data collected on a prospective, consecutive cohort of control patients could generate different values. In addition, the SF-36 values for the ASD population reported in this study were obtained from patients presenting to physicians for evaluation of their deformity; therefore, a selection bias may exist, as it is possible that the patients evaluated in this study are the most symptomatic and not representative of all ASD patients, which is why the cohort was labeled the SASD. Although our data consist of a large cohort of SASD patients who reported varying disabilities that was found to correspond to the type and severity of the specific spinal deformity, the authors acknowledge that it is possible that some ASD patients may be asymptomatic and that these data do not supplant a larger population-based study. It is also important to note that this study did not evaluate the effectiveness of treatments for ASD; therefore, the authors cannot comment on efficacy of different treatments for ASD. The goal of this study was to quantify the baseline impact that different forms of SASD have upon physical and mental health. An evaluation of the efficacy of operative and nonoperative treatment for ASD is currently underway, and will be reported as the dataset matures.
In conclusion, our findings demonstrate that SASD patients can be markedly disabled compared with the U.S. general population, with a similar impact of more recognized chronic diseases. The effect of SASD demonstrated a greater reported impact on physical health than can be attributed solely to aging. Importantly, SASD patients with different types of spinal deformities have varying disabilities and, accordingly, we have provided analogous disease comparisons that correspond to the reported physical impact that can facilitate an understanding of the patient-reported physical limitations. We hope that these data will assist physicians and health care providers to more effectively evaluate patients with SASD and support that SASD warrants similar health policy attention as other chronic diseases.
Key Points.
Mean SF-36 PCS for SASD patients was lower than U.S. total population.
SASD disability increases with age as SASD generational decline in SF-36 PCS worsened more rapidly than U.S. age generational norms.
The mean SF-36 PCS values for all SASD patients was similar to values reported by patients with diabetes, heart disease, and rheumatoid arthritis.
The severity of the disease burden caused by SASD varies according to the type and severity of the deformity, as patients with more severe forms of SASD reported similar physical limitations and health impact as patients with limited use of arms and legs.
Footnotes
The manuscript submitted does not contain information about medical device(s)/drug(s). Deputy/Synthesis Spine grant funds were received in support of this work. Relevant financial activities outside the submitted work: board membership, consultancy, expert testimony, grants, employment, patents, payment for lectures, stocks, royalties, payment for development of educational presentations, travel/accommodations/meeting expenses.
References
- 1.Baldus C, Bridwell KH, Harrast J, et al. Age-gender matched comparison of SRS instrument scores between adult deformity and normal adults: are all SRS domains disease specific? Spine (Phila Pa 1976) 2008; 33:2214–2218. [DOI] [PubMed] [Google Scholar]
- 2.Berven S, Deviren V, Demir-Deviren S, et al. Studies in the modified Scoliosis Research Society Outcomes Instrument in adults: validation, reliability, and discriminatory capacity. Spine 2003; 28:2164–2169.discussion 9. [DOI] [PubMed] [Google Scholar]
- 3.Baldus C, Bridwell K, Harrast J, et al. The Scoliosis Research Society Health-Related Quality of Life (SRS-30) age-gender normative data: an analysis of 1346 adult subjects unaffected by scoliosis. Spine 2011; 36:1154–1162. [DOI] [PubMed] [Google Scholar]
- 4.Weinstein SL, Dolan LA, Spratt KF, et al. Health and function of patients with untreated idiopathic scoliosis: a 50-year natural history study. JAMA 2003; 289:559–567. [DOI] [PubMed] [Google Scholar]
- 5.Weinstein SL, Zavala DC, Ponseti IV. Idiopathic scoliosis: long-term follow-up and prognosis in untreated patients. J Bone Joint Surg Am 1981; 63:702–712. [PubMed] [Google Scholar]
- 6.Hutchinson MR. The burden of musculoskeletal diseases in the United States: prevalence, societal and economic cost 1st edition. J Am Coll Surg 2009; 208:e5–e6. [Google Scholar]
- 7.Perennou D, Marcelli C, Herisson C, et al. Adult lumbar scoliosis. Epidemiologic aspects in a low-back pain population. Spine (Phila Pa 1976) 1994; 19:123–128. [DOI] [PubMed] [Google Scholar]
- 8.Carter OD, Haynes SG. Prevalence rates for scoliosis in US adults: results from the first National Health and Nutrition Examination Survey. Int J Epidemiol 1987; 16:537–544. [DOI] [PubMed] [Google Scholar]
- 9.Schwab F, Dubey A, Gamez L, et al. Adult scoliosis: prevalence, SF-36, and nutritional parameters in an elderly volunteer population. Spine (Phila Pa 1976) 2005; 30:1082–1085. [DOI] [PubMed] [Google Scholar]
- 10.Glassman SD, Berven S, Bridwell K, et al. Correlation of radiographic parameters and clinical symptoms in adult scoliosis. Spine (Phila Pa 1976) 2005; 30:682–688. [DOI] [PubMed] [Google Scholar]
- 11.Glassman SD, Schwab FJ, Bridwell KH, et al. The selection of operative versus nonoperative treatment in patients with adult scoliosis. Spine 2007; 32:93–97. [DOI] [PubMed] [Google Scholar]
- 12.Bess S, Boachie-Adjei O, Burton D, et al. Pain and disability determine treatment modality for older patients with adult scoliosis, while deformity guides treatment for younger patients. Spine 2009; 34:2186–2190. [DOI] [PubMed] [Google Scholar]
- 13.Schwab F, Ungar B, Blondel B, et al. Scoliosis Research Society-Schwab adult spinal deformity classification: a validation study. Spine 2012; 37:1077–1082. [DOI] [PubMed] [Google Scholar]
- 14.Schwab FJ, Blondel B, Bess S, et al. Radiographical spinopelvic parameters and disability in the setting of adult spinal deformity: a prospective multicenter analysis. Spine (Phila Pa 1976) 2013; 38:E803–E812. [DOI] [PubMed] [Google Scholar]
- 15.Ware JE., Jr SF-36 health survey update. Spine 2000; 25:3130–3139. [DOI] [PubMed] [Google Scholar]
- 16.Ware JE, Jr, Gandek B. Overview of the SF-36 Health Survey and the International Quality of Life Assessment (IQOLA) Project. J Clin Epidemiol 1998; 51:903–912. [DOI] [PubMed] [Google Scholar]
- 17.Ware JE, Kosinski M. Interpreting SF-36 summary health measures: a response. Qual Life Res 2001; 10:405–413. [DOI] [PubMed] [Google Scholar]
- 18.Ware JE, Jr, Kosinski M, Bayliss MS, et al. Comparison of methods for the scoring and statistical analysis of SF-36 health profile and summary measures: summary of results from the Medical Outcomes Study. Med Care 1995; 33:AS264–AS279. [PubMed] [Google Scholar]
- 19.Ware JE, Kosinski M, Bjorner J, et al. User's Manual for the SF-36v2 Health Survey (2nd ed.). Lincoln, Rhode Island: QualityMetric Incorporated; 2007. [Google Scholar]
- 20.Ware JE, Jr, Sherbourne CD. The MOS 36-item short-form health survey (SF-36). I. Conceptual framework and item selection. Med Care 1992; 30:473–483. [PubMed] [Google Scholar]
- 21.Copay AG, Glassman SD, Subach BR, et al. Minimum clinically important difference in lumbar spine surgery patients: a choice of methods using the Oswestry Disability Index, Medical Outcomes Study questionnaire Short Form 36, and pain scales. Spine J 2008; 8:968–974. [DOI] [PubMed] [Google Scholar]
- 22.Copay AG, Subach BR, Glassman SD, et al. Understanding the minimum clinically important difference: a review of concepts and methods. Spine J 2007; 7:541–546. [DOI] [PubMed] [Google Scholar]
- 23.Beaton DE, Tarasuk V, Katz JN, et al. “Are you better?” A qualitative study of the meaning of recovery. Arthritis Rheum 2001; 45:270–279. [DOI] [PubMed] [Google Scholar]
- 24.Ware JE, Jr, Keller SD, Gandek B, et al. Evaluating translations of health status questionnaires. Methods from the IQOLA project. International Quality of Life Assessment. Int J Technol Assess Healthcare 1995; 11:525–551. [DOI] [PubMed] [Google Scholar]
- 25.Beaton DE, Bombardier C, Katz JN, et al. Looking for important change/differences in studies of responsiveness. OMERACT MCID Working Group. Outcome measures in rheumatology. Minimal clinically important difference. J Rheumatol 2001; 28:400–405. [PubMed] [Google Scholar]
- 26.Wells G, Anderson J, Beaton D, et al. Minimal clinically important difference module: summary, recommendations, and research agenda. J Rheumatol 2001; 28:452–454. [PubMed] [Google Scholar]
- 27.Wells G, Beaton D, Shea B, et al. Minimal clinically important differences: review of methods. J Rheumatol 2001; 28:406–412. [PubMed] [Google Scholar]
- 28.Albert TJ, Purtill J, Mesa J, et al. Health outcome assessment before and after adult deformity surgery. A prospective study. Spine 1995; 20:2002–2004. [DOI] [PubMed] [Google Scholar]
- 29.Schwab F, Dubey A, Pagala M, et al. Adult scoliosis: a health assessment analysis by SF-36. Spine 2003; 28:602–606. [DOI] [PubMed] [Google Scholar]
- 30.Lafage V, Schwab F, Patel A, et al. Pelvic tilt and truncal inclination: two key radiographic parameters in the setting of adults with spinal deformity. Spine (Phila Pa 1976) 2009; 34:E599–E606. [DOI] [PubMed] [Google Scholar]
- 31.Schwab F, Patel A, Ungar B, et al. Adult spinal deformity-postoperative standing imbalance: how much can you tolerate? An overview of key parameters in assessing alignment and planning corrective surgery. Spine (Phila Pa 1976) 2010; 35:2224–2231. [DOI] [PubMed] [Google Scholar]
- 32.Marks MC, Stanford CF, Mahar AT, et al. Standing lateral radiographic positioning does not represent customary standing balance. Spine 2003; 28:1176–1182. [DOI] [PubMed] [Google Scholar]
- 33.Horton WC, Brown CW, Bridwell KH, et al. Is there an optimal patient stance for obtaining a lateral 36″ radiograph? A critical comparison of three techniques. Spine (Phila Pa 1976) 2005; 30:427–433. [DOI] [PubMed] [Google Scholar]
- 34.Rillardon L, Levassor N, Guigui P, et al. Validation of a tool to measure pelvic and spinal parameters of sagittal balance. Rev Chir Orthop Reparatrice Appar Mot 2003; 89:218–227. [PubMed] [Google Scholar]
- 35.El Fegoun AB, Schwab F, Gamez L, et al. Center of gravity and radiographic posture analysis: a preliminary review of adult volunteers and adult patients affected by scoliosis. Spine (Phila Pa 1976) 2005; 30:1535–1540. [DOI] [PubMed] [Google Scholar]
- 36.Smith JS, Klineberg E, Schwab F, et al. Change in classification grade by the SRS-Schwab Adult Spinal Deformity Classification predicts impact on health-related quality of life measures: prospective analysis of operative and nonoperative treatment. Spine (Phila Pa 1976) 2013; 38:1663–1671. [DOI] [PubMed] [Google Scholar]
- 37.Terran J, Schwab F, Shaffrey CI, et al. The SRS-Schwab adult spinal deformity classification: assessment and clinical correlations based on a prospective operative and nonoperative cohort. Neurosurgery 2013; 73:559–568. [DOI] [PubMed] [Google Scholar]
- 38.Lenke LG, Betz RR, Harms J, et al. Adolescent idiopathic scoliosis: a new classification to determine extent of spinal arthrodesis. J Bone Joint Surg Am 2001; 83-A:1169–1181. [PubMed] [Google Scholar]
- 39.Glassman SD, Bridwell K, Dimar JR, et al. The impact of positive sagittal balance in adult spinal deformity. Spine (Phila Pa 1976) 2005; 30:2024–2029. [DOI] [PubMed] [Google Scholar]
- 40.Charlson ME, Pompei P, Ales KL, et al. A new method of classifying prognostic comorbidity in longitudinal studies: development and validation. J Chronic Dis 1987; 40:373–383. [DOI] [PubMed] [Google Scholar]
- 41.Bess S, Boachie-Adjei O, Burton D, et al. Pain and disability determine treatment modality for older patients with adult scoliosis, while deformity guides treatment for younger patients. Spine (Phila Pa 1976) 2009; 34:2186–2190. [DOI] [PubMed] [Google Scholar]
- 42.Glassman SD, Bridwell K, Dimar JR, et al. The impact of positive sagittal balance in adult spinal deformity. Spine 2005; 30:2024–2029. [DOI] [PubMed] [Google Scholar]
- 43.Schwab F, Lafage V, Patel A, et al. Sagittal plane considerations and the pelvis in the adult patient. Spine (Phila Pa 1976) 2009; 34:1828–1833. [DOI] [PubMed] [Google Scholar]
- 44.Pellise F, Vila-Casademunt A, Ferrer M, et al. Impact on health related quality of life of adult spinal deformity (ASD) compared with other chronic conditions. Eur Spine J 2015; 24:3–11. [DOI] [PubMed] [Google Scholar]