Abstract
This study investigated left ventricular (LV) systolic dysfunction associated with differential strain among myocardial layers in primary hypertension (PH) patients with or without LV hypertrophy (LVH), and normal patients.
In 63 PH and 42 healthy patients, two-dimensional speckle tracking echocardiography was used to measure the peak systolic longitudinal and circumferential strain of the myocardial subendocardial, middle and subepicardial layers, and the peak systolic radial strain. To assess LV systolic function, the apical long axis, 4- and 2-chamber views, and parasternal short axis at the basal, middle, and apical levels were acquired by cardiovascular ultrasound (Vivid E9, GE Healthcare, USA).
Overall, the pattern in peak systolic longitudinal strain among myocardial layers was subendocardial > middle > subepicardial. In the peak systolic circumferential strain, this was middle > subepicardial > subendocardial. The peak systolic longitudinal strain was normal > NLVH > LVH. Among the groups, the peak systolic circumferential strain at the basal parasternal short-axis level was statistically similar, but at the middle and the apical parasternal short-axis levels were NLVH > normal > LVH. In normal and NLVH patients, the peak radial strain was middle > apical > basal, and in LVH patients was apical > middle > basal. The peak averages of the longitudinal and subendocardial circumferential strains differed significantly when LVH compared with NLVH and normal patients.
The systolic function of PH patients was damaged in comparison with normal individuals, which could be detected conveniently and accurately using two-dimensional speckle tracking echocardiography.
INTRODUCTION
Primary hypertension (PH) is a very common cardiac disease. In recent years, the incidence of PH and its associated mortality have increased annually. High blood pressure damages the compliance of the heart, and detrimentally affects left ventricular (LV) diastolic function.1,2 Primary hypertension also, however, damages systolic function.
To investigate cardiac systolic function in terms of velocity and strain, one of the most used echocardiography methods is tissue Doppler echocardiography.3,4 Its dependence on angle, however, makes for poor reproducibility of the results.5 Two-dimensional speckle tracking echocardiography (two-dimensional STE) is angle independent and delivers standard two-dimensional ultrasound images that track the movement of natural acoustic markers frame-by-frame. This enables the accurate measurement of velocity, strain, strain rate, rotation degrees, and torsion.6–9 Presently, there is a paucity of research in the literature regarding peak systolic longitudinal strain and circumferential strain of the subendocardial, middle, and subepicardial myocardial layers, or the peak systolic radial strain in PH patients.10 For these problems, two-dimensional STE could be useful.
Therefore, for this study, we used two-dimensional STE to compare PH patients, with or without LV wall hypertrophy (LVH), and normal healthy individuals to clarify the peak radial strain and peak systolic longitudinal strain and peak circumferential strain of the subendocardial, middle, and subepicardial myocardial layers. With these data, we evaluated the systolic function of these 3 groups.
METHODS
The Human Subjects Committee of Changzhou No. 2 People's Hospital approved this study. Recruitment to the study followed a full explanation of our methods including the fact that there was no risk of harm. Verbal consent was accepted.
Study Sample
A total of 63 PH patients and 42 normal patients were chosen for this research. All the PH patients met the criteria for PH of the World Health Organization and International Society of Hypertension.11
According to LV mass index,12 all the PH patients were divided into 2 groups. With a LV mass index >125 g/m2 in men and a LV mass index >110 g/m2 in women were considered to have LVH (n = 28).12 The PH patients without LVH were considered as NLVH (n = 35).
The normal patients had no evidence of hypertension and any other heart diseases. All of the physical examination tests, electrocardiogram, and echocardiography were normal.13
Conventional Two-dimensional Doppler Echocardiography
The 63 PH patients and 42 normal patients all had conventional two-dimensional Doppler echocardiography (Vivid E9, GE Healthcare, USA). The following were measured in the parasternal long-axis view of the LV by M-mode: left atrial diameter, thickness of the interventricular septum at end diastole, and thickness of the posterior LV wall at end diastole.
Simpson biplane method was used to measure the LV ejection fraction. The peak filling velocities during early (E) and late (A) diastole of the anterior mitral valve were measured by pulsed-wave Doppler, and the E/A ratio was calculated.
Electrocardiography leads were connected to each individual in all groups. All individuals were instructed to hold their breath. For offline analysis, the following were acquired: standard high frame rate at the apical long axis, 4- and 2-chamber views, and parasternal short axis at the basal, middle, and apical levels of 3 consecutive cardiac cycles.
Data Analysis for Left Ventricular Strain
After acquired the apical long axis, 4- and 2-chamber views, parasternal short axis at the basal, middle, and apical levels of three consecutive cardiac cycles, the different views were analyzed using two-dimensional STE software (2D-Strain, EchoPac PC v.7.x.x, GE Healthcare, Horten, Norway). Used the button apical long axis, apical 4 chamber, apical 2 chamber, short axis at the mitral valve level, short axis at the papillary level, and short axis at the apical level to sketched the subendocardial, respectively, and confirmed the aortic valve closure time in the apical long axis view, then the software would create a region of interest automatically, which contained subendocardial, middle, and subepicardial, then adjusted the region of interest to make the myocardial included well. Upon delineating the region of interest, the software was used to divide the LV into 6 segments. Then the peak systolic longitudinal strain, circumferential strain of the subendocardial, middle, and subepicardial myocardial layers, and the peak systolic radial strain of the LV were calculated.14
Statistical Analysis
All of the analyses were conducted using SPSS 17.0 software (SPSS, Chicago, IL). Differences among the PH patients (LVH and NLVH) and normal patients were compared with 1-way analysis of variance. Comparisons of 2 samples were made using the Student–Newman–Keuls test. Data are presented as the mean ± standard deviation. In all tests, a difference was considered statistically significant at P < 0.05.
RESULTS
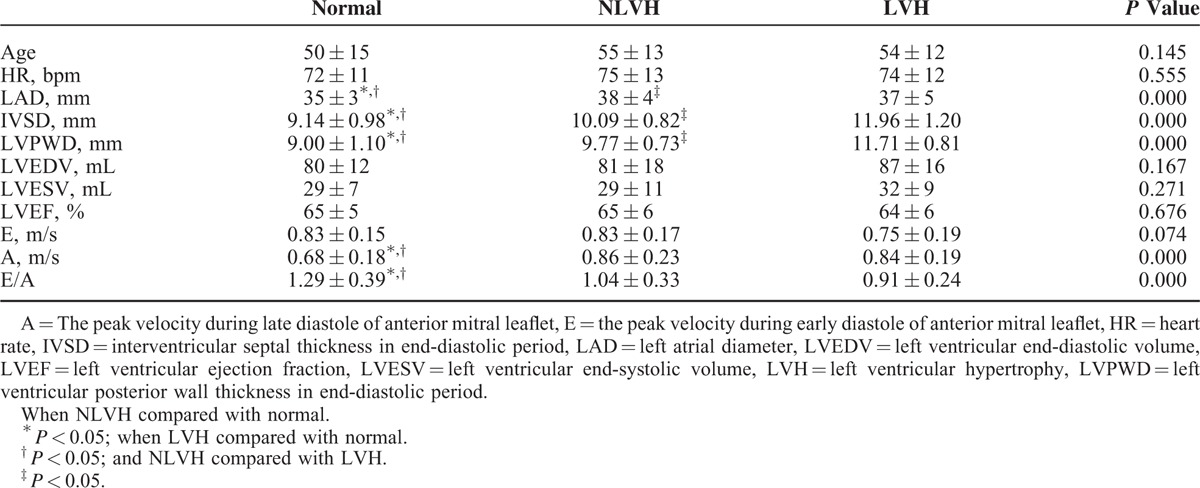
There were significant differences in the left atrial diameter, thickness of the interventricular septum at end diastole, thickness of the posterior left ventricular wall at end diastole, A, and E/A among the PH (NLVH or LVH), and normal groups (P < 0.05; Table 1). The pattern in normal patients, NLVH, and LVH patients in left atrial diameter, thickness of the interventricular septum at end diastole, thickness of the posterior left ventricular wall at end diastole were: LVH > NLVH > normal patients. The A value was minimum and the E/A was maximal in normal group. There were no differences in E, or LV end-diastolic volume, end-systolic volume, or ejection fraction (P > 0.05; Table 1).
TABLE 1.
The Basic Information From Conventional Two-dimensional Doppler Echocardiography (Mean ± SD)
In all the patients, the pattern of peak systolic longitudinal strain of the myocardial layers was subendocardial > middle > subepicardial (Table 2; Figures 1A and 2A). The peak systolic longitudinal strain in the experimental groups was normal patients > NLVH > LVH.
TABLE 2.
Comparison of the Peak Systolic Longitudinal Strain of the Subendocardial, the Middle and the Subepicardial Myocardial (%) (Mean ± SD)
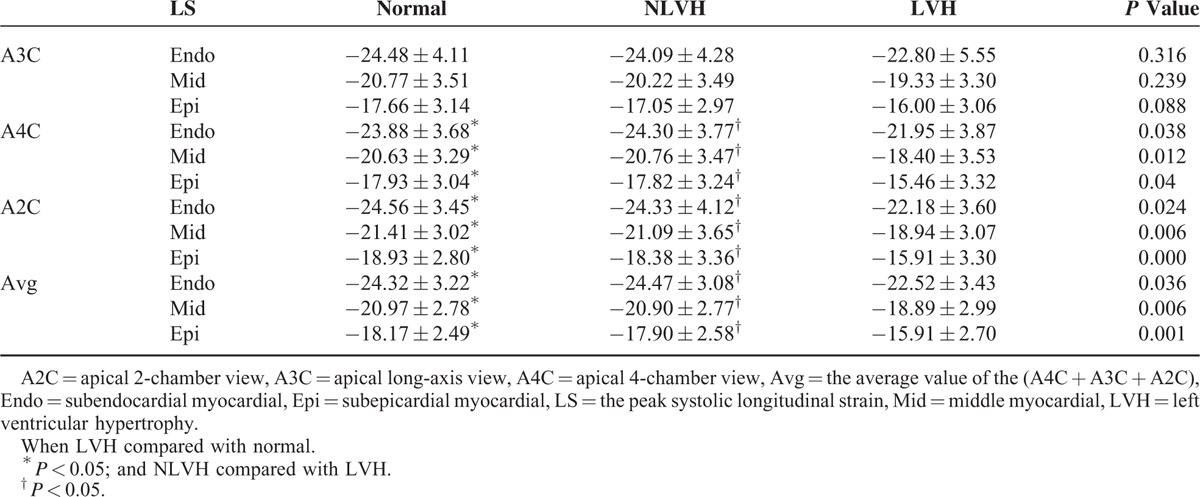
FIGURE 1.
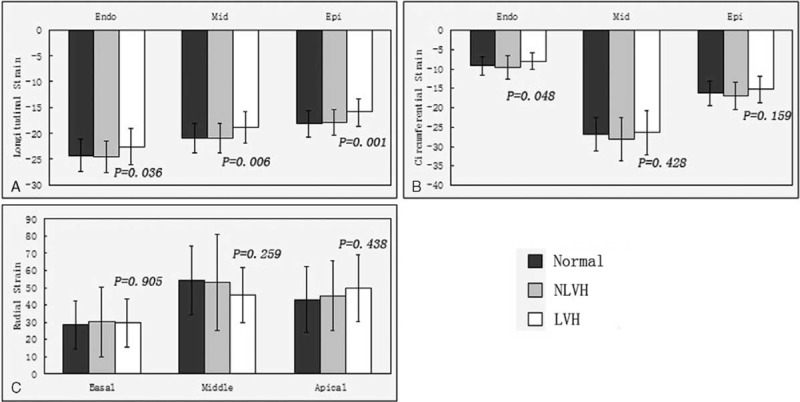
A, The average of the peak longitudinal systolic strain of the subendocardial, the middle and the subepicardial among the normal subjects, NLVH and LVH patients. B, The average of the peak circumferential systolic strain of the subendocardial, the middle and the subepicardial among the normal subjects, NLVH and LVH patients. C, The peak radial systolic strain of the basal, middle, and apical among the normal subjects, NLVH and LVH patients. LVH = left ventricular hypertrophy, NLVH = non-left ventricular hypertrophy.
FIGURE 2.
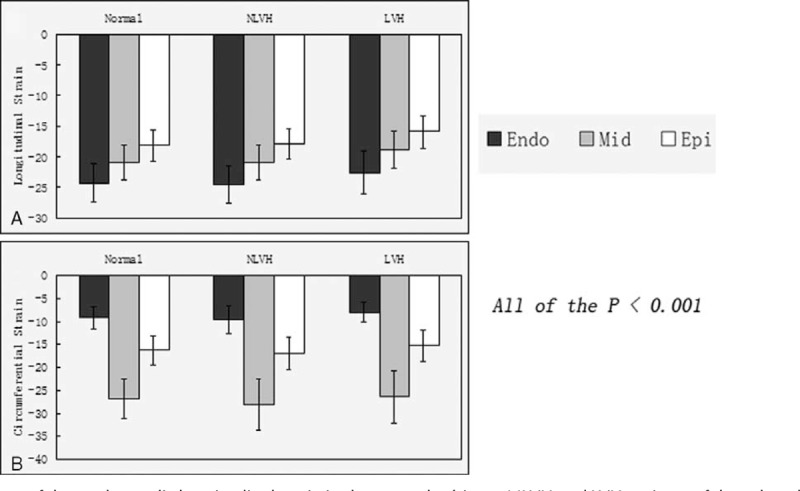
A, The average of the peak systolic longitudinal strain in the normal subjects, NLVH and LVH patients of the subendocardial, the middle, and the subepicardial. B, The average of the peak systolic circumferential strain in the normal subjects, NLVH and LVH patients of the subendocardial, the middle, and the subepicardial. LVH = left ventricular hypertrophy, NLVH = non-left ventricular hypertrophy.
Between the normal and NLVH patients, there was no significant difference in peak systolic longitudinal strain. Left ventricular hypertrophy compared with NLVH and normal patients, all of the strain index had significant difference exclude the values detected in the apical long-axis view.
Comparing the average peak systolic longitudinal strain in the subendocardial, middle, and subepicardial between the normal and NLVH patients, there was no significant difference. Left ventricular hypertrophy compared with NLVH and normal patients, all of the average peak systolic longitudinal strain in the subendocardial, middle, and subepicardial had significant difference.
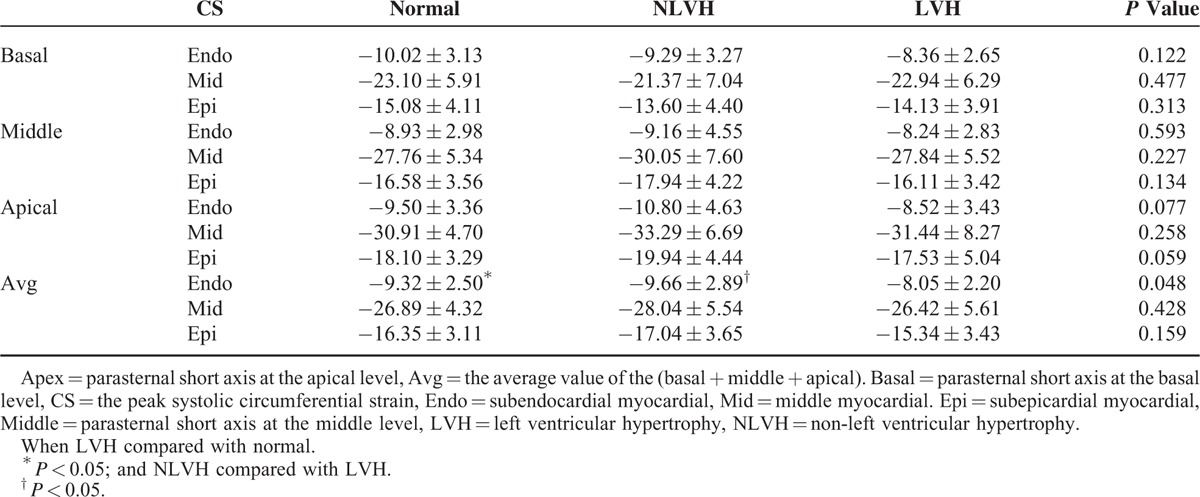
In all the patients, the pattern of peak systolic circumferential strain of the myocardial layers was middle > subepicardial > subendocardial (Table 3; Figures 1B and 2B). Regarding the peak systolic circumferential strain among the 3 groups, in the parasternal short axis at the basal level all of the data were very similar. In the parasternal short axis at the middle and apical levels, peak systolic circumferential strain was in the pattern NLVH > normal subjects > LVH. Among the 3 groups, the peak systolic circumferential strain of the parasternal short axis at the basal, middle, and apical levels was comparable. Comparison the average peak systolic circumferential strain in the subendocardial, middle, and subepicardial, the subendocardial strain had significant difference when LVH patients compared with normal patients and the NLVH patients.
TABLE 3.
Comparison of the Peak Systolic Circumferential Strain of the Subendocardial, the Middle and the Subepicardial Myocardial (%) (Mean ± SD)
The peak radial strain of the subendocardial, middle, and the subepicardial myocardial layers in the parasternal short axis at the basal, middle, and apical levels were not significantly different (Table 4; Figures 1C and 3). In the normal and NLVH patients, the peak radial strain among the parasternal short-axis levels was middle > apical > basal. In the LVH group, the peak radial strain was apical > middle > basal.
TABLE 4.
Comparison of the Peak Radial Strain of the Subendocardial, the Middle, and the Subepicardial Myocardial (%) (Mean ± SD)

FIGURE 3.
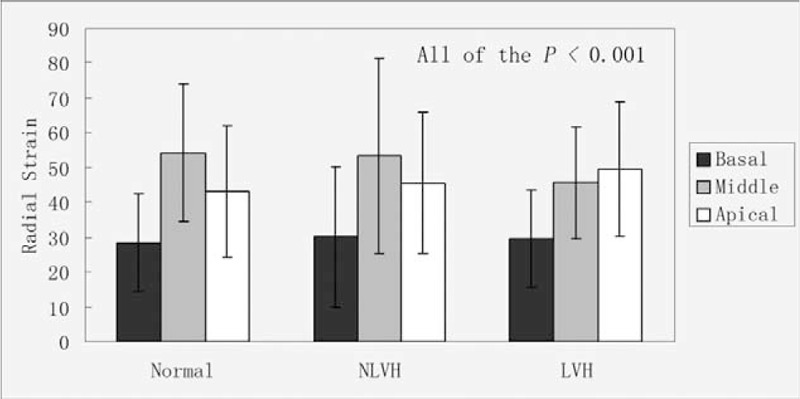
The peak systolic radial strain in the normal subjects, NLVH and LVH patients of the basal, middle, and apical.
DISCUSSION
Primary hypertension is a very common and important cardiac disease. Left ventricular hypertrophy and cardiac enlargement are common complications. Left ventricular hypertrophy is an important factor in heart failure among PH patients. In the early stage, it influences diastolic function.15 Regarding systolic function, recent research has mainly focused on myocardial strain, strain rate and, torsion about the LV.16–21 There are few investigations of the strain of the subendocardial, middle, and subepicardial myocardial layers.
A normal myocardium consists of subendocardial, middle, and subepicardial fibers. Torrent-Guasp et al22 first reported the presence of a so-called myocardial band, and considered that the band consisted of a helix formed by basal and apical loops. The different orientations of the ventricular muscle fibers lead to the spindle-like motions of the heart, similar to the wringing of a rag to squeeze out water.8 The muscle fibers of the subepicardial and subendocardial layers are the most longitudinal, and when contracted, they cause longitudinal motion. The fibers of the middle layers are mainly circumferential, and lead to circumferential motion.23 When the myocardial band contracts and relaxes, 3 different motions (longitudinal, circumferential, and radial), result in rotational movement. Because of the particular motion of the heart, there is strain and rotation throughout the cardiac cycles. The strain index can reflect the cardiac function well from the anterior research.
From the values for E, A, and E/A, we know that in the early stage, the PH patients had diastolic dysfunction.
Peak Systolic Longitudinal Strain
The peak systolic longitudinal strain among the myocardial layers in all the groups followed the pattern: subendocardial > middle > subepicardial (Figure 4). We consider that this phenomenon is because of the contractual sequence of the muscle fibers during the cardiac cycle. Normal myocardial muscle fibers are longitudinal or circumferential, and the subepicardial and subendocardial layers are oriented longitudinal, whereas the middle layers are circumferential. In patients with high blood pressure, the subendocardial layer is susceptible to ischemia or fibrosis.17 To maintain normal systolic function, the strain is increased. In the current study, we found that the peak systolic longitudinal strain was higher in the LVH group than in the normal and NLVH patients. From this, we could confirm that PH patients with LVH had systolic dysfunction. Although there was no difference in peak systolic longitudinal strain between the NLVH and normal patients, the value of the latter was higher. We consider that in the early stage of PH, systolic function is damaged. We conclude that the peak systolic longitudinal strain can reflect systolic function very conveniently and accurately in PH patients. The longitudinal function was very sensitive to early changes in PH patients.
FIGURE 4.
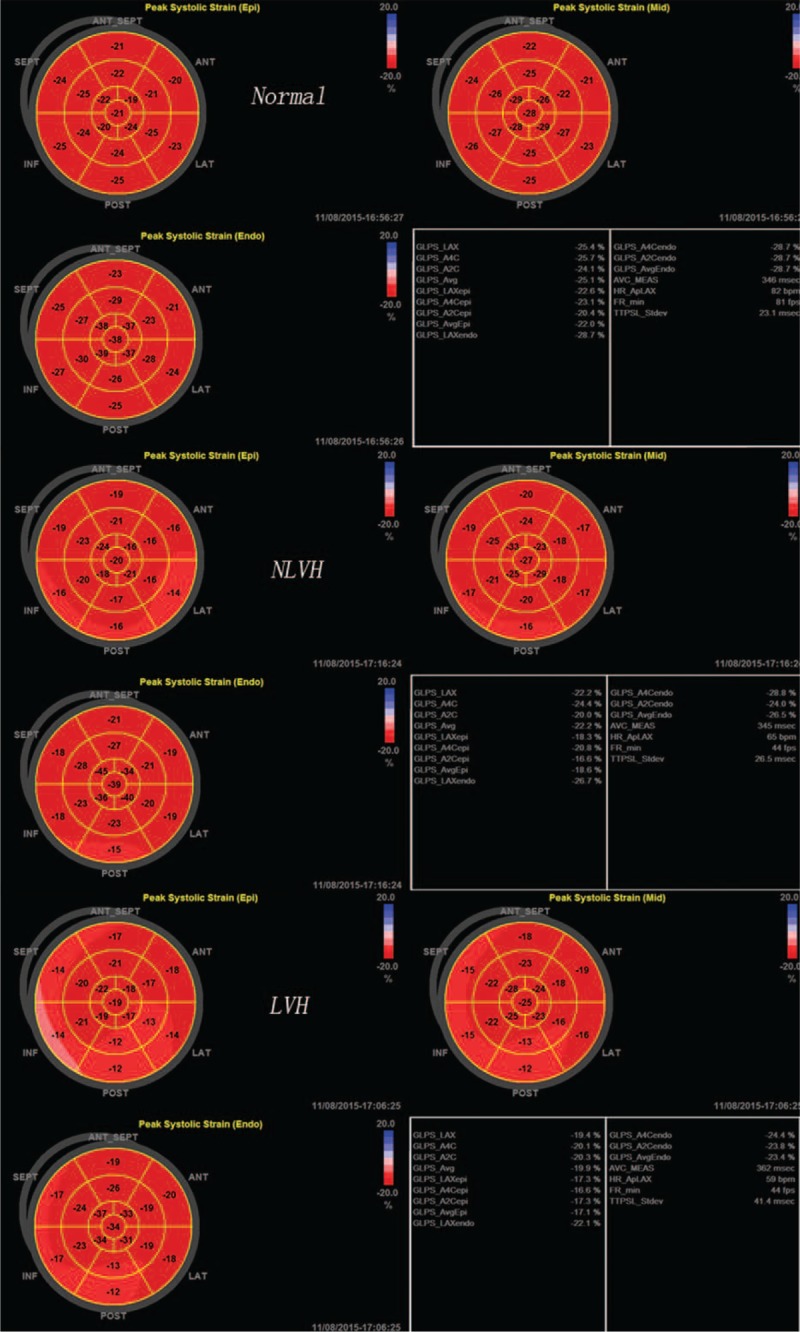
The bull's eyes of the peak systolic longitudinal strain of the normal subjects, NLVH and LVH patients.
Peak Systolic Circumferential Strain
The pattern of peak systolic circumferential strain among the myocardial layers in all patients was middle > subepicardial > subendocardial. This result is consistent with the muscle fibers, as the middle layers mainly consist of circumferential fibers, so circumferential motion is affected mainly by the middle layers. In the parasternal short axis at the basal level, the peak systolic circumferential strain was similar among the LVH, NLVH, and normal groups. In the parasternal short axis at the middle and apical levels, the pattern was NLVH > normal patients > LVH. Lorell et al15 reported that when a heart is under a hemodynamic burden, the heart can use the Frank–Starling mechanism, augment muscle mass, and recruit neurohormonal mechanisms to compensate. In our current research, we found that in the early stage of PH (ie, NLVH), the heart appears to normalize systolic function by increasing the circumferential strain. In the LVH stage, the circumferential strain, however, was less, and we conclude that the systolic function was damaged.
Peak Systolic Radial Strain
Radial strain had no difference among the 3 groups, but, the radial strain trend was similar between normal patients and NLVH. According to this, we concluded that the systolic function of LVH was damaged.
Peak Average Longitudinal Strain and Circumferential Strain
When LVH compared with NLVH and normal patients, we found that all of the peak average longitudinal strain and the average circumferential strain of the subendocardial had decreased. We concluded that the systolic function was damaged in LVH patients.
LIMITATIONS
Achieving the study objectives was hampered in that the images were two-dimensional, and when the speckles move out of the plane of the image during the cardiac cycle, they cannot be tracked successfully by the EchoPAC software. The number of the PH patients is small, and long-term analysis with the larger samples is needed.
CONCLUSIONS
Our results for the peak systolic longitudinal strain, circumferential strain in the subendocardial, middle, and subepicardial myocardial layers, and peak systolic radial strain indicated that the longitudinal function is very sensitive to early changes in PH patients. Hearts of the PH patients without LVH appeared to compensate for early systolic changes via increased circumferential strain. The radial strain in PH patients with LVH differed in the basal, middle, and apical areas of the parasternal short axis from that of the other 2 groups. We thus conclude that the systolic function is damaged in PH patients. This systolic dysfunction could be detected conveniently and accurately with two-dimensional STE.
Footnotes
Abbreviations: CS = The peak systolic circumferential strain; LS = The peak systolic longitudinal strain; LVH = left ventricular hypertrophy; LV = left ventricular or left ventricle; NLVH = non-left ventricular hypertrophy; PH = primary hypertension; RS = The peak systolic radial strain; Two-dimensional STE = two-dimensional speckle tracking echocardiography.
The authors have no conflicts of interest to disclose.
REFERENCES
- 1.Ganau A, Devereux RB, Roman MJ, et al. Patterns of left ventricular hypertrophy and geometric remodeling in essential hypertension. J Am Coll Cardiol 1992; 19:1550–1558. [DOI] [PubMed] [Google Scholar]
- 2.Santoro A, Caputo M, Antonelli G, et al. Left ventricular twisting as determinant of diastolic function: a speckle tracking study in patients with cardiachypertrophy. Echocardiography 2011; 28:892–898. [DOI] [PubMed] [Google Scholar]
- 3.Sun JP, Popovic ZB. Noninvasive quantification of regional myocardial function using Doppler-derived velocity, displacement, strain rate, and strain in healthy volunteers: effects of aging. J Am Soc Echocardiogr 2004; 2:132–138. [DOI] [PubMed] [Google Scholar]
- 4.Van de Veire NR, De Sutter J, Bax JJ, et al. Technological advances in tissue Doppler imaging echocardiography. Heart 2008; 94:1065–1074. [DOI] [PubMed] [Google Scholar]
- 5.Nesbitt GC, Mankad S, Oh JK. Strain imaging in echocardiography: methods and clinical applications. Int J Cardiovasc Imaging 2009; 25:9–22. [DOI] [PubMed] [Google Scholar]
- 6.Notomi Y, Lysyansky P, Setser RM, et al. Measurement of ventricular torsion by two-dimensional ultrasound speckle tracking imaging. J Am Coll Cardiol 2005; 45:2034–2041. [DOI] [PubMed] [Google Scholar]
- 7.Hurlburt HM, Aurigemma GP, Hill JC, et al. Direct ultrasound measurement of longitudinal, circumferential, and radial strain using 2-dimensional strain imaging in normal adults. Echocardiography 2007; 24:723–731. [DOI] [PubMed] [Google Scholar]
- 8.Sengupta PP, Tajik AJ, Chandrasekaran K, et al. Twist mechanics of the left ventricle: principles and application. JACC Cardiovasc Imaging 2008; 1:366–376. [DOI] [PubMed] [Google Scholar]
- 9.Burns AT, La Gerche A, Prior DL, et al. Left ventricular torsion parameters are affected by acute changes in load. Echocardiography 2010; 27:407–414. [DOI] [PubMed] [Google Scholar]
- 10.Sengupta SP, Caracciolo G, Thompson C, et al. Early impairment of left ventricular function in patients with systemic hypertension: new insights with 2-dimensional speckle tracking echocardiography. Indian Heart J 2013; 65:48–52. [DOI] [PMC free article] [PubMed] [Google Scholar]
- 11.Mancia G, De Backer G, Dominiczak A, et al. Guidelines for the management of arterial hypertension: the task force for the management of arterial hypertension of the European Society of Hypertension (ESH) and of the European Society of Cardiology (ESC). J Hypertens 2007; 25:1105–1187. [DOI] [PubMed] [Google Scholar]
- 12.Hammond IW, Devereux RB, Alderman MH, et al. The prevalence and correlates of echocardiography left ventricular hypertrophy among employed patients with uncomplicated hypertension. J Am Coll Cardiol 1986; 7:639–650. [DOI] [PubMed] [Google Scholar]
- 13.Huang J, Yan ZN, Ni XD, et al. Left ventricular longitudinal rotation changes in primary hypertension patients with normal left ventricular ejection fraction detected by two-dimensional speckle tracking imaging. J Hum Hypertens 2016; 30:30–34. [DOI] [PubMed] [Google Scholar]
- 14.Ni XD, Huang J, Hu YP, et al. Assessment of the rotation motion at the papillary muscle short-axis plane with normal subjects by two-dimensional speckle tracking imaging: a basic clinical study. PLoS One 2013; 8:e83071. [DOI] [PMC free article] [PubMed] [Google Scholar]
- 15.Lorell BH, Carabello BA. Left ventricular hypertrophy: pathogenesis, detection, and prognosis. Circulation 2000; 102:470–479. [DOI] [PubMed] [Google Scholar]
- 16.Minoshima M, Noda A, Nishizawa T, et al. Endomyocardial radial strain imaging and left ventricular relaxation abnormalities in patients with hypertrophic cardiomyopathy or hypertensive left ventricular hypertrophy. Circ J 2009; 73:2294–2299. [DOI] [PubMed] [Google Scholar]
- 17.Kouzu H, Yuda S, Muranaka A, et al. Left ventricular hypertrophy causes different changes in longitudinal, radial, and circumferential mechanics in patients with hypertension: a two-dimensional speckle tracking study. J Am Soc Echocardiogr 2011; 24:192–199. [DOI] [PubMed] [Google Scholar]
- 18.Goebel B, Gjesdal O, Kottke D, et al. Detection of irregular patterns of myocardial contraction in patients with hypertensive heart disease: a two-dimensional ultrasound speckle tracking study. J Hypertens 2011; 29:2255–2264. [DOI] [PubMed] [Google Scholar]
- 19.Imbalzano E, Zito C, Carerj S, et al. Left ventricular function in hypertension: new insight by speckle tracking echocardiography. Echocardiography 2011; 28:649–657. [DOI] [PubMed] [Google Scholar]
- 20.Russo C, Jin Z, Homma S, et al. Relationship of multidirectional myocardial strain with radial thickening and ejection fraction and impact of left ventricular hypertrophy: a study in a community-based cohort. Echocardiography 2013; 30:794–802. [DOI] [PMC free article] [PubMed] [Google Scholar]
- 21.Cameli M, Lisi M, Righini FM, et al. Left ventricular remodeling and torsion dynamics in hypertensive patients. Int J Cardiovasc Imaging 2013; 29:79–86. [DOI] [PubMed] [Google Scholar]
- 22.Torrent-Guasp F, Ballester M, Buckberg GD, et al. Spatial orientation of the ventricular muscle band: physiologic contribution and surgical implications. J Thorac Cardiovasc Surg 2001; 2:389–392. [DOI] [PubMed] [Google Scholar]
- 23.Nakatani S. Left ventricular rotation and twist: why should we learn? J Cardiovasc Ultrasound 2011; 19:1–6. [DOI] [PMC free article] [PubMed] [Google Scholar]


