. 2015 Oct 6;4:e09617. doi: 10.7554/eLife.09617

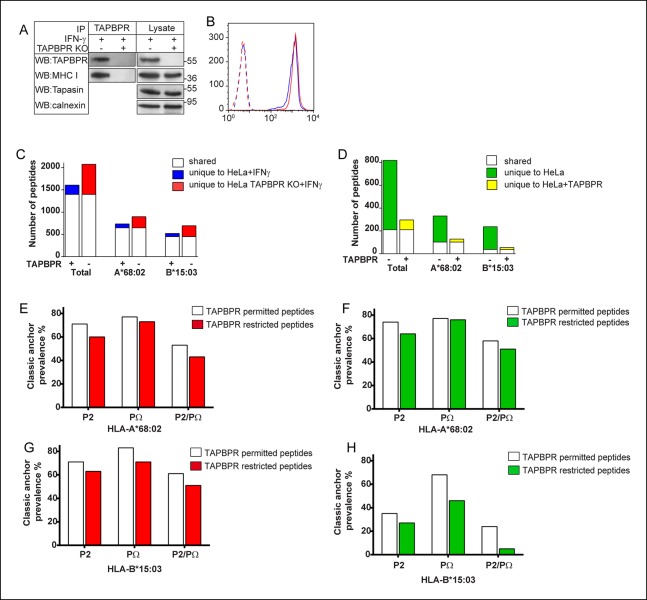
Figure 5. TAPBPR expression alters the peptide repertoire presented by MHC class I on cells.

(A) The TAPBPR:MHC class I complex was immunoprecipitated from IFN-γ treated HeLa and HeLa-TAPBPR KO cells. Western blot analysis was performed for TAPBPR (mouse anti-TAPBPR), tapasin (Rgp48N), MHC class I (HC10) and calnexin on lysates and TAPBPR immunoprecipitates as indicated. The data is representative of three independent experiments. (B) Cytofluorometric analysis of MHC class I detected with W6/32 on IFN-γ treated HeLa (Blue line) and HeLa-TAPBPR KO cells (Red line). Staining with an isotype control on both cell lines (dashed lines) is included as a control. (C,D) Peptide-MHC class I complexes were isolated by affinity chromatography using W6/32 from (C) IFN-γ treated HeLa and HeLa-TAPBPR KO cells or (D) HeLa and HeLa overexpressing WT-TAPBPR. Eluted peptides were analysed using LC-MS/MS. Graphs show the total number of peptides and also the number of peptides assigned as HLA-A*68:02 and HLA-B*15:03 binders based on their peptide motifs using the online programme NetMHC. The number of peptides shared between the cell lines (white bar) and the number of peptides unique to each cell line (coloured bars) is shown. The data was generated from tandem MS analysis performed five times on one immunoprecipitate. Two independent biological repeats have been performed in two different cell lines (HeLa-S cells shown in Figure 5—figure supplement 1, and KBM-7 cells shown in Figure 6) in which a similar pattern of increased peptide diversity in TAPBPR depleted cells was observed. (E–H) Conservation of P2 and C-terminal anchor residues (PΩ). Plots show prevalence of classic peptide anchors on (E,F) HLA-A*68:02 or (G, H) HLA-B*15:03. Bars show classic anchor conservation at P2, PΩ and P2/PΩ combined for (E,G) shared peptides found in both IFN-γ treated HeLa and HeLa TAPBPR KO cells (white bar) (presumably permitted expression in the presence of TAPBPR) and peptides unique to HeLa TAPBPR KO + IFNγ cells (red bar) (presumably restricted in the presence of TAPBPR), (F,H) shared peptides found in both HeLa and HeLa over-expressing TAPBPR (white bar) (presumably permitted expression in the presence of TAPBPR) and peptides unique to HeLa (green bar) (presumably restricted in the presence of TAPBPR).

DOI: http://dx.doi.org/10.7554/eLife.09617.009

Figure 5.

Figure 5—figure supplement 1. Increased peptide diversity on MHC class I in the absence of TAPBPR in IFN-γ treated HeLa-S cells.

Figure 5—figure supplement 1.

Approximately 2 × 108 HeLa-S and HeLa-S depleted of TAPBPR expression using shRNA specific for TAPBPR (Boyle et al., 2013) were induced with IFN-γ treated for 72 hr. This was repeated three time (Batch no. 1–3) in order to harvest >5 × 108 cells of each line. (A) To confirm the efficient induction of TAPBPR by IFN-γ and the depletion of TAPBPR in shTAPBPR treated cells, a small fraction of the cells were lysed in 1% digitonin-TBS, TAPBPR was immunoprecipitated using the rabbit anti-TAPBPR polyclonal R014 and western blot analysis was performed for TAPBPR (using mouse anti-TAPBPR). (B) Peptide-MHC class I complexes were isolated using affinity chromatography using W6/32 from IFN-γ treated HeLa-S and shTAPBPR depleted HeLa-S cells. Eluted peptides were analysed using LC-MS/MS. The Graph show the total number of shared and unique peptides, and also the number of peptides assigned as HLA-A*68:02 and HLA-B*15:03 binders based on their peptide motifs. Note: surface expression of MHC class I detected by W6/32 is similar in both cells as demonstrated in Boyle et al., 2013. The number of peptides shared between the cell lines (white bar) and the number of peptides unique to each cell line (coloured bars) is shown. (C&D) Conservation of P2 and C-terminal anchor residues (PΩ). Plots show prevalence of classic peptide anchors on (C) HLA-A*68:02 or (D) HLA-B*15:03. Bars show classic anchor conservation at P2, PΩ and P2/PΩ combined for shared peptides found in both IFN-γ treated HeLa and HeLa shTAPBPR cells (white bar) (presumably permitted expression in the presence of TAPBPR) and peptides unique to HeLa shTAPBPR IFNγ cells (red bar) (presumably restricted in the presence of TAPBPR).
Figure 5—figure supplement 2. TAPBPR expression does not influence peptide length.

Figure 5—figure supplement 2.

The average length of peptide eluted from HLA-A*68:02 and HLA-B*15:03 was calculated using GraphPad Prism and compared between (A) IFN-γ treated HeLa and HeLa-TAPBPR KO cells and (B) HeLa cells and HeLa overexpressing TAPBPR. Error bars show SEM of peptide length. The p value was calculated by two-tailed t-test.