Abstract
We previously described early results of a non-chimeric operational tolerance protocol in HLA identical living donor renal transplants and now update these results. Recipients given alemtuzumab, tacrolimus/MPA with early sirolimus conversion were multiply infused with donor hematopoietic CD34+ stem cells. Immunosuppression was withdrawn by 24 months. Twelve months later operational tolerance was confirmed by rejection-free transplant biopsies. Five of the first 8 enrollees were initially tolerant one year off immunosuppression. Biopsies of 3 others after total withdrawal showed Banff 1A acute cellular rejection without renal dysfunction. With longer follow-up including 5 year post-transplant biopsies 4 of the 5 tolerant recipients remain without rejection while one developed Banff 1A without renal dysfunction. We now add 7 new subjects (2 operationally tolerant), and demonstrate time-dependent increases of circulating CD4+CD25+++CD127−FOXP3+ Tregs vs. losses of Tregs in non-tolerant subjects (p< 0.001). Gene expression signatures, developed using global RNA expression profiling of sequential whole blood and protocol biopsy samples, were highly associative with operational tolerance as early as 1 year post-transplant. The blood signature was validated by an external ITN data set. Our approach to non-chimeric operational HLA identical tolerance reveals association with Treg immunophenotypes and serial gene expression profiles.
INTRODUCTION
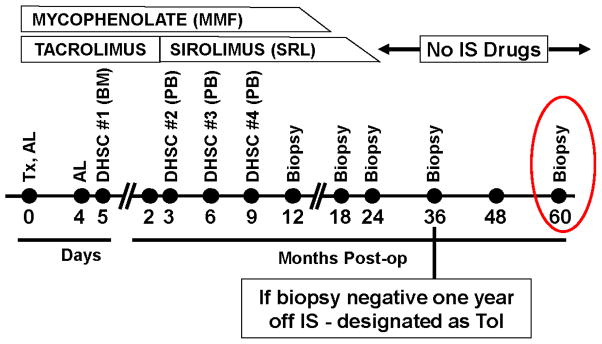
Continuous immunosuppression (IS) has prevented renal transplant (RT) rejection even between HLA identical siblings (1–3). Three United States centers are conducting RT tolerance protocols in HLA identical and disparate living donor/recipient pairs (4–11). HLA identity may be advantageously assessed, eliminating variability of immune response genes associated with donor/recipient specific HLA polymorphisms. Additionally, immunoregulation (Tregs) may be aided by self-recognition by the recipient of both donor major histocompatibility complexes (MHC) (12, 13). We described earlier in a brief communication (10) 3-year results of a tolerance protocol in 10 RT recipients HLA identical with their living donor siblings using 4 infusions of donor hematopoietic stem cells (DHSC). Alemtuzumab (Al) induction was administered, with short term tacrolimus (TAC)/mycophenolic acid (MPA) converted to sirolimus (SRL) withdrawn totally by 2 years post-operatively. Sequential transplant biopsies at 12, 18 and 24 months during IS reduction, if rejection-free, were followed by total withdrawal for 1 year and a 3 year biopsy requiring the absence of rejection. With normal renal transplant function (operational) tolerance (Tol) was designated (Figure 1). Five of the first 8 enrollees were Tol 3 years postoperatively (10). Of 3 non-tolerant (non-Tol) protocol biopsies after IS withdrawal showed Banff 1A acute cellular rejection (ACR) without renal dysfunction. The remaining 2 of the first 10 patients had unexpected native renal disease recurrence (biopsy diagnosed after proteinuria developed) by one year post-operatively. The 3 non-Tol and 2 patients with disease recurrence had IS resumed or never withdrawn.
Figure 1. Longitudinal therapy and biopsy plan in this non-chimeric HLA identical “operational” tolerance trial.
The current milestone of the trial has been extended to a biopsy at 5 years (red circle). DHSC = Donor Hematopoietic Stem Cells; Al = Alemtuzumab; MPA = Mycophenolate; SRL = Sirolimus; TAC = Tacrolimus; Tx = Transplant.
We now report on longer 5½ to 7 year follow-up with 5 year protocol RT biopsies and with 10 newer recipients added (7 of which could be followed for the effects of the protocol). There is now concrete evidence of immunoregulation using sequential elevated PBMC Treg subset immunophenotyping in the Tol recipients with loss of such with non-Tol occurring not only in parallel, but also preceding biopsies. Moreover, with newer accompanying sequential global genomic PBMC DNA microarrays carried to 6½ years post-operatively, we can not only demonstrate parallel gene signature tolerance biomarkers but high association as early as one year post-operatively with later Tol designation.
CONCISE METHODS
For details see Supplementary Materials
Patients and Informed Consent
Studies were conducted under the supervision of Northwestern IRB (study #STU00008874), an external DSMB and the FDA with written informed consents from donors and recipients, and all patient data de-identified. Participation criteria included primary renal transplant recipients aged >18 years, with panel reactive antibodies (PRAs) of <20% and negative flow crossmatches.
Clinical Protocol
Immunosuppression (Figure 1) consisted of two intravenous doses of 0.3 mg/kg of alemtuzumab, early TAC maintenance at 8 – 10 ng/ml and 500 mg of concomitant mycophenolate mofetil or 360 mg of Myfortic® (MPA) twice daily. The first DHSC infusion consisted of donor iliac crest marrow purified CD34+ cells (obtained at surgery) given on day +5 at 0.3 –1.0 x 10⁶ cells/kg recipient body weight. At 3 months, TAC was replaced by SRL (trough levels of 6 – 10 ng/ml). The second, third and fourth DHSC infusions of at least 0.7x10⁶ cells/kg each were at months 3, 6 and 9 respectively with Neupogen® mobilized peripheral blood purified CD34+ cells. With clean RT biopsies, MPA was weaned between 12–18 months and SRL between 18–24 months, i.e., complete immunosuppressive withdrawal.
Patient Follow-up Assays
Chimerism analyses were performed on cryopreserved PBMC sequentially at 3, 6, and 12 months using qPCR® (sensitivity 0.001%).
Recipient whole blood absolute cell counts for T cells and subsets (CD3, CD4, CD8, and CD127) or activation markers (CD25 and CD28), B cells and subsets (CD19, IgM/IgD, CD5, and CD27), monocytes (CD14) and natural killer cells (CD56) were performed using five color flow cytometry.
For determination of the CD4+CD25+++CD127−FOXP3+ Tregs, Ficoll isolated PBMC were incubated with monoclonal antibodies to CD4, CD25, CD127 and, after fixation and permeablization, with FOXP3-PC5 (eBioscience, San Diego, CA) according to the manufacturer’s instructions.
ImmunKnow assays were performed monthly with kits donated by Cylex® (Columbia, MD) using the manufacturer’s protocol.
Lymphoproliferative responses to mitogens and to a recall antigen (tetanus) were performed on fresh patient or healthy donor peripheral blood using standard radioactive 3H-TdR incorporation assays. PBMCs were stimulated with phytohemagglutinin (PHA) 5μg/ml (Life Technologies, Grand Island, NY) or concanavalin A (Con A) 10μg/ml (Sigma-Aldrich, St. Louis, MO) for 3 days or tetanus toxoid 5μg/ml (EMD Millipore, Billerica, MS) for 5 days. Stimulation indices (SI) were calculated using the formula: CPM in Experimental Combinations / CPM in Unstimulated Controls.
Protocol transplant biopsies were obtained preimplantation, at 12, 18, 24, 36, and 60 months postoperatively, or at other times for cause; stained using hematoxylin and eosin, periodic acid–Schiff, and Trichrome; immunostained for C4D and FOXP3, or processed for electron microscopy.
Gene expression profiling
RNA was extracted from frozen aliquots of PBMC using the Qiagen AllPrep kit (Austin, TX) and from Formalin Fixed Paraffin Embedded (FFPE) biopsy tissues using the Ambion RecoverAll Total Nucleic Acid Kit from four 20-micron sections. Biotinylated cRNA was prepared with Ambion MessageAmp Biotin II kit (Ambion) for blood and the Affymetrix SensationPlus™ FFPE Amplification and 3′ IVT Labeling kit, for the biopsies, and both blood and tissue were hybridized to Affymetrix HG HT133PM Plus arrays and run on a GeneTitan instrument (Santa Clara, CA). Normalized signals were generated using RMA. Pair-wise ANOVAs were performed to identify significantly differentially expressed genes. Class predictions were performed with Nearest Centroids in Partek Genomics Suite (St. Louis, MO). CEL files with normalized signal intensities were posted in NIH Gene Expression Omnibus (GEO) http://www.ncbi.nlm.nih.gov/geo (accession number GSE45593).
Statistical Analyses
Data were analyzed as the means ± SD. Parametric (paired t tests) and nonparametric (Mann–Whitney U test/Wilcoxon signed-rank tests) were used among compared groups. Significance was established at two-sided α levels of <0.05 using statistical software (SAS Inc., Cary, NC). For Treg percentage fold change, linear contrasts were set up to comparing the ratios between Tol and non-Tol groups at the post-transplant time points after normalizing to their respective baselines.
RESULTS
Patient Demographics and Clinical Follow-up
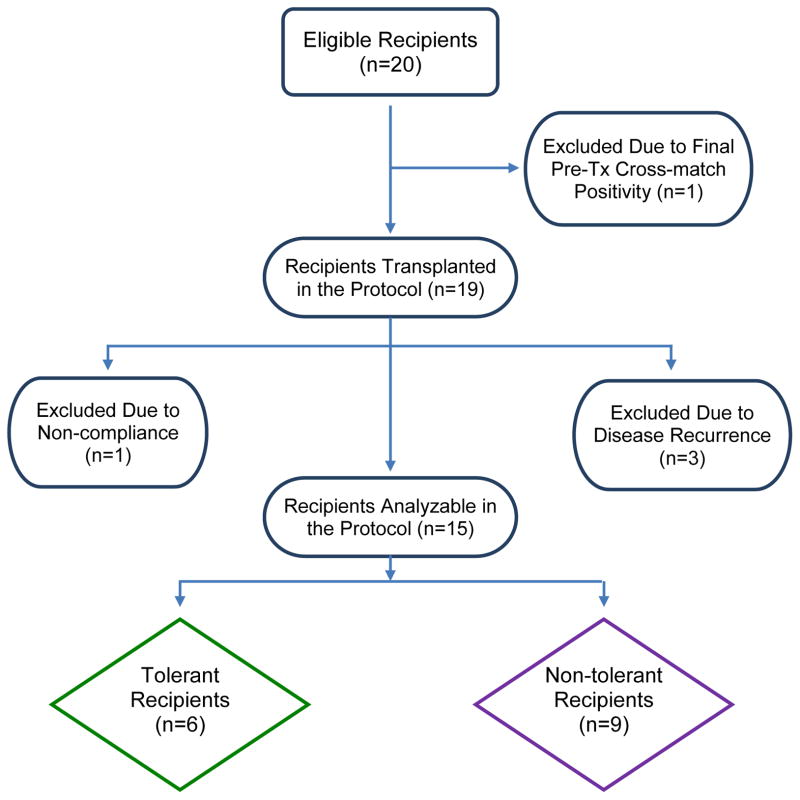
In Table 1 are demographics and follow-up of 15 of the original 20 enrollees. Unsuspected or misdiagnosed original native renal disease occurred during the first postoperative year in 3 recipients also described in the table footnotes (also see Figure 2). These three patients: 1. had no pre-operative native renal biopsy, ie. subject #10, an African-American with hypertension and slowly progressive renal failure; 2. had a native renal biopsy showing non-specific glomerular changes first thought to be due to lupus erythematosis but later not substantiated ie. subject #7; 3. in retrospect admitted to transient nephrotic syndrome early in adulthood after having been transplanted 30 years later because of type 2 diabetes ie. subject #17. All three developed proteinuria without change in creatinine clearance remaining on appropriate immunosuppression (Table 1). In addition subject #15 could not be DHSC infused, developing a donor-specific positive B cell cross match immediately preoperatively (previously negative), and #14 was taken off study six months post-operatively for failure to comply with follow-up. All five off-study patients (#7, #10, #14. #15 and #17) have maintained normal renal function (Table 1 footnotes).
Table 1.
Patient Demographics and Outcomes in Renal Transplant Recipients in the HLA-Identical DHSC Tolerance Protocol
| Pt# | Donor (D)/Recipient (R) | Preop Diagnosis of Native Disease | Peak PRA Pre-Tx | Mos Post-Tx | CrB | Latest Urine Protein per 24 Hrs/Cells | Critical Tx Biopsy Results and Time Postop | Latest Tx Biopsy Results and Time Postop | Current Daily IS Dose | Currently IS Free (mos) | % PBMC Donor Chimerism PeakE/ Current | ||
|---|---|---|---|---|---|---|---|---|---|---|---|---|---|
| AgeA | Sex | Race | |||||||||||
| 1 | 49/51 | F/M | Cau | Polycystic | 5% | 89 | 1.2 | 0/0 | Banff 1A-36 mosC | Neg-60 mos | SRL 2mgC | --- | 0.02 /0 |
| 2 | 56/54 | M/M | Cau | Multicystic | 9% | 87 | 1.1 | 0/0 | Neg-36 mos (Tol)D,F | Neg-60 mos | 0 (Tol)D | 64D | 0.10 /0 |
| 3 | 45/46 | M/F | Cau | IgA Neph | 29% | 83 | 0.9 | 0/0 | Banff 1A-25 mosC | Neg-60 mos | MMF 1gm 2xC | ---C | 0.10 /0 |
| 4 | 39/41 | F/M | Hisp | DM II | 0% | 79 | 1.6 | 0/0 | Banff 1A-36 mosC | Neg-60 mos | Prograf 2mg 2x MMF 1gm 2xC |
---C | 0.01 /0 |
| 5 | 33/39 | F/M | Cau | IgA Neph | 0% | 74 | 1.4 | 0/0 | Neg-36 mos (Tol)D | Neg-60 mos | 0 (Tol)D | 50D | 2.30 /0 |
| 6 | 35/38 | M/M | Cau | IgA Neph | 0% | 74 | 1.2 | 0/0 | Neg-36 mos (Tol)D | Neg-60 mos | 0 (Tol)D | 50D | 1.70 /0 |
| 8 | 21/24 | M/M | Hisp | Obstructive | 11% | 71 | 0.9 | 0/0 | Neg-36 mos | Banff 1A-60 mos | MMF 500mg 2x SRL 3mg |
---C | 0.47 /0 |
| 9 | 30/39 | M/M | Cau | IgA Neph | 0% | 70 | 1.3 | 0/0 | Neg-36 mos (Tol)D | Neg-60 mos | 0 (Tol)D | 46D | 0.01 /0 |
| 11 | 67/65 | F/M | Cau | HTN | 0% | 60 | 1.3 | ?/? | Neg-36 mos (Tol)D | Neg-60 mos | 0 (Tol)D | 36 | 5.20 /0 |
| 12 | 37/29 | M/M | Cau | Dysgenesis | 0% | 58 | 1.6 | 0/0 | Banff 2B-1 moC | Mild chronic interstitial changes-36 mos | Myfortic 750mg 2x Tacro 2mg 2x |
---C | 0.00 /0 |
| 13 | 49/53 | M/F | Cau | Pyelonephritis | 20% | 56 | 0.9 | 0/0 | Neg-36 mos (Tol)D | 0 (Tol)D | 32 | 0.13 /0 | |
| 16 | 43/53 | F/M | Cau | DM II | 0% | 54 | 1.5 | 0/0 | Banff 1A-26 mosC | Ned-26 mos | Myfortic 750mg 2x Tacro 1mg 2xC |
---C | 0.10 /0 |
| 18 | 52/53 | M/F | Cau | Glomerulosclerosis | 11% | 52 | 1.0 | 0/0 | Banff 1A-36 mos | MMF 500mg 2x SRL 2mg |
---C | 0.05 /0 | |
| 19 | 41/27 | F/M | Cau | Unknown | 0% | 37 | 1.1 | 0/0 | Banff 1A-27 mos | MMF 500mg 2x SRL 2mg |
---C | 0.00 /0 | |
| 20 | 21/43 | M/F | Hisp | HTN | 9% | 36 | 0.7 | 0/0 | Banff 1A-28 mos | MMF 500mg 2x SRL 2mg |
---C | 0.06 /0 | |
At transplantation.
Most recent serum creatinine (mg/dl).
Immunosuppression (IS) reinstated in patients #1, #3, #4, and #18 because of Banff 1A rejection seen on biopsies after 12 months off IS with no renal dysfunction. IS reinstated on pt #8 at 5 years for the same reason. IS reinstated on pt #19 and #20 at 26 mos and 28 mos, respectively, because of Banff 1A on biopsy. Alternatively, IS never withdrawn in patient #12 who had renal dysfunction and rejection early after transplant. Also, IS reinstated in patient #16 when rejection and renal dysfunction occurred two months after the 24-month (normal) biopsy when IS was totally withdrawn. Patients #7, 10, 14, 15, and #17 have been removed from the table because of unexpected disease recurrence (#7, #10, #17), noncompliance (#14), and development of a positive B cell crossmatch immediately pre-operatively (#15 transplanted, but not given DHSC). These patients are being followed as intent to treat only.
Neg=Negative (includes no acute or chronic rejection); Tol=Tolerant (off immunosuppression for at least one year without rejection seen on biopsy [bold type]. This has persisted to the present.).
Peak chimerism during the first year which totally disappeared after 12 months postoperatively.
This patient developed a neuroendocrine tumor in the tail of the pancreas requiring resection 4 years postoperatively while IS free for >2years. This was not considered protocol related.
Abbreviations and Table Divisions: Cau=Caucasion; Hisp=Hispanic; Hrs=Hours; HTN=Hypertension; IS=immunosuppression; MMF=Mycophenolate; mos=Months; op=Operation; PRA=Panel Reactive Antibody; SRL=Sirolimus; Tx=Transplant; Tacro=Tacrolimus. Solid dividing line=Patients longer than 5 years postoperatively.
Figure 2.
STARD Flow Diagram for the Clinical Trial.
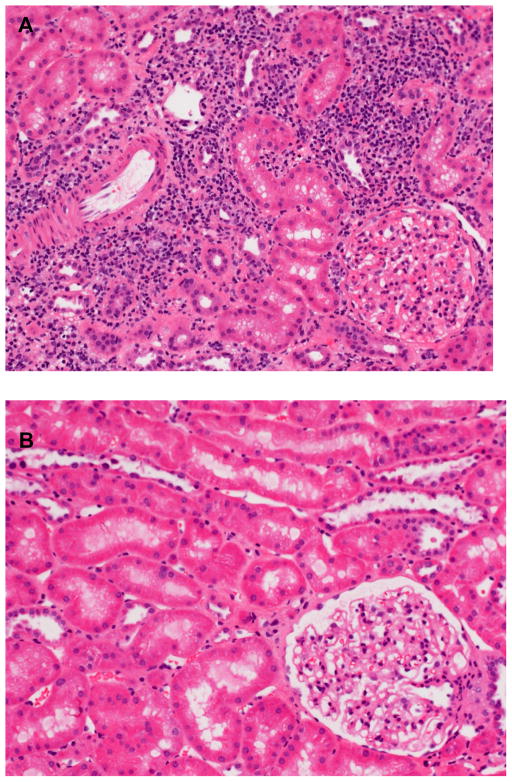
With 5 year protocol biopsies it is now evident that the Tol designation is “metastable” since patient #8, originally Tol at 3 years, developed Banff 1A ACR biopsy findings without dysfunction at 5 years requiring IS reinstitution after 3 years of being-drug free, while the other 4 remained biopsy-rejection free (Figure 3 A and B). Five of the second group of 10 enrollees had biopsy detection of rejection before or at the 3 year milestone off IS (Patients #12, #16, #18, #19 and #20, Table 1) while 2 were designated Tol. Therefore of the 15 evaluable recipients 5 are currently Tol after 5 years and 1 in more recent follow-up after 3 years. None had donor chimerism persist longer than 1 year post-operatively (Table 1), nor have any developed PRA or positive donor-specific cross matches (not shown). However, one Tol recipient (patient #2) developed a tail of the pancreas neuroendocrine tumor resected 4 years post-operatively in the absence of IS for 2 years, not considered protocol related.
Figure 3.
A. Patient #8 (Table 1) Non-Tol at 5 years. Banff 1A acute cellular rejection in H&E histopathology found at 5 years post-operatively. This patient (#8, Table 1) had been off all IS for three years, two years after no rejection was seen at the three-year biopsy milestone (one year after IS was withdrawn). There was no renal dysfunction accompanying this protocol biopsy (see Table 1). B. Patient #6 (Table 1) Tol at 5 years. No rejection was seen at five years post-operatively in patient #6 in contrast with patient #8 (Table 1) at a similar 5-year interval three years after IS was withdrawn (H&E stain). Note that the immunophenotypic Treg percentages remained high in this recipient compared with those of #8 (Figure 4B).
Immunophenotyping of T Regulatory Cells: A Biomarker for HLA Identical Tol
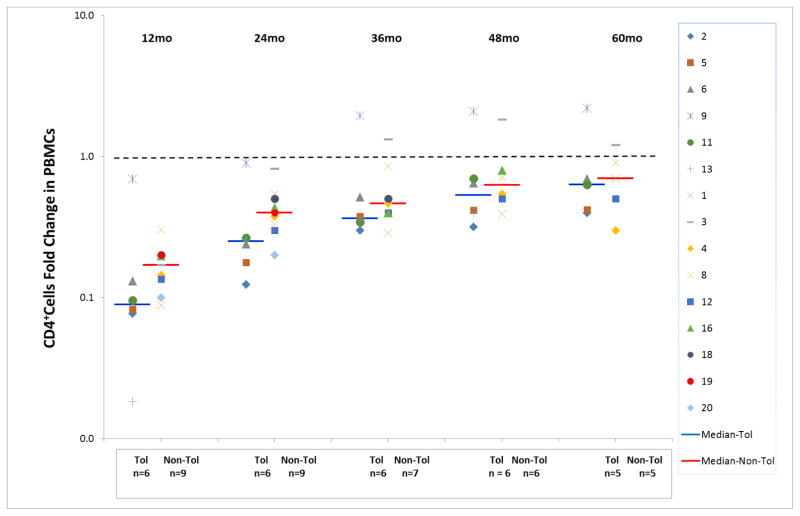
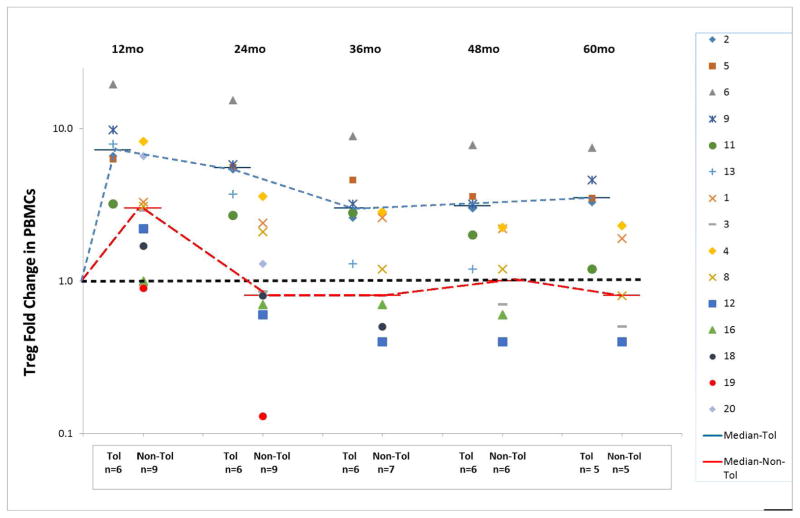
In our previous report we could not equate sequential PBMC immunophenotyping of T cells, B cells or NK cells with either Tol or non-Tol (10). However, with the additional enrollees and longer follow-up sequential measurement of the CD4+CD25+++CD127−FOXP3+ (phenotypic Treg) subset was seen to parallel, and in retrospect predict, patients biopsy designated as Tol versus non-Tol. As indicated in Figure 4, CD4+ T cells were all markedly reduced up to 5 years postoperatively. However, a difference became evident between Tol vs. non-Tol, with significantly greater and prolonged elevation in Tol Treg PBMC phenotypes sequentially studied from preoperative baseline measurements (Figure 5). This in retrospect actually was associated with the Banff 1A pathology vs quiescence in the protocol biopsies, sometimes 2 to 3 years before it became evident. Although the figure only connotes yearly values, these assays were performed monthly. (See Table S1, in which actual absolute numbers of Tregs in whole blood are detailed, rather than fold change from pre-operative values, the latter normalized to 1 in the Figures.) Other subsets (CD20+, CD14+, CD56+) showed no differences between Tol and non-Tol (not shown).
Figure 4. Marked depression in CD4+ T cell whole blood immunophenotyping brought about by the protocol.
Note that this even persisted in several patients at 60 months post-transplant, but there were no significant differences between the Tol and non-Tol groups. Absolute numbers of CD4+ cells/cu mm of whole blood were expressed as a fold change from pre-operative baseline (log scale). Preoperative values were normalized to 1.0.
Figure 5. Increasing differences between the Tol and non-Tol groups in the fold change of the Treg phenotype percentages compared with preoperative values as time elapsed after transplantation (months).
Note that as early as one year post-transplant, while still on equivalent doses of IS, differences were established between the Tol and non-Tol groups, and that even at 5 years (60 months) postoperatively while the Tol group was IS-free for 3 years and the non-Tol group remained on IS, these differences persisted, with significantly higher percentages of CD4+CD25+++CD127−FOXP3+ Treg phenotypes in those that remained tolerant (p≤0.001). Preoperative values were normalized to 1.0. However, Patients #1 and #2 did not yet have this assay standardized preoperatively early in the study. Therefore, preoperative values of these two were calculated from means of the other 18 (Table S1) All symbols represent individual patients (patient #8 is singled out).
It might be questioned if a predisposition to allow IS withdrawal, i.e. cause the induction of Tol vs. non-Tol, would have occurred even in the absence of DHSC infusions. However, the DHSC cell dose could be correlated with the magnitude of the Treg fold change from preoperatively despite the overall small numbers involved (6 vs. 9 respectfully). If <3x10⁶ CD34+cells/kg were infused, Treg fold changes at 1 and 2 years postoperatively were markedly reduced, with no Tol subjects included (not shown). This was despite IS dosing being equivalent in each subject.
Molecular Profiling for HLA-Identical Tolerance
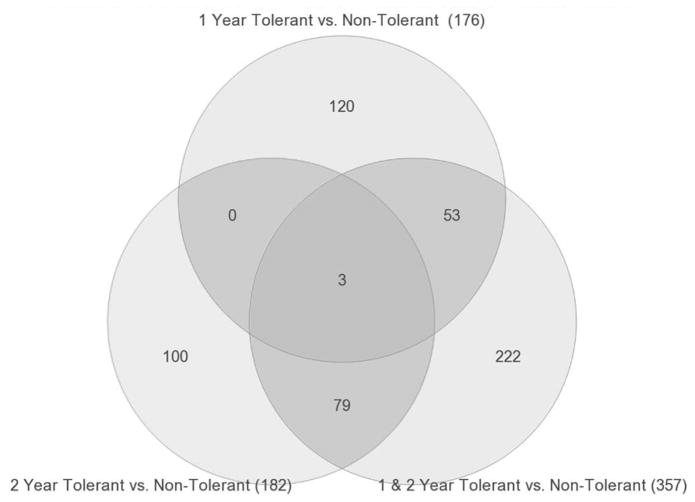
Global gene expression profiling was performed on PBMC samples collected yearly for >5 years from the 6 Tol and 9 non-Tol patients. Pairwise ANOVAs (p<0.005) were done in Partek Genomics Suite to identify differentially expressed genes after transplantation. Comparing Tol vs non-Tol subjects at 1 and 2 years, there were 176 and 182 differentially expressed genes, respectively (Figure 6 and Tables S2 and S3). Importantly, only 3 genes were shared revealing the evolving differential response to changing immunosuppression and development of stable tolerance in the first two years post-transplant, i.e. consistent with the conclusion that these gene expression changes reflect the changes in therapy with time. To better understand the evolution to Tol, we analyzed differential gene expression in three groups based on the protocol’s timelines for IS withdrawal, first for Tol vs non-Tol by combining the data from Years 1 and 2. At 12 months post-op all patients were off TAC and on SRL/MPA and at 24 months they were off SRL (Figure 1). By analyzing the data from both years combined we could exclude gene changes driven by time and immunosuppression changes to focus only on the differences between Tol vs. non-Tol in this early post-transplant period when the tolerance state is evolving. We also profiled Tol patients during the early stages of complete IS withdrawal in Years 3 and 4 post-transplant vs non-Tol patients remaining on full IS. Finally, we profiled the same patients at the late stage (Years 5 and 6 post-transplant) when Tol patents were still completely off IS and non-Tol patients still on full IS.
Figure 6. Venn diagram showing shared genes in PBMC when combining Years 1 and 2 post-transplant, data.
Combining the data for Tol vs non-Tol revealed 357 differentially expressed genes, 56 shared with Year 1 profiles and 82 shared with Year 2. These 357 represent genes unique to Tol subjects at both time points and potentially predictive of those patients that can be successfully weaned off IS to tolerance.
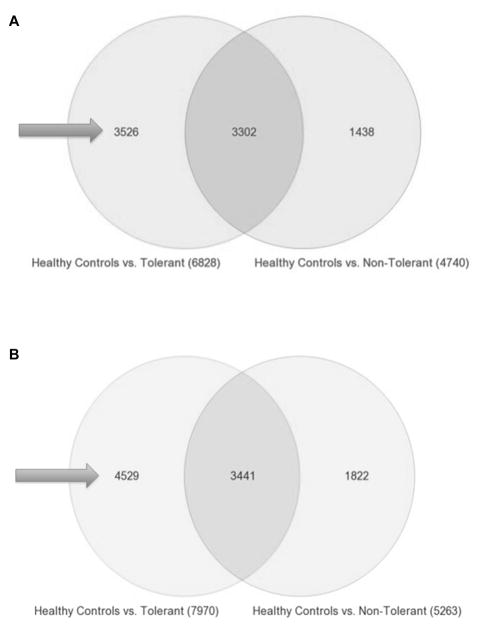
Combining Years 1 and 2 post-transplant, Tol vs non-Tol revealed 357 differentially expressed genes (p<0.005). These 357 should not be confused with simply the gene sum from the 1 and 2 Year analyses. However, of these 357 genes 56 are shared with Year 1 profiles and 82 shared with Year 2 (Figure 6). These 357 represent genes (Table S4) unique to Tol subjects at both time points and raised the question of whether they could be predictive of patients successfully IS withdrawn. However, because Tol patients were no longer on IS by Year 3, we needed a different analysis approach for time points beyond 3 years. Thus, from Year 3 forward, we compared Tol vs non-Tol separately to gene expression profiles of PBMC from 20 normal healthy volunteers (50:50 males/females), thereby controlling for the effect of IS in the non-Tol group, i.e. identifying genes uniquely expressed in Tol subjects (Figure 7A and 7B). This strategy, used in our first report (10), is critical to distinguish actual tolerance-associated gene signatures from just differences in gene expression created by comparing non-Tol patients on full IS to Tol patients on no IS, as has been done by others (14). This analysis revealed several thousand genes differentially expressed in healthy controls, both for Tol and non-Tol (Figure 7A and 7B), expected when comparing non-Tol IS recipients to healthy normal controls without IS. In contrast, the large differences seen for Tol patients on no IS compared to normal controls are surprising, belying simple assumptions that Tol patients are the same as healthy controls.
Figure 7.
A. Tol vs non-Tol – Years 3 + 4 Combined. Venn diagram showing the 3526 genes (arrows) that are unique to Tol subjects at years 3 + 4 Years post-transplant. Tol vs non-Tol subjects were compared separately to PBMC collected from 20 normal healthy volunteers to control for the effect of IS in the non-Tol group and to identify genes uniquely expressed in Tol subjects not on IS. B. Tol vs non-Tol – Years 5 + 6 Combined. Venn diagram showing the 4529 genes (arrows) that are unique to Tol subjects at years 5 + 6 Years post-transplant. Tol vs non-Tol subjects were compared separately to PBMC collected from 20 normal healthy volunteers to control for the effect of IS in the non-Tol group and to identify genes uniquely expressed in Tol subjects not on IS.
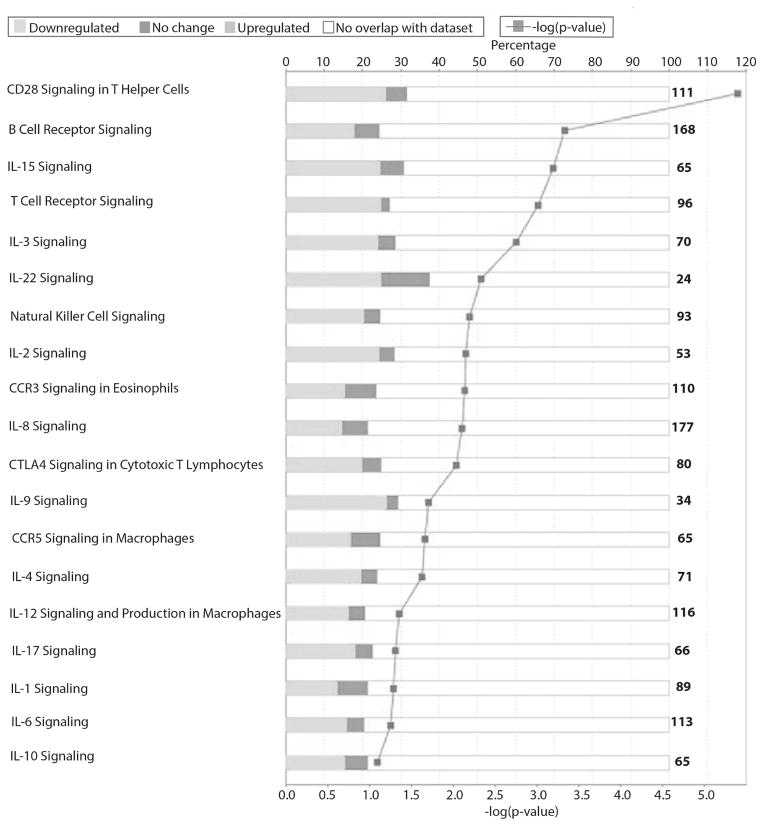
Moreover, there are 3526 and 4529 genes (arrows, Figure 7A and B) unique to Tol subjects at Years 3+4 and again 5+6 post-transplant, respectively (Table S5 and Table S6), with 979 genes shared at both times (Figure S1) all differentially regulated in the same direction. Note that these genes are not differentially expressed because of IS. They were excluded by our analysis design with healthy controls as a normalizing data set for the effect of IS. Tol-associated genes map to multiple immune/inflammatory pathways including CD28, iCOS, CTLA4, IL1, IL2, IL6, IL12, IL17, and CCR5/RANTES signaling as shown in Figure 8 and listed in Tables S6 and S7. Most striking was that these pathways were all significantly down regulated in Tol patients, even when compared to normal healthy controls. Importantly, this significant down-regulation of immune pathways in Tol patients was what we previously published for these patients at Year 3 (10), reflecting a sustained suppression of the immune/inflammatory milieu of the Tol patients despite no IS for several years.
Figure 8. Mapping of the 4529 genes in PBMC at years 5 + 6 post-transplant to show the differential regulation of multiple critical immune/inflammatory pathways.
The shading of the bars clearly represent the specific suppression of these pathways, showing predominantly down-regulated genes (light grey) when compared to the up-regulated genes (dark grey). The lower X-axis represents the −log of the p-value, and the upper X-axis shows the percentage of genes in each pathway.
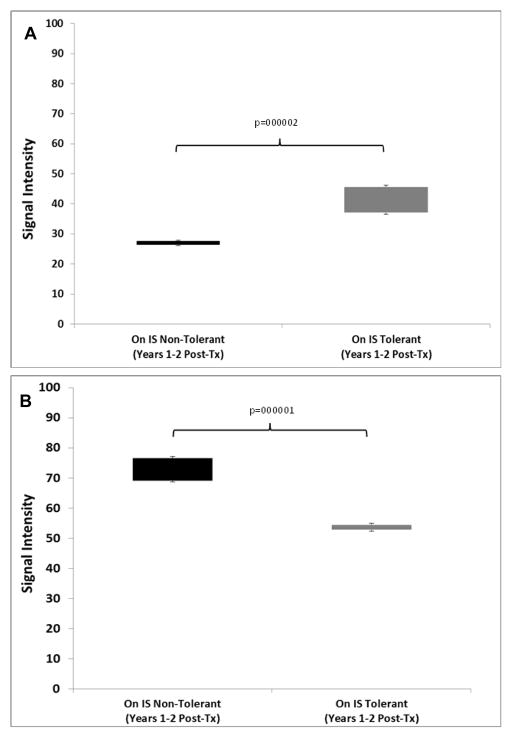
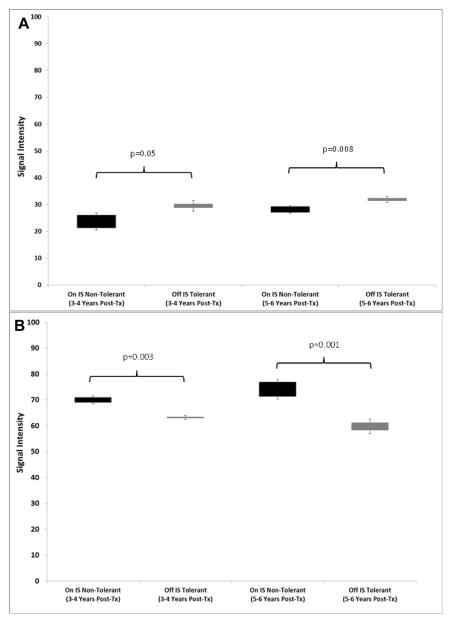
We next tested if the original signature of 357 genes (Tol vs non-Tol, Years 1+2) could be converted into molecular scores and predict tolerance after IS weaning after Year 2, thereby representing discovery of a candidate Tol gene signature to be used while still on full IS. To do this we calculated two separate scores based on the signal intensities of the up- and down-regulated genes between Tol and non-Tol patients. This allowed us to map both classes of gene changes (up- vs down-regulation) to functional immunological pathways in the context of mechanisms creating and maintaining tolerance. As shown in Figure 9A and B, even when both groups were on full IS (Years 1+2) there were highly significant differences in both scores between Tol vs non-Tol patients. However, the first true test for this as a predictive signature would be if it was still able to differentiate Tol vs non-Tol after IS was weaned in the Tol group, both “early” (Years 3+4) and “late” (Years 5+6). Indeed, our 357-gene signature tested true for this analysis in both time frames (Figure 10A and B, and Tables S7 and S8).
Figure 9.
A. Molecular Scores in PBMC: Up-regulated Genes. Molecular scores calculated using the 357-gene signature based on raw signal intensities for the up-regulated genes for the Tol (grey bar) and the non-Tol group (black bar) while they were on full IS (Years 1+2). P-values were computed using a two-tailed Student’s t-test assuming equal variance. B. Molecular Scores: Down-regulated Genes. Molecular scores calculated using the 357-gene signature based on raw signal intensities for the down-regulated genes for the Tol (grey bar) and the non-Tol group (black bar) while they were on full IS (Years 1+2). ). P-values were computed using a two-tailed Student’s t-test assuming equal variance.
Figure 10.
A. Up-regulated Scores in PBMC. Molecular scores calculated using the 357-gene signature based on raw signal intensiities for the up-regulated genes for the Tol group (grey bar) when off IS (Years 3–4 and Years 5–6) and the non-Tol group (black bar) while on full IS (Years 3–4 and Years 5–6). ). P-values were computed using a two-tailed Student’s t-test assuming equal variance. B. Down-regulated Scores in PBMC. Molecular scores calculated using the 357-gene signature based on raw signal intensiities for the down-regulated genes for the Tol group (grey bar) when off IS (Years 3–4 and Years 5–6) and the non-Tol group (black bar) while on full IS (Years 3–4 and Years 5–6). ). P-values were computed using a two-tailed Student’s t-test assuming equal variance.
Though the reproducibility of our 357-gene signature in Years 3+4 and Years 5+6 is one validation strategy, a true validation is to test our signature with data from an external cohort, i.e. for “spontaneous operational tolerance” published by Newell et al. for the Immune Tolerance Network comprising 46 patients (raw.CEL data downloaded from the NCBI GEO repository) (15) defined as having stable graft function despite receiving no IS for at least 1 year. The rest were patients with stable, good graft function on full IS (n = 27). Both data sets were profiled on the cartridge same versions of the Hu133PM microarrays used in our studies. The Nearest Centroid prediction tool (Partek Genomics Suite) was used with our 357-gene classifier to predict the Tol vs. non-Tol subjects in the ITN cohort. There was an overall predictive accuracy of 80%, sensitivity 72%, specificity 87%; positive and negative predictive accuracies of 84% and 77%, respectively, and an Area Under the Curve of 0.807.
Finally, we also mapped the up- vs down-regulated genes in this predictive 357-gene signature to specific immune pathways to clarify mechanisms of our non-chimeric tolerance. Nineteen well established inflammatory genes were identified mapping to PI3K, Notch, Ephrin and MAPK signaling (Table S8). Importantly, metabolic pathways were also perturbed including glutamine, fatty acid and glycerol biosynthesis, consistent with emerging data on “immuno-metabolism”.
We also performed gene expression profiling on biopsy samples collected at five different time points (12 months, 18 months, 24 months, 36 months and 60 months) from the first 8 (4 Tol, 4 non-Tol) patients in the study. Similar to the PBMC, combining Years 1 and 2 post-transplant, Tol vs non-Tol revealed 416 differentially expressed genes (p<0.005), 64 shared with Year 1 profiles, 28 shared with Year 1.5 profiles and 72 shared with Year 2. These 416 represent genes (Table S9) unique to Tol subjects at all three points and raised the question of whether they could be predictive of patients successfully IS withdrawn.
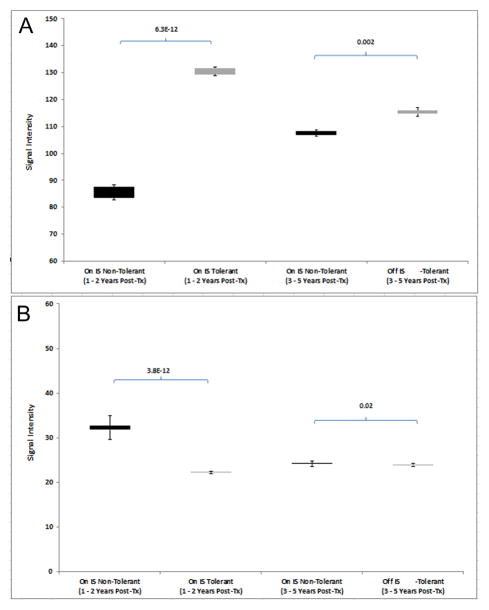
We then tested if the signals from these 416 genes could be converted into molecular scores and predict tolerance after IS weaning after Year 2, thereby representing discovery of a candidate biopsy Tol gene signature. As with the PBMC, even when both groups were on IS (Years 1+2) there were highly significant differences in both up and downregulated gene molecular scores between Tol vs non-Tol patients. Again, the scores were able to separate the two groups even after IS was weaned in the Tol group, both “early” (Year 3) and “late” (Year 5). (Figure 11A and B).
Figure 11.
A. Up-regulated Scores in Biopsies. Molecular scores calculated using the 416-gene signature based on raw signal intensiities for the up-regulated genes for the Tol group (grey bar) when off IS (Years 3–4 and Years 5–6) and the non-Tol group (black bar) while on full IS (Years 3–4 and Years 5–6). ). P-values were computed using a two-tailed Student’s t-test assuming equal variance. B. Down-regulated Scores in Biopsies. Molecular scores calculated using the 416-gene signature based on raw signal intensiities for the down-regulated genes for the Tol group (grey bar) when off IS (Years 3–4 and Years 5–6) and the non-Tol group (black bar) while on full IS (Years 3–4 and Years 5–6). ). P-values were computed using a two-tailed Student’s t-test assuming equal variance.
The Nearest Centroid prediction tool using the 416-gene signature predicted the Year 3 and Year 5 Tol and non-Tol subjects with 100% accuracy. Finally, we also mapped the up- vs down-regulated genes in this predictive 416-gene signature to specific immune pathways to clarify mechanisms of our non-chimeric tolerance in the tissue. Significant Pathways included Integrin, FAK, VEGF, ILK, mTOR and IL-8 Signaling. Seventeen immune/inflammatory genes were identified of which 11 were downregulated in the Tol subjects. Importantly, several metabolic pathways were perturbed including Stearate, Acetyl-CoA, Triacylglycerol, Choline, Urate, Alanine and Tyrosine Biosynthesis.
Cellular Immune Responsiveness Assays
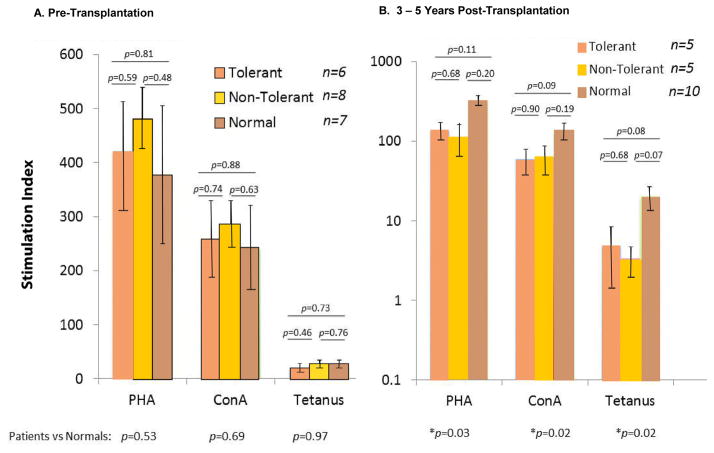
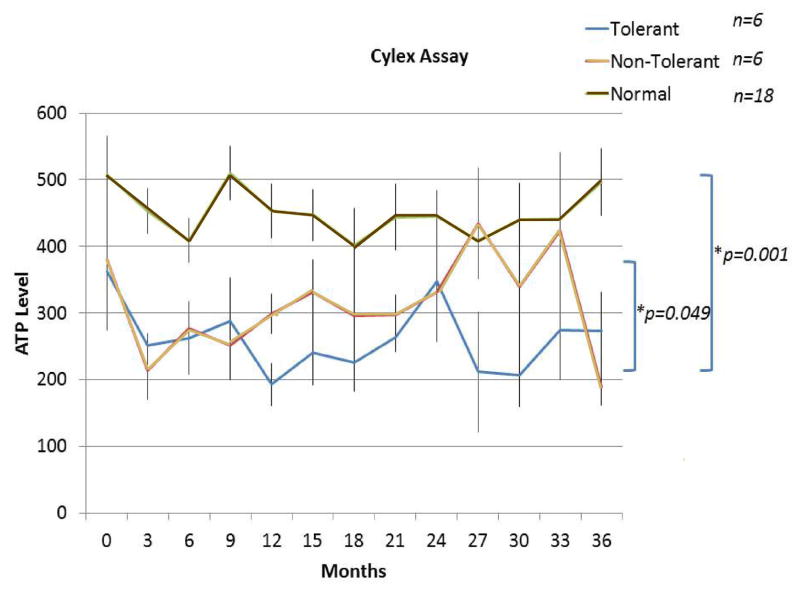
Because of the genomic findings differentiating Tol from non-Tol with dampened inflammatory pathways in the Tol group and persistently higher percentages of Tregs we asked whether this might be reflected in vitro using mitogens and a recall antigen (tetanus). Figure 12A and B indicate that although IS had been withdrawn from the Tol group for longer than 1 year and the non-Tol group having resumed IS for at least that time, there was no difference in reactivity between them, both being significantly lower than normal laboratory volunteers. Parallel observations were made in sequential Immunoassay/Cylex® testing (Figure 13).
Figure 12. PBMC proliferation response to mitogens and a recall antigen.
A. Note that pre-operatively there were no differences in reactivity between the Tol and non-Tol groups (with ESRD) versus normal laboratory volunteers (Patient #8 was still considered tolerant since the assays were performed between 3 and 5 years post-operatively (see Table 1 and Figure 3B). The pre-operative samples analyzed included patient #2, #5, #6, #9, #11, and #13 in the Tol group. The non-Tol group included #1, #3, #4, #8, #10, #12, #16, and #18. B. Note that there was no difference between the Tol and non-Tol groups post-operatively with each group having significantly lower responses than normal laboratory volunteers (*, p=0.03 and 0.02, at the base of the figure). This was despite all Tol recipients being IS-free for over one year. In the Tol group, the assays were performed on patient #2, #6, #9, #11, and #13. In the non-Tol group the assays were performed on patients #1, #3, #4, #8, and #12, all on IS for greater than one year. A log scale was used to emphasize the tetanus response differences vs normals.
Figure 13. Sequential pre- and post-operative ImmunKnow®/Cylex® (ATP consumption) assays measuring lymphoproliferative responses to the PHA mitogen up to 36 months post-operatively.
The assays were recorded every three months using the same normal laboratory volunteer control for each patient (with few exceptions when unavailable). Note that the Tol and non-Tol groups could actually be distinguished at many time points at which lower responses were seen in the Tol group and statistical significance appeared to be reached between the two curves (p=0.049). Both were markedly lower than when simultaneous assays were performed on the normal controls (p=0.001). Only patients up to 36 months were studied with these assays. Analysis was performed on Tol patients #2, #5, #6, #9, #11, and #13. In the non-Tol group, the assays were performed on patients #1, #3, #4, #8, #12, and #16. Data represent n=6 per group up to 24 months and, n=4 per group at 24 – 36 months. (At the later time periods, reagents became unavailable.)
DISCUSSION
To justify clinical tolerance studies in HLA identical RT, it has been known for over 40 years that IS has been required even in this setting (1). But, were permanent IS to continue significant morbidity and mortality would occur even in the modern era (16). That regulatory T cells might play a predominant role in HLA identity is not surprising, given the receptive environment in which they can act (17, 18). We therefore hypothesized that efforts to enhance their involvement might be solely responsible for inducing prolonged/indefinite unresponsiveness (19), i.e., to only demonstrate transient chimerism with DHSC infusions during the first year postoperatively with DHSC causing immunoregulatory effects described ex vivo and in vitro (5–8, 19–26). Absolute Treg numbers were not emphasized in the results (although they are extensively serially displayed in Table S1. The reason for this is that alemtuzumab caused variable but prolonged decrease in total CD4+ counts (Figure 4). As such, absolute values of Tregs per ul varied in each Al treated recipient. Therefore relative values (fold change from preoperative values) were relied on. Probably because of this, the effects of Al induction and SRL maintenance on serial Treg follow-up clinically to our knowledge has not been described.
Ex vivo functional studies demonstrating Treg effects in HLA identity have been difficult to design because of the paucity of proliferative or cytotoxic T cell responses to minor histocompatibility antigens (4–6, 27–29). What might be suggested by the present report, however, is the possibility that this protocol, currently causing HLA identical ‘metastable’ tolerance, can be amplified to be more effective since thus far no clinical toxicity has occurred, i.e. increased opportunistic infections, etc., despite perhaps being augured by our observations of increased (non-specific) immunophenotypic Tregs and genomic immunoquiescence.
We acknowledge that our predictive immunophenotypic, as well as genomic, tolerance signatures could be considered discovery. Only a single cohort of patients is involved and of the original 20 enrolees, 5 were excluded for reasons described in Table 1 and Figure 2. Thus, a prospective testing of these signatures in a second cohort to validate their utility is needed. Nonetheless, the fact that the genomic signatures held true for both the Years 3+4 and 5+6 in both the PBMC as well as tissue is very reassuring. Moreover, we were able to validate the 357-gene predictive signature on the external ITN cohort. This is true despite differences in the transplant histories of the “spontaneously tolerant” ITN subjects compared to our patients in a prospective, biopsy-managed protocol to induce tolerance with DHSC infusions.
Not described in the results is that the 357 classifier genes were also compaired with 49 genes found as a “footprint” of “spontaneous operational tolerance” in an earlier study (14), with 21/49 (43%) of those genes also differentially expressed in our Tol data set across all time points. Finally, our profiling of tolerance did not show a predominantly B cell signature including a specific analysis of our data using only the ITN 30-gene Tol set as well as the 3 Ig-related B cell genes discovered by them to separate their Tol vs non-Tol subjects (15). However, the present report has the benefit of a prospective study compared to what is now being mostly examined in interval analyses (30).
In summary our data suggest the provocative possibility that the blood gene expression signature of a non-chimeric (‘metastable’) tolerant state may be the same regardless of how it is reached. Whether this could be applied to tolerance induced by (mixed) chimerism will need to be determined. One way to explain the results of down regulation of the mapped pathways in Tol patients is to view our ‘metastable’ tolerance as a state of extreme immune quiescence despite no IS and compared even to the blood profile of normal healthy subjects. Is this a consequence of some state of acquired immunodeficiency after kidney failure and transplantation combined with our initial TAC to SRL immunosuppression and the immunoregulatory DHSC infusions? In our Tol subjects this may reflect an active form of immunoregulation, although speculatively in the longer term clonal deletion might still occur and even be measurable (31).
Supplementary Material
Figure S1. Venn diagram showing the overlap of 3526 and 4529 genes that are unique to Tol subjects at years 3 + 4 and 5 + 6 post-transplant, Differential expression of 979 genes is shared at both times.
Table S1: Sequential immunophenotyping of HLA identical Kidney / DHSC recipients
Table S2: 1 Year Tolerant vs. 1 Year Non-Tolerant (p<0.005)
Table S3: 2 Year Tolerant vs. 2 Year Non-Tolerant (p<0.005)
Table S4: List of 357 differentially expressed genes unique to Tol subjects potentially predictive of those patients that can be successful weaned off IS to tolerance.
Table S5: 3526 Healthy Controls vs Tolerant Unique Genes (1st 2 Years off IS)
Table S6: 4529 Healthy Controls vs Tolerant Unique Genes (2nd 2 Years off IS)
Table S7: Canonical pathways for the 4529 genes unique to the Tol group compared to the non-Tol group at Years 5 + 6
Table S8: Immune/inflammatory molecules among the 357 gene signature of Tolerance.
Table S9: Gene signatures of Tolerance in Renal Biopsies.
Acknowledgments
Grant support:
NIH R01 DK25243, PI – Dr. Miller
NIH U19 AI63603, PI –Dr. Salomon
VA Merit Review 5723.07, PI – Dr. Miller
The authors wish to acknowledge the technical expertise of Li Chen, PhD and Xuemei Huang, MD in performing the immunophenotypic assays and analyses and Susan Benning Bona for her desktop expertise.
Abbreviations
- ACR
Acute cellular rejection
- AI
Alemtuzumab
- CD25+++
CD25+ T cells highly expressive of this epitope (CD25High)
- DHSC
Donor hematopoietic CD34+ stem cells
- HLA
Human leukocyte antigen
- IS
Immunosuppression
- MPA
Mycophenolic acid
- Non-Tol
Non-tolerant
- PBMC
Peripheral blood mononuclear cell
- RT
Renal transplant
- SRL
Sirolimus
- TAC
Tacrolimus
- Tol
Tolerant
- Treg
Regulatory T cell
Footnotes
Disclosure
The authors of this manuscript have conflicts of interest to disclose as described by the American Journal of Transplantation. Doctors Salomon, Kurian and Abecassis have a commercial interest as stockholders and consultants in Transplant Genomics, Inc.
ClinicalTrials.gov Identifier: NCT00619528
Additional Supporting Information may be found in the online version of this article.
References
- 1.Seigler HF, Gunnells JC, Jr, Robinson RR, Ward FE, Amos DB, Rowlands DT, et al. Renal transplantation between HL-A identical donor-recipient pairs. Functional and morphological evaluation. J Clin Invest. 1972;51(12):3200–15. doi: 10.1172/JCI107147. [DOI] [PMC free article] [PubMed] [Google Scholar]
- 2.Gerrits JH, van de Wetering J, Weimar W, van Besouw NM. T-cell reactivity during tapering of immunosuppression to low-dose monotherapy prednisolone in HLA-identical living-related renal transplant recipients. Transplantation. 2009;87(6):907–14. doi: 10.1097/TP.0b013e31819b3df2. [DOI] [PubMed] [Google Scholar]
- 3.van de Wetering J, Gerrits JH, van Besouw NM, Ijzermans JNM, Weimar W. Successful tapering of immunosuppression to low-dose monotherapy steroids after living-related human leukocyte antigen-identical renal transplantation. Transplantation. 2009;87(5):740–4. doi: 10.1097/TP.0b013e31819634eb. [DOI] [PubMed] [Google Scholar]
- 4.Spitzer TR, Delmonico F, Tolkoff-Rubin N, McAfee S, Sackstein R, Saidman S, et al. Combined histocompatibility leukocyte antigen-matched donor bone marrow and renal transplantation for multiple myeloma with end stage renal disease: the induction of allograft tolerance through mixed lymphohematopoietic chimerism. Transplantation. 1999;68(4):480–4. doi: 10.1097/00007890-199908270-00006. [DOI] [PubMed] [Google Scholar]
- 5.Scandling JD, Busque S, Dejbakhsh-Jones S, Benike C, Millan MT, Shizuru JA, et al. Tolerance and chimerism after renal and hematopoietic-cell transplantation. N Engl J Med. 2008;358(4):362–8. doi: 10.1056/NEJMoa074191. [DOI] [PubMed] [Google Scholar]
- 6.Scandling JD, Busque S, Dejbakhsh-Jones S, Benike C, Sarwal M, Millan MT, et al. Tolerance and Withdrawal of Immunosuppressive Drugs in Patients Given Kidney and Hematopoietic Cell Transplants. Am J Transplant. 2012;12(5):1133–45. doi: 10.1111/j.1600-6143.2012.03992.x. [DOI] [PMC free article] [PubMed] [Google Scholar]
- 7.Scandling JD, Busque S, Shizuru JA, Lowsky R, Hoppe R, Dejbakhsh-Jones S, et al. Chimerism, Graft Survival, and Withdrawal of Immunosuppressive Drugs in HLA Matched and Mismatched Patients After Living Donor Kidney and Hematopoietic Cell Transplantation. Am J Transplant. 2015;15(3):695–704. doi: 10.1111/ajt.13091. [DOI] [PubMed] [Google Scholar]
- 8.Kawai T, Cosimi AB, Spitzer TR, Tolkoff-Rubin N, Suthanthiran M, Saidman SL, et al. HLA-mismatched renal transplantation without maintenance immunosuppression. N Engl J Med. 2008;358(4):353–61. doi: 10.1056/NEJMoa071074. [DOI] [PMC free article] [PubMed] [Google Scholar]
- 9.Leventhal J, Abecassis M, Miller J, Gallon L, Ravindra K, Tollerud DJ, et al. Chimerism and Tolerance Without GVHD or Engraftment Syndrome in HLA-Mismatched Combined Kidney and Hematopoietic Stem Cell Transplantation. Sci Transl Med. 2012;4(124):124ra28. doi: 10.1126/scitranslmed.3003509. [DOI] [PMC free article] [PubMed] [Google Scholar]
- 10.Leventhal JR, Mathew JM, Salomon DR, Kurian SM, Suthanthiran M, Tambur A, et al. Genomic biomarkers correlate with HLA-identical renal transplant tolerance. J Am Soc Nephrol. 2013;24(9):1376–85. doi: 10.1681/ASN.2013010068. [DOI] [PMC free article] [PubMed] [Google Scholar]
- 11.Leventhal J, Abecassis M, Miller J, Gallon L, Tollerud D, Elliott MJ, et al. Tolerance Induction in HLA Disparate Living Donor Kidney Transplantation by Donor Stem Cell Infusion: Durable Chimerism Predicts Outcome. Transplantation. 2013;95(1):169–76. doi: 10.1097/TP.0b013e3182782fc1. [DOI] [PMC free article] [PubMed] [Google Scholar]
- 12.Shinoda K, Akiyoshi T, Chase CM, Farkash EA, Ndishabandi DK, Raczek CM, et al. Depletion of Foxp3+ T Cells Abrogates Tolerance of Skin and Heart Allografts in Murine Mixed Chimeras Without the Loss of Mixed Chimerism. Am J Transplant. 2014;14(10):2263–74. doi: 10.1111/ajt.12851. [DOI] [PMC free article] [PubMed] [Google Scholar]
- 13.Cobbold SP, Nolan KF, Graca L, Castejon R, Le Moine A, Frewin M, et al. Regulatory T cells and dendritic cells in transplantation tolerance: molecular markers and mechanisms. Immunol Rev. 2003;196:109–24. doi: 10.1046/j.1600-065x.2003.00078.x. [DOI] [PubMed] [Google Scholar]
- 14.Brouard S, Mansfield E, Braud C, Li L, Giral M, Hsieh S-c, et al. Identification of a peripheral blood transcriptional biomarker panel associated with operational renal allograft tolerance. Proc Natl Acad Sci U S A. 2007;104(39):15448–53. doi: 10.1073/pnas.0705834104. [DOI] [PMC free article] [PubMed] [Google Scholar]
- 15.Newell KA, Asare A, Kirk AD, Gisler TD, Bourcier K, Suthanthiran M, et al. Identification of a B cell signature associated with renal transplant tolerance in humans. J Clin Invest. 2010;120(6):1836–47. doi: 10.1172/JCI39933. [DOI] [PMC free article] [PubMed] [Google Scholar]
- 16.Verghese PS, Dunn TB, Chinnakotla S, Gillingham KJ, Matas AJ, Mauer MS. Calcineurin inhibitors in HLA-identical living related donor kidney transplantation. Nephrology Dialysis Transplantation. 2014;29(1):209–18. doi: 10.1093/ndt/gft447. [DOI] [PMC free article] [PubMed] [Google Scholar]
- 17.Sakaguchi S, Sakaguchi N, Asano M, Itoh M, Toda M. Immunologic self-tolerance maintained by activated T cells expressing IL-2 receptor alpha-chains (CD25). Breakdown of a single mechanism of self-tolerance causes various autoimmune diseases. J Immunol. 1995;155(3):1151–64. [PubMed] [Google Scholar]
- 18.Wolf D, Wolf AM, Fong D, Rumpold H, Strasak A, Clausen J, et al. Regulatory T-cells in the graft and the risk of acute graft-versus-host disease after allogeneic stem cell transplantation. Transplantation. 2007;83(8):1107–13. doi: 10.1097/01.tp.0000260140.04815.77. [DOI] [PubMed] [Google Scholar]
- 19.Mathew JM, Ciancio G, Burke GW, Garcia-Morales RO, Rosen A, Wang E, et al. Immune “tolerance profiles” in donor bone marrow infused kidney transplant patients using multiple ex vivo functional assays. Hum Immunol. 2010;71(6):566–76. doi: 10.1016/j.humimm.2010.02.008. [DOI] [PMC free article] [PubMed] [Google Scholar]
- 20.Shaffer J, Villard J, Means TK, Alexander S, Dombkowski D, Dey BR, et al. Regulatory T-cell recovery in recipients of haploidentical nonmyeloablative hematopoietic cell transplantation with a humanized anti-CD2 mAb, MEDI-507, with or without fludarabine. Experimental Hematology. 2007;35(7):1140–52. doi: 10.1016/j.exphem.2007.03.018. [DOI] [PMC free article] [PubMed] [Google Scholar]
- 21.LoCascio SA, Morokata T, Chittenden M, Preffer FI, Dombkowski DM, Andreola G, et al. Mixed chimerism, lymphocyte recovery, and evidence for early donor-specific unresponsiveness in patients receiving combined kidney and bone marrow transplantation to induce tolerance. Transplantation. 2010;90(12):1607–15. doi: 10.1097/TP.0b013e3181ffbaff. [DOI] [PMC free article] [PubMed] [Google Scholar]
- 22.Mathew JM, Garcia-Morales R, Fuller L, Rosen A, Ciancio G, Burke GW, et al. Donor bone marrow-derived chimeric cells present in renal transplant recipients infused with donor marrow. I. Potent regulators of recipient antidonor immune responses. Transplantation. 2000;70(12):1675–82. doi: 10.1097/00007890-200012270-00003. [DOI] [PubMed] [Google Scholar]
- 23.Cirocco RE, Carreno MR, Mathew JM, Garcia-Morales RO, Fuller L, Esquenazi V, et al. FoxP3 mRNA transcripts and regulatory cells in renal transplant recipients 10 years after donor marrow infusion. Transplantation. 2007;83(12):1611–9. doi: 10.1097/01.tp.0000266908.37446.02. [DOI] [PubMed] [Google Scholar]
- 24.Mathew JM, Carreno M, Zucker K, Fuller L, Kenyon N, Esquenazi V, et al. Cellular immune responses of human cadaver donor bone marrow cells and their susceptibility to commonly used immunosuppressive drugs in transplantation. Transplantation. 1998;65(7):947–55. doi: 10.1097/00007890-199804150-00015. [DOI] [PubMed] [Google Scholar]
- 25.Mathew JM, Fuller L, Carreno M, Garcia-Morales R, Burke GW, 3rd, Ricordi C, et al. Involvement of multiple subpopulations of human bone marrow cells in the regulation of allogeneic cellular immune responses. Transplantation. 2000;70(12):1752–60. doi: 10.1097/00007890-200012270-00015. [DOI] [PubMed] [Google Scholar]
- 26.Mathew JM, Garcia-Morales RO, Carreno M, Jin Y, Fuller L, Blomberg B, et al. Immune responses and their regulation by donor bone marrow cells in clinical organ transplantation. Transpl Immunol. 2003;11(3–4):307–21. doi: 10.1016/S0966-3274(03)00056-X. [DOI] [PubMed] [Google Scholar]
- 27.Dickinson AM, Wang X-N, Sviland L, Vyth-Dreese FA, Jackson GH, Schumacher TNM, et al. In situ dissection of the graft-versus-host activities of cytotoxic T cells specific for minor histocompatibility antigens. Nat Med. 2002;8(4):410–4. doi: 10.1038/nm0402-410. [DOI] [PubMed] [Google Scholar]
- 28.Burlingham WJ, Goulmy E. Human CD8+ T-regulatory cells with low-avidity T-cell receptor specific for minor histocompatibility antigens. Hum Immunol. 2008;69(11):728–31. doi: 10.1016/j.humimm.2008.08.289. [DOI] [PMC free article] [PubMed] [Google Scholar]
- 29.Levitsky J, Miller J, Leventhal J, Huang X, Flaa C, Wang E, et al. The human “Treg MLR”: immune monitoring for FOXP3+ T regulatory cell generation. Transplantation. 2009;88(11):1303–11. doi: 10.1097/TP.0b013e3181bbee98. [DOI] [PMC free article] [PubMed] [Google Scholar]
- 30.Pidala J, Bloom GC, Eschrich S, Sarwal M, Enkemann S, Betts BC, et al. Tolerance Associated Gene Expression following Allogeneic Hematopoietic Cell Transplantation. PLoS One. 2015;10(3):e0117001. doi: 10.1371/journal.pone.0117001. [DOI] [PMC free article] [PubMed] [Google Scholar]
- 31.Emerson RO, Mathew JM, Konieczna IM, Robins HS, Leventhal JR. Defining the Alloreactive T Cell Repertoire Using High-Throughput Sequencing of Mixed Lymphocyte Reaction Culture. PLoS One. 2014;9(11):e111943. doi: 10.1371/journal.pone.0111943. [DOI] [PMC free article] [PubMed] [Google Scholar]
Associated Data
This section collects any data citations, data availability statements, or supplementary materials included in this article.
Supplementary Materials
Figure S1. Venn diagram showing the overlap of 3526 and 4529 genes that are unique to Tol subjects at years 3 + 4 and 5 + 6 post-transplant, Differential expression of 979 genes is shared at both times.
Table S1: Sequential immunophenotyping of HLA identical Kidney / DHSC recipients
Table S2: 1 Year Tolerant vs. 1 Year Non-Tolerant (p<0.005)
Table S3: 2 Year Tolerant vs. 2 Year Non-Tolerant (p<0.005)
Table S4: List of 357 differentially expressed genes unique to Tol subjects potentially predictive of those patients that can be successful weaned off IS to tolerance.
Table S5: 3526 Healthy Controls vs Tolerant Unique Genes (1st 2 Years off IS)
Table S6: 4529 Healthy Controls vs Tolerant Unique Genes (2nd 2 Years off IS)
Table S7: Canonical pathways for the 4529 genes unique to the Tol group compared to the non-Tol group at Years 5 + 6
Table S8: Immune/inflammatory molecules among the 357 gene signature of Tolerance.
Table S9: Gene signatures of Tolerance in Renal Biopsies.


