

Abstract
Guanine-rich oligonucleotides can form a unique G-quadruplex (GQ) structure with stacking units of four guanine bases organized in a plane through Hoogsteen bonding. GQ structures have been detected in vivo and shown to exert their roles in maintaining genome integrity and regulating gene expression. Understanding GQ conformation is important for understanding its inherent biological role and for devising strategies to control and manipulate functions based on targeting GQ. Although a number of biophysical methods have been used to investigate structure and dynamics of GQs, our understanding is far from complete. As such, this work explores the use of the site-directed spin labeling technique, complemented by molecular dynamics simulations, for investigating GQ conformations. A nucleotide-independent nitroxide label (R5), which has been previously applied for probing conformations of noncoding RNA and DNA duplexes, is attached to multiple sites in a 22-nucleotide DNA strand derived from the human telomeric sequence (hTel-22) that is known to form GQ. The R5 labels are shown to minimally impact GQ folding, and inter-R5 distances measured using double electron–electron resonance spectroscopy are shown to adequately distinguish the different topological conformations of hTel-22 and report variations in their occupancies in response to changes of the environment variables such as salt, crowding agent, and small molecule ligand. The work demonstrates that the R5 label is able to probe GQ conformation and establishes the base for using R5 to study more complex sequences, such as those that may potentially form multimeric GQs in long telomeric repeats.
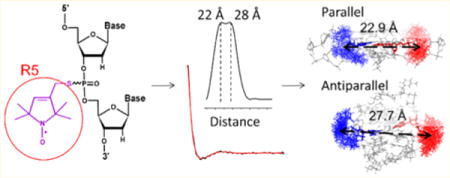
Graphical abstract
Guanine-rich oligonucleotides, either DNA or RNA, can form a unique structure, called G-quadruplex (GQ), which consists of at least two stacked G-tetrads formed by four guanine bases organized in a plane and interacting via Hoogsteen bonding.1–3 GQ formation has been detected in vivo,4–7 and it has been shown that GQs exert a role in maintaining genome integrity and regulating gene expression. GQ conformations are distinct from duplexes,8–12 which not only underlie their biological functions but also present opportunities for the use of small molecule ligands to manipulate biological functions.12–15 With their unique nanoscale geometry, biocompatibility, biodegradability, and molecular recognition capacity, GQs are also promising candidates for the construction of novel functional nanomaterials.16,17
Understanding GQ conformation is of great importance for understanding its inherent biological roles and for devising strategies to control and manipulate biological functions based on targeting GQ. The structure and dynamics of GQs, particularly those formed from sequences of fewer than 30 nucleotides (nt), have been extensively studied using a variety of experimental and computational approaches, including X-ray crystallography,18 nuclear magnetic resonance (NMR),19–23 circular dichroism (CD),24–27 Förster resonance energy transfer (FRET),28,29 laser tweezer,30 atomic force microscopy,31 molecular dynamics (MD) simulations,32,33 and electronic structure calculations.34,35 While these studies have revealed a wealth of information about GQs, for example, their high degree of structural morphology and versatility in ligand recognition, our understanding of GQ is far from complete. Thus, complementary methods that provide structural and dynamic information about GQs, particularly on long sequences and under physiological conditions, are of interest.
Here, we explore the use of the site-directed spin labeling (SDSL) method to investigate GQ conformations. SDSL monitors site-specifically attached stable nitroxide radicals using electron paramagnetic resonance (EPR) spectroscopy and provides structural (e.g., distance constraints) and dynamic (e.g., motions at the labeling sites) information about the parent molecule.36,37 SDSL can be applied to study high-molecular weight systems under physiological conditions and avoids a number of fundamental issues faced by crystallography (e.g., crystalline sample preparation, interference from lattice packing) and NMR (e.g., limitation on molecule size). Nitroxides are smaller than most fluorophores and are more intimately connected to the parent molecule. As a result, distances between a pair of nitroxides can be measured more precisely and can be explicitly correlated to the native structure.37,38
SDSL studies of GQs using a nitroxide label attached to selected thymine bases in loops have been reported.39,40 Encouraged by previous SDSL work, we report here the use of a nucleotide-independent nitroxide [designated as R5 (Figure 1A)] for probing GQ conformations. R5 belongs to a family of labels that can be efficiently attached at any desired site within a nucleic acid sequence,37,38,41 thus offering an effective means of scanning a target sequence, which has been shown to be highly advantageous.42,43 In our prior work, we have established and validated a R5 tool kit for mapping global structures of RNAs and DNAs,41 which consists of (i) inter-R5 distances measured via double electron–electron resonance (DEER) spectroscopy and (ii) a NASNOX program that efficiently computes inter-R5 distances on given nucleic acid structures. We also reported the use of the R5 tool kit, complemented by Monte Carlo simulations, to investigate sequence-dependent DNA duplex shape.44
Figure 1.
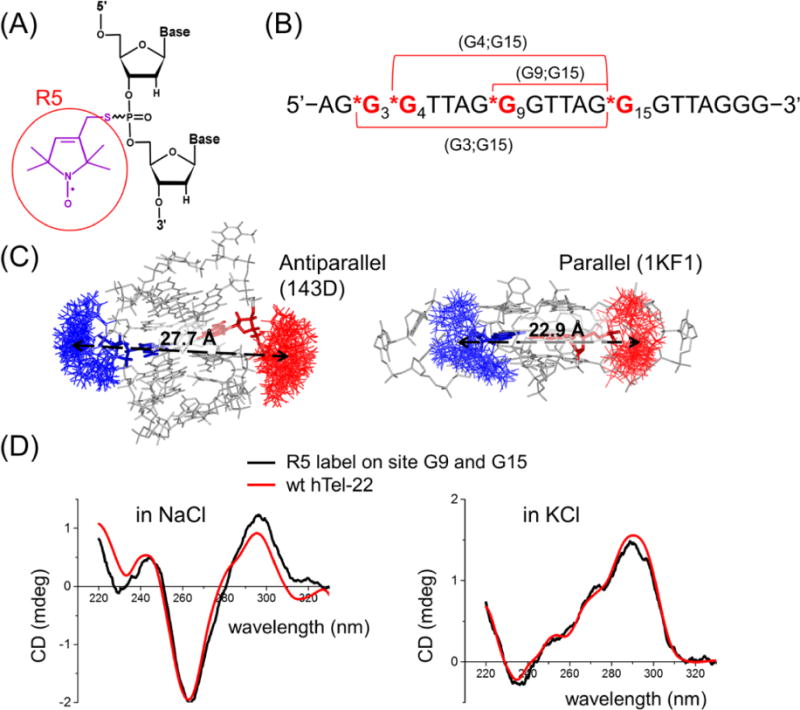
SDSL studies of hTel-22. (A) R5 label. (B) Sequence of hTel-22. The spin labeling sites are colored red and indicated by asterisks. (C) NASNOX-predicted allowable R5 rotamers at G9 (red) and G15 (blue) for the antiparallel (PDB entry 143D left) and parallel (PDB entry 1KF1, right) structures. (D) CD spectra of the unmodified hTel-22 (“wt hTel-22”, red) and doubly labeled (G9;G15) sample (black) measured in NaCl (left) and KCl (right). Each spectrum of R5-labeled DNA shown was an average of five scans without smoothing. The “wt hTel-22” spectra were previously reported in ref 53.
While previous work with this approach has focused primarily on duplex conformations, here we examine the ability of the R5 tool kit to study quadruplexes. For this purpose, we used a well-characterized 22-nt DNA sequence denoted hTel-22 [5′-AGGG(TTAGGG)3-3′ (Figure 1B)]. hTel-22 is derived from the human telomeric sequence, and it has been shown to form GQs with a variety of topological conformations,8 including an antiparallel “basket” conformation [Protein Data Bank (PDB) entry 143D],19 a propeller-shaped all-parallel conformation (PDB entries 1KF1 and 1K8P),18 and possibly “3+1” hybrid conformations,27,45 depending on the particular DNA sequence, counterion identity (i.e., K+ vs Na+), solvent conditions (e.g., presence of crowding agents), and small molecule ligands. Using R5 labels attached at various locations at the G nucleotides, we show that the measured inter-R5 distances reveal the presence of both parallel and antiparallel conformations in hTel-22 under the EPR experimental conditions and can report variations in their occupancies in response to changes in environmental variables such as salt, crowding agent, and the presence of a PtII complex. This work establishes the use of the R5 tool kit to probe the conformations of GQs and to identify factors that should be taken into account in spin labeling studies. With the ability to attach R5 to long DNA sequences that might form multimeric GQs, the R5 tool kit should provide a means for investigating supramolecular GQ conformations that better mimic those under the physiological setting.
MATERIALS AND METHODS
DNA Spin Labeling
All DNA oligonucleotides, including those with site-specific phosphorothioate modifications, were synthesized by solid-phase chemical synthesis (Integrated DNA Technologies, Coralville, IA) and verified by mass spectrometry by the vendor. The R5 spin-label [1-oxyl-2,2,5,5-tetramethyl-pyrroline (Figure 1A)] was attached to DNA following previously reported protocols.41 Specifically, in each labeling reaction, up to 0.5 mM DNA stands containing the desired phosphorothioate modifications were mixed with a thiol-reactive nitroxide derivative (~100 mM), 3-iodomethyl-1-oxy-2,2,5,5-tetramethylpyrroline, in a solution containing 100 mM MES [2-(N-morpholino)ethanesulfonic acid] (pH 5.8) and 30% (v/v) formamide. After incubation in the dark for 16 h at room temperature, excess nitroxide was removed using anion-exchange high-performance liquid chromatography (HPLC). The labeled DNA was then desalted using reverse-phase HPLC, lyophilized, and recovered by dissolving in deionized water. Concentrations of labeled DNA were determined by the absorbance at 260 nm using an extinction coefficient of 228500 M−1 cm−1. The labeling efficiency of the DNA was estimated by a spin counting procedure46 and was determined to be >90% for samples used in distance measurements. Note that in this work the Rp and Sp phosphorothioate diastereomers present at each attachment site were not separated. Previous studies have validated the use of Rp/Sp mixtures in DEER measurement and established an appropriate method for interpreting the measured inter-nitroxide distances.41,47
EPR Sample Preparation
For EPR samples measured in NaCl, we annealed the hTel-22 DNA by heating it at 95 °C for 5 min, adding the appropriate buffer, cooling the sample to room temperature, and incubating it overnight at 4 °C. The annealing mixture contained approximately 200 μM DNAs, 10 mM Tris (2-amino-2-hydroxymethylpropane-1,3-diol) (pH 7.5), and 100 mM NaCl. Approximately 10 min before DEER measurements, the annealed DNA was mixed with an equal volume of a matching buffer containing 80% (v/v) glycerol, 10 mM Tris (pH 7.5), and 100 mM NaCl, so that the final composition of the sample contained 100 μM DNA, 10 mM Tris (pH 7.5), 100 mM NaCl, and 40% (v/v) glycerol. For experiments with the PtII complex, the matching buffer also contains 600 μM PtII complex, resulting in a 3:1 compound:DNA ratio (300 μM vs 100 μM) in the DEER sample.
For EPR samples measured in KCl, the sample preparation procedure was the same as that described above, except that 100 mM KCl was used instead of NaCl.
All samples used for DEER measurements, other than those used specifically to investigate the effect of long time incubation with glycerol, were immediately flash-frozen in liquid N2 upon addition of the matching buffer containing glycerol. Control experiments showed that varying the time span between adding glycerol-containing buffer and flash-freezing in the range of 1–10 min did not give a measurable difference in DEER results. On the other hand, for samples intended for the examination of the long time effect of glycerol, the annealed DNA was incubated for 24 h in the presence of glycerol at 4 °C, then flash-frozen, and used for DEER measurements.
DEER Measurements of Interspin Distances and Data Analysis
DEER measurements were taken at 78 K on a Bruker ELEXSYS E580 X-band spectrometer equipped with a MD4 resonator. Previously reported acquisition parameters and procedures44 were used with a slight modification (d1 = 200 ns instead of 128 ns).
Interspin distance distributions were computed from the resulting dipolar evolution data using DEERanalysis2013 with Tikhonov regulation.48 All data were processed with a long-pass filter (1.6 nm).48 If needed, the resulting distance distribution profiles from Tikhonov regulation were further dissected with multiple Gaussian functions to calculate the relative populations for each component using a published procedure49–52 (see the Supporting Information for more details). In brief, the Tikhonov-generated distance distribution profile was reconstituted with multiple Gaussians. Then dipolar evolution traces were generated by suppression of one or more Gaussians, and the newly constructed traces were compared to the original trace using a statistical test. The reconstructed trace that was statistically equivalent to the original trace and was composed of the fewest Gaussians was chosen. This procedure also identified the Gaussian(s) that can be omitted on the basis of the statistical test, and these were designated as artifact peaks.52
Circular Dichroism Spectroscopy
Circular dichroism (CD) measurements followed a previously reported procedure.53 The measurements were performed on a Jasco J815 CD spectrometer (Jasco Analytical Instruments, Inc.) at 25 °C. Approximately 3–5 μM annealed DNA in a buffer containing 10 mM Tris (pH 7.5) and 100 mM KCl or NaCl was used for each measurement.
Molecular Dynamics
MD simulations were conducted for 10 μs following previously reported procedures54 using the bsc0χOL4 force field55,56 and are detailed in the Supporting Information. The coordinates for the parallel GQ were taken from quadruplex A of the crystal structure (PDB entry 1KF1).18 The coordinates for the antiparallel basket GQ were taken from model 1 of the NMR structure (PDB entry 143D).19
Computation of Expected Inter-R5 Distances
A previously validated NASNOX program was used to calculate expected inter-R5 distances41,47,57 in GQ structures. The GQ models included the crystal structure from PDB entry 1KF1; the NMR structures from PDB entries 143D, 2HY9, and 2JPZ; and MD trajectories (see above and the Supporting Information). Briefly, with each DNA structure, the program modeled R5 at the target site and then identified the ensemble of sterically allowed R5 conformers using the following search parameters (see ref 41 for details about these parameters): t1 steps, 3; t2 steps, 6; t3 steps, 6; fine search, on; t1 starting values, 180°; t2 starting values, 180°; t3 starting values, 180°; and no additional conformer search criterion. Both the Rp and Sp diastereomers (i.e., R5 attached to the O1P or O2P atom) were included in the search. The expected distance between two specific labeling sites was then calculated by averaging all inter-R5 distances between the two corresponding R5 ensembles. Controls showed that varying the search parameters resulted in <1 Å differences in the expected distances.
RESULTS
Design of SDSL Experiments Using the R5 Tool Kit
As a model system for studying GQ, the hTel-22 sequence is known to be able to fold into a variety of topological conformations depending on the environment.8 The main objective of this work is to evaluate the ability of the R5 tool kit to report and distinguish these different topological configurations. As the R5 label can be easily attached at any nucleotide of the target strand, in studies of GQ sequences such as hTel-22, one can in principle attach labels at either the guanosine nucleotide(s) forming the G-tetrad or other sites residing primarily in the loops. To identify the most effective labeling positions for discriminating the parallel versus antiparallel topology of hTel-22, we first followed strategies developed in our prior work41,42,44,47,58,59 and conducted NASNOX modeling to obtain all possible inter-R5 distances based on atomic-resolution structures of the hTel-22 sequence. The goal was to identify sites that give (i) a large number of allowable R5 conformers (indicating that the label can be adequately accommodated) and (ii) a large difference (e.g., >4 Å) in the inter-R5 distances between different topological folds where R5 labeling presents minimal perturbation.
Analyses were first conducted on the parallel conformation of hTel-22 determined by X-ray crystallography (PDB entry 1KF1, one structure) and the antiparallel conformation determined by NMR (PDB entry 143D, six structural models). NASNOX modeling indicates that for guanosine nucleotides residing at the tetrads, the R5 label is adequately accommodated (Figure 1C). As expected, between sites within the same G-repeat at the primary sequence [e.g., distance set (G8;G9), (G8;G10), and (G9;G10)], which measure distances within the same “edge” of the tetrad, differences between the parallel and antiparallel conformations are small [<2 Å (data not shown)]. Therefore, those distance sets are not informative with respect to differentiating conformations. On the other hand, between sites located at different G-repeats within the primary sequence, which measure distances between either neighboring or diagonal edges of the tetrad, >70% of the distance sets show differences of >4 Å between the two conformations and thus should adequately discriminate between the two different topologies. For example, the modeled inter-R5 distance between G9 and G15 is 22.9 Å in 1KF1 and 27.7 Å in 143D (Figure 1C and Table 1). Further analyses of the inter-R5 distances on the MD traces of hTel-22 show that the average distances for the set (G9;G15) belong to one of the narrowest peaks resulting from a statistical distribution of all distances (Figures S1–S3 and Table S1), with standard deviations of ~1 Å.
Table 1.
Predicted Inter-R5 Distances for the Crystal structure (PDB entry 1KF1) and NMR Structures (PDB entry 143D)
| data set | predicted distance (Å)
|
|||
|---|---|---|---|---|
| PDB
|
MD trajectories (10 μs)
|
|||
| 1KF1 | 143Da | 1KF1b | 143Db | |
| (G9;G15) | 22.9 | 27.7 (1.2) | 23.6 (1.7) | 27.3 (1.2) |
| (G3;G15) | 30.6 | 21.7 (0.9) | 32.7 (0.6) | 22.3 (1.2) |
| (G4;G15) | 29.9 | 24.0 (1.8) | 32.7 (1.0) | 26.5 (0.8) |
Average distances in six NMR models in PDB entry 143D are shown, with the standard deviation (over six models) in parentheses.
Average distances in 10 μs MD trajectories, considering regular snapshots every 10 ns, with the standard deviation (over 1000 snapshots) in parentheses. See Figures S1–S3 and Table S1 for more details.
The analyses also indicated that sites within the loops are less favorable for the purpose of differentiating the two topologies. Specifically, in general, a smaller number of allowable R5 rotamers are predicted at the loop sites as compared to the tetrad sites, to the extreme that in one of the six NMR models of 143D, no R5 rotamer is accommodated at site T12 at the loop. This indicates a much higher probability that R5 attached at loop sites may significantly alter the loop conformation. In addition, the more variable loop conformation also results in broader predicted distance distributions. For example, from the six NMR models of 143D, the distance between two loop sites, (T12;T18), ranges from 32 to 38 Å with a standard deviation of 2.7 Å, as compared to standard deviation of 1.2 Å for the (G9;G15) distance.
From the NASNOX analysis using fixed DNA structures described above, we identified three distance sets between tetrad sites located at different G-repeats, (G9;G15), (G3;G15), and (G4;G15) (Figure 1B), which fall within the DEER measuring range (20–30 Å), and each shows relatively large differences (4–9 Å) between parallel and antiparallel conformations (Table 1). We furthermore conducted MD simulations to assess how these distances might vary as the GQ conformations evolve. Simulations were obtained using the parallel conformation derived from PDB entry 1KF1 and the antiparallel conformation derived from PDB entry 143D as starting structures, and expected inter-R5 distances at (G9;G15), (G3;G15), and (G4;G15) were then computed by NASNOX using MD trajectories as input structures (see Supporting Information section S1 for more details). The reported distances are time-averaging of NASNOX-calculated distances on MD snapshots every 10 ns over 10 μs and in good agreement with those predicted on the basis of the fixed PDB structures, as summarized in Table 1. For the parallel conformation, the average distances obtained from the MD trajectory are elongated quite noticeably (0.7–2.8 Å) relative to that from the database structure itself (PDB entry 1KF1) (Table 1), which is not particularly surprising because of the greater flexibility of the molecule in solution than in the crystal phase. For the antiparallel conformation, the predicted distances of (G9;G15) and (G3;G15) obtained from the MD trajectory are very close to those predicted using the database structure itself (PDB entry 143D), within 0.6 Å difference between each other (Table 1). Interestingly, for data set (G4;G15), the predicted distances obtained using the MD trajectory and that from the database structure differ by 2.5 Å. We also note that the standard deviation from six NMR structures contained in PDB entry 143D for (G4;G15) is larger than those for (G9;G15) and (G3;G15). Both observations suggest site G4 might be more flexible than the other sites used here. Overall, the MD data support the notion that these three selected distance sets can distinguish the parallel versus antiparallel topology of hTel-22.
We note that human telomere sequences can also fold into “3+1” hybrid conformations.8 Atomic structures of the hybrid conformation are not available for the exact hTel-22 sequence but have been determined for two slightly longer ones: hybrid-1 (PDB entry 2HY9) and hybrid-2 (PDB entry 2JPZ).20,21 We conducted NASNOX modeling on 2HY9 and 2JPZ, and the results indicated that the (G9;G15), (G3;G15), and (G4;G15) data sets can distinguish hybrid conformations from the parallel and antiparallel ones (Table S2).
Inter-R5 Distances Indicate the Majority of hTel-22 Adopts the Antiparallel Conformation in NaCl
On the basis of the modeling analyses described above, we attached pairs of the R5 label at the selected G nucleotides of hTel-22 (Figure 1B) following procedures described in Materials and Methods. CD measurements were then conducted to assess the degree of perturbation caused by R5 labeling, and the results show a minimal degree of alteration, consistent with the conclusion from modeling studies that R5 rotamers at the tetrad sites are adequately accommodated by the parent GQ fold. For example, upon folding in NaCl solution, the hTel-22 DNA with R5 labeled at G9 and G15 [data set (G9;G15)] shows a CD spectrum identical to that of the unlabeled hTel-22 (Figure 1D). Both possess the characteristic features of an antiparallel GQ, with a pronounced positive band at λ = 295 nm and a negative band at λ = 265 nm.60
We then conducted DEER measurements on doubly labeled hTel-22 folded in NaCl solutions (Figure 2). For the (G9;G15) data set, the normalized background-corrected dipolar evolution trace shows a clear decay with small modulations, while the corresponding singly labeled samples revealed flat traces without oscillation or a decay pattern (Figure S4). This ensures that distances measured using the doubly labeled samples are not biased by undesired DNA–DNA interactions. The resulting distance distribution profile, obtained using the Tikhonov regulation approach, shows a major peak at ~28 Å, with a shoulder at ~22 Å (Figure 2). Further analyses using an approach developed by the Fanucci group49,52,61 indicate that the distance distribution profile of (G9;G15) can be adequately fit with two Gaussians (Figure S5), with the major population centering at 28.5 Å and accounting for 72% of the total and the minor population centering at 21.6 Å and accounting for 28% of the total (Table 2 and Figure S5). In addition, repeated measurements of the (G9;G15) sample show almost identical distance distribution profiles, with variations of <1 Å for the center distances and <5% for the population ratios. Furthermore, analyses of the measured field sweep spectra excluded the presence of distances <20 Å.
Figure 2.
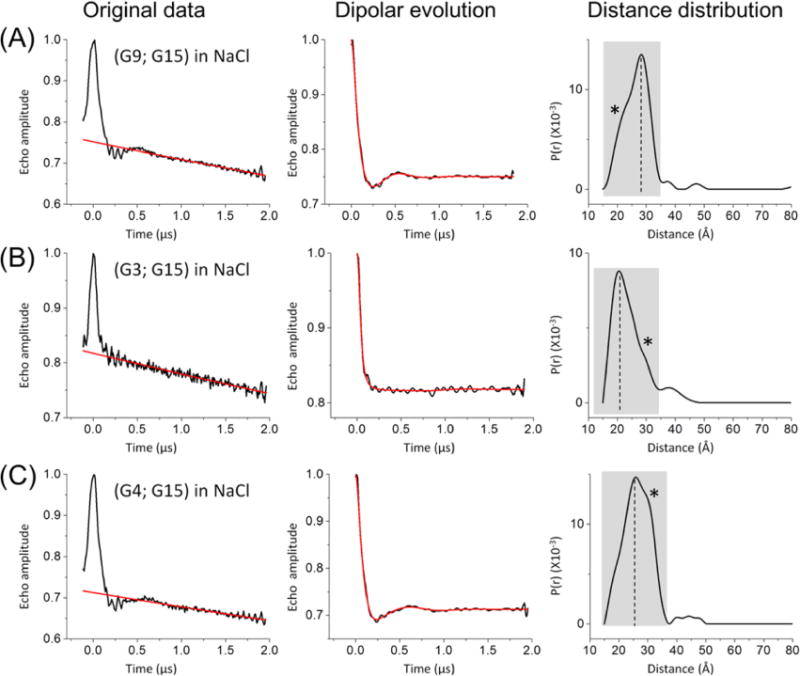
DEER measurements in NaCl solutions. Each data set is designated by the labeling sites (see Figure 1B). In each data set, the left panel shows the original echo decay data, with measured echo decay colored black and background decay colored red; the middle panel shows the dipolar evolution data, with the background-corrected dipolar evolution data colored black and the best-fit curve colored red, and the right panel shows the distance distribution profiles computed using DEER analysis. In each distance distribution profile, the shaded box denotes the nonartifact region identified using the “DEERconstruct” tool,52 which was subsequently analyzed using multiple-Gaussian dissection (see Figure S5) to yield the major (marked by the dashed line) and minor (marked by an asterisk) populations (see values listed in Table 2): (A) (G9;G15), (B) (G3;G15), and (C) (G4;G15).
Table 2.
Occupancy of Parallel and Antiparallel Conformations of hTel-22 in NaCl and KCla
| sites | antiparallel conformation
|
parallel conformation
|
||||
|---|---|---|---|---|---|---|
| expected (Å)b | measured (Å)c | percentage (%)c | expected (Å)b | measured (Å)c | percentage (%)c | |
| In NaCl | ||||||
| (G9;G15) | 27.7|27.3 | 28.5 | 72 | 22.9|23.6 | 21.6 | 28 |
| (G3;G15) | 21.7|22.3 | 21.0 | 62 | 30.6|32.7 | 29.5 | 38 |
| (G4;G15) | 24.0|26.5 | 25.6 | 78 | 29.9|32.7 | 31.0 | 22 |
| In KCl | ||||||
| (G9;G15) | 27.7|27.3 | 29.1 | 57 | 22.9|23.6 | 21.9 | 43 |
| (G3;G15) | 21.7|22.3 | 20.8 | 32 | 30.6|32.7 | 29.3 | 68 |
| (G4;G15) | 24.0|26.5 | 27.2 | 27 | 29.9|32.7 | 31.4 | 73 |
The measured major population gives a most probable distance of 28.5 Å, which is within 1.5 Å of the value predicted using the antiparallel hTel GQ structure (Tables 1 and 2). As such, consistent with the expectation and CD measurement, the measured inter-R5 distance suggests that in NaCl, a majority of hTel-22 folds into the antiparallel conformation. Interestingly, the minor population revealed by DEER gives a most probable distance of 21.6 Å, which falls within 2 Å of the corresponding expected distance for the parallel conformation (Tables 1 and 2). This indicates that under the conditions of the EPR experiments, a minor fraction of hTel-22 might fold into the parallel conformation in NaCl. In addition, the hybrid structures gave a predicted (G9;G15) inter-R5 distance of 28.9 Å in 2HY9 and 12.0 Å in 2JPZ (Table S2); both deviate significantly from the measured value of 21.6 Å (Table 1). Therefore, under the EPR condition described here, hTel-22 is unlikely to fold into a hybrid conformation.
In addition, DEER distance measurements of (G3;G15) and (G4;G15) in hTel-22 folded in NaCl lead to the same conclusion (Figure 2 and Table 2). Specifically, both data sets show a major population [62% in (G3;G15) and 78% in (G4;G15) (Table 2)] in which the measured distances [21.0 Å in (G3;G15) and 25.6 Å in (G4;G15) (Figure 2 and Table 2)] deviate by 0–1.6 Å from the corresponding expected values predicted for the antiparallel conformation. Both data sets also include a minor population [29.5 Å for (G3;G15) and 31.0 Å for (G4;G15) (Figure 2 and Table 2)] that agrees well with the values predicted for the parallel conformation [30.6–32.7 Å for (G3;G15) and 29.9–32.7 Å for (G4;G15)]. Overall, all three data sets show that in NaCl hTel-22 may adopt both antiparallel and parallel conformations, with the antiparallel conformation being the dominant species, which is consistent with previous studies.19,39 As such, inter-R5 distances measured via DEER are able to reveal topological folds of GQ.
Inter-R5 Distances Indicate That Folding in KCl Bolsters the Occupancy of the Parallel Conformation
It is well-documented that K+, which has a radius larger than that of Na+, alters folding of hTel-22.62 X-ray crystallography showed that in KCl hTel-22 adopts the parallel conformation,18 while other biophysical studies in solutions indicated that it forms hybrid conformations or a mixture of parallel, antiparallel, and hybrid conformations.8,27,39,45,63 Indeed, CD spectra of either unlabeled or R5-labeled hTel-22 folded in KCl show a negative band at λ = 235 nm and a strong positive band at λ = 290 nm (Figure 1D), which are consistent with previously reported CD spectra27,53 and are clearly different from those observed in the presence of NaCl (Figure 1D).
Consistent with the CD results, DEER traces measured on doubly labeled hTel-22 folded in KCl (Figure 3) show clear differences as compared to those measured in NaCl (Figure 2). The analysis of these DEER data reveals an increase in population fractions for the parallel conformation (Table 2). Specifically, examination of the distance distribution profile of (G9;G15) shows that there are two populations with approximately equal weights. One of the populations, accounting for 57% of the total, centers at 29.1 Å, which agrees nicely with the predicted value for the antiparallel conformation. The other population, accounting for 43% of the total, centers at 21.9 Å and matches with the expected value for the parallel conformation. This shows a clear increase in the parallel population occupancy as compared to the value of 28% measured in NaCl.
Figure 3.
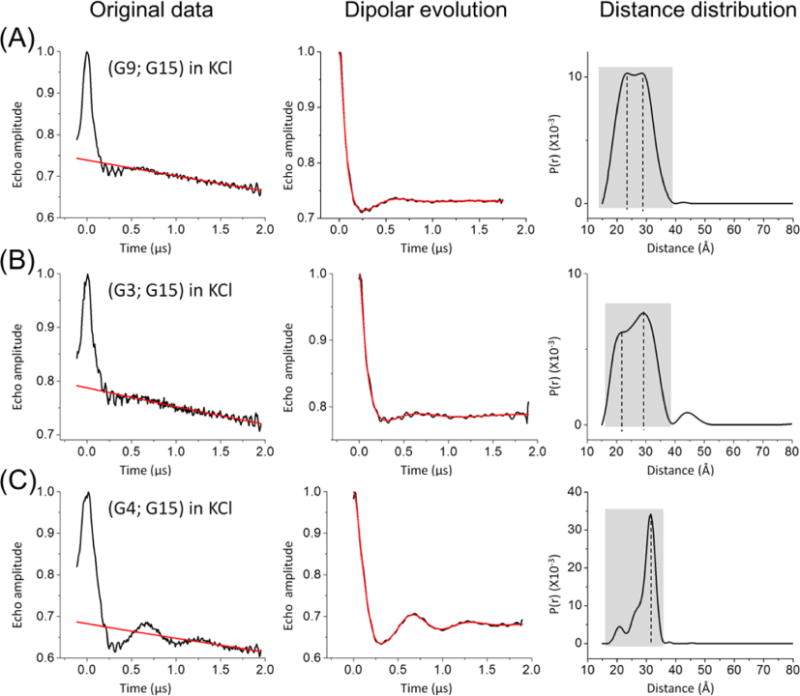
DEER measurements in KCl solutions. Panels and legends in each data set are arranged as described in Figure 2. (A) (G9;G15). The dashed lines indicate the two populations observed in the distance distribution profile. (B) (G3;G15), showing two populations. (C) (G4;G15), showing one dominant population and multiple minor peaks in the shorter distance region.
Similarly, the (G3;G15) data set contains two populations that correspond to the antiparallel (centered at ~21.7 Å) and parallel (centered at 29.3 Å) conformations, with the parallel conformation accounting for 68% of the total, which is a significant increase from that in NaCl (38%). For the (G4;G15) data set, the DEER distance profile shows a well-defined major population centered at approximately 31 Å (Figure 3), corresponding to the expected distance for the parallel conformation. Interestingly, there are multiple small populations in the shorter distance range. When dissected with the two-Gaussian fit, besides the major population (73% of the total and centered at 31.4 Å), the minor population is found to be centered at 27.2 Å. This value deviates from the value of 24.0 Å predicted for the antiparallel conformation determined by NMR (PDB entry 143D) but agrees well with the average value of 26.5 Å predicted using the MD trajectories for the same topology (Table 2). This finding is consistent with the notion that site G4 on hTel-22 is a dynamic site with higher positional variability (see above).
We also assessed whether the populations observed in KCl can be assigned to hybrid conformations. The measured (G9;G15) distances of 29.1 and 21.9 Å (Table 1) are inconsistent with the value predicted using the hybrid-2 structure [2JPZ, 12.0 Å (Table S2)], and the measured (G3;G15) distances [21.7 and 29.3 Å (Table 1)] are inconsistent with the predicted value from hybrid-1 [2HY9, 26.4 Å (Table S2)]. Collectively, the measured distances indicated that under the EPR condition described here, hTel-22 is unlikely to fold into a hybrid conformation in KCl. This conclusion is consistent with the work of Hartig, Drescher, and co-workers,39 in which distances measured using a different spin-label showed that hTel-22 in KCl folds into a mixture of parallel and antiparallel conformations, although a 24 nt hTel variant sequence adopts conformations consistent with a “3+1” hybrid structure.39
We note that glycerol, which was used in the DEER measurements as a cryoprotectant, has also been used as a crowding agent in GQ studies to investigate how a crowded cellular environment might affect the folding of GQs.64 To investigate the effect of glycerol on the folding of hTel-22, the doubly labeled (G9;G15) DNA was folded in KCl and was subjected to different incubation times in glycerol. The results show that with an incubation time of <10 min at room temperature, no significant changes are observed in the measured DEER traces or the resulting distance distribution profile (Figure 4A,B, Table 3, and Figure S5): the center distances change by <1 Å, and the population distributions change by <2%. However, when the glycerol incubation time at physiological temperature is extended from 10 min to 24 h, noticeable changes are observed: the population corresponding to the parallel conformation increases from 43 to 53% (Figure 4C and Table 3). Thus, we infer that glycerol does favor the parallel conformation, although the kinetics of glycerol-induced GQ conformational change seems rather slow. This agrees with previous reports.45,65–68
Figure 4.
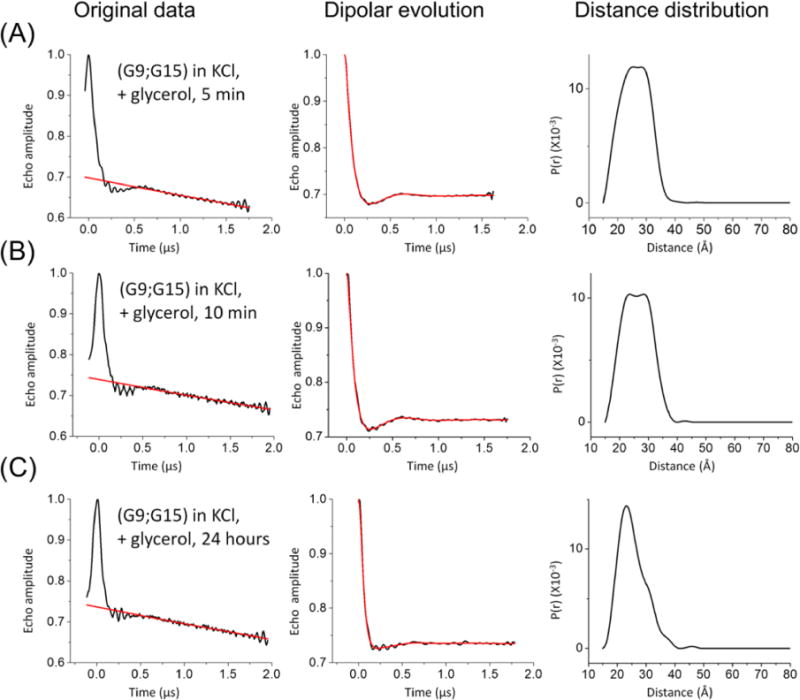
Effects of glycerol incubation time on the hTel-22 conformation distribution. Measurements were taken on the doubly labeled (G9;G15) sample folded in KCl (see Materials and Methods). Panels in each data set are arranged as described in the legend of Figure 2, and values characterizing the individual populations observed from the distance distribution profiles are listed in Table 3. (A) Incubation at room temperature for 5 min. (B) Incubation at room temperature for 10 min, which shows little change in the resulting distance distribution profile as compared to that in panel A. (C) Incubation at 4 °C for 24 h. The resulting distance distribution profile shows a pronounced increase in the short distance population (corresponding to the parallel conformation) compared to those in panels A and B.
Table 3.
Effect of Different Incubation Times with Glycerol on the hTel-22 Conformation Occupanciesa
| incubation time | antiparallel conformationb
|
parallel conformationc
|
||
|---|---|---|---|---|
| measured (Å)d | percentage (%)d | measured (Å)d | percentage (%)d | |
| 5 min | 29.8 | 55 | 22.7 | 45 |
| 10 min | 29.1 | 57 | 21.9 | 43 |
| 24 h | 28.2 | 47 | 22.4 | 53 |
Measured on the (G9;G15) data set in the presence of KCl. DEER data are shown in Figure 4.
Expected average distance of 27.7 Å (PDB entry 143D) or 27.3 Å (MD trajectories) (see Table 1).
Expected average distance of 22.9 Å (PDB entry 1KF1) or 23.6 Å (MD trajectories) (see Table 1).
Measured distances and percentages are based on a two-Gaussion fit of the distance distribution profiles (see Figure S5).
Effects of a PtII Complex on hTel-22 Conformation
One of the potential applications of spin labeling is to monitor interaction and conformational variation of GQs as they interact with small molecules or proteins. We recently reported a propeller-shaped trinuclear PtII complex, designated compound I {[Pt(dien)]3(ptp), where dien is diethylenetriamine and ptp is 6′-(pyridin-3-yl)-3,2′:4′,3″-terpyridine (Figure 5A)} that induces and stabilizes the antiparallel conformations in GQs (Figure 5B).53 Therefore, we assessed how the R5 labels can be used to monitor GQ and small molecule ligand interactions using hTel-22 labeled at (G9;G15) and (G3;G15). The (G4;G15) sample was not studied because of the complexity associated with the higher flexibility of the G4 nucleotide discussed above.
Figure 5.
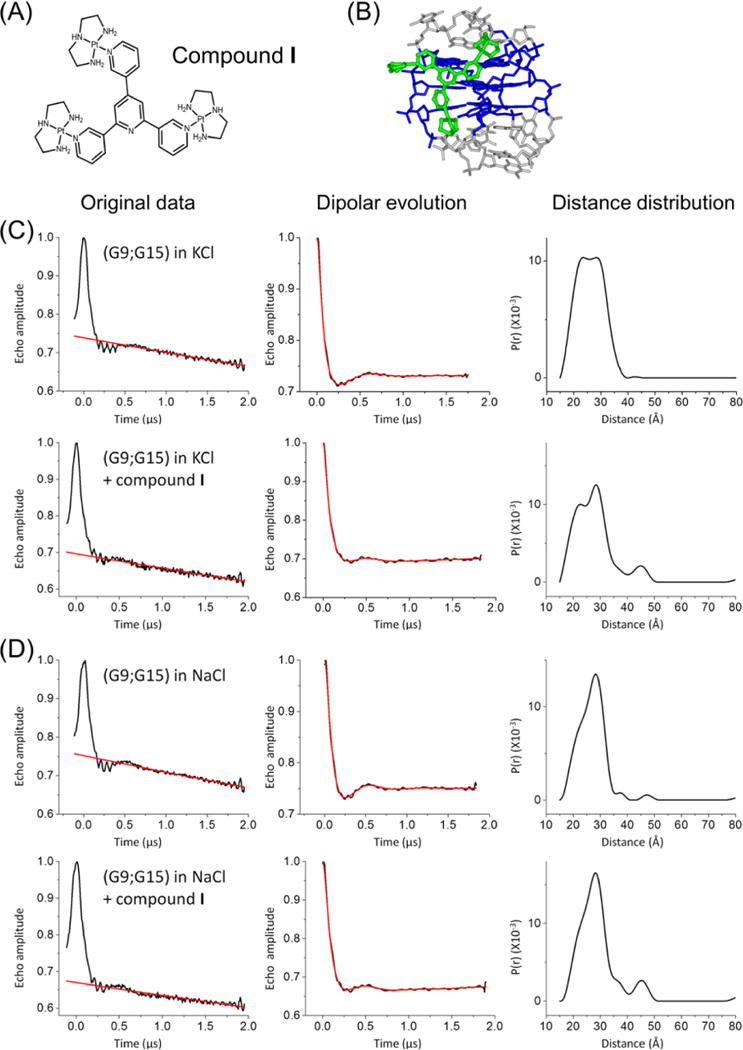
Effects of compound I on the (G9;G15) inter-R5 distance. (A) Chemical structure of compound I. The counterion is NO3−. (B) Model of compound I bound to the antiparallel hTel-22 (PDB entry 143D). Compound I is colored green; the GQ tetrad nucleotides are colored blue, and loop nucleotides are colored gray. The model was obtained by Molecular Docking as previously described.53 (C) hTel-22 folded in KCl, measured with or without compound I. (D) hTel-22 folded in NaCl, measured with or without compound I. Panels in parts C and D are arranged as described in the legend of Figure 2.
Figure 5 shows inter-R5 distances measured in the doubly labeled (G9;G15) hTel-22 in the absence and presence of I. With the addition of I, the distance distribution profiles of (G9;G15), measured in either KCl or NaCl maintain the appearance of two populations, with one centered at ~22 Å, matching that of the parallel conformation, and the other centered at ~28 Å, matching that of the antiparallel conformation. In KCl, addition of I clearly changes the population distribution, with the antiparallel conformation (longer distance) increasing from 57 to 66% (Figure 5C and Table 4). Similarly, in NaCl, the percentage of the antiparallel conformation increased from 72 to 84% (Figure 5D and Table 4). These data indicate that I can stabilize the antiparallel conformation in both KCl and NaCl solutions, consistent with conclusions drawn from previous CD measurements.53
Table 4.
Effects of Compound I on the (G9;G15) Data Seta
| antiparallel conformationb
|
parallel conformationc
|
||||
|---|---|---|---|---|---|
| measured (Å)d | percentage (%)d | measured (Å)d | percentage (%)d | ||
| NaCl | without I | 28.5 | 72 | 21.6 | 28 |
| with I | 28.0 | 84 | 21.4 | 16 | |
| KCl | without I | 29.1 | 57 | 21.9 | 43 |
| with I | 28.4 | 66 | 21.0 | 34 | |
DEER data and analyses are shown in panels C and D of Figure 5.
Expected average distance of 27.7 Å (PDB entry 143D) or 27.3 Å (MD trajectories) (see Table 1).
Expected average distance of 22.9 Å (PDB entry 1KF1) or 23.6 Å (MD trajectories) (see Table 1).
Measured distances and percentages are based on a two-Gaussion fit of the distance distribution profiles (see Figure S5).
For the (G3;G15) doubly labeled hTel-22, addition of I induces marginal changes in the distance distribution: in KCl, a small decrease in the antiparallel conformation population [from 32% to 28% (Figure 6A and Table 5)] was observed, while in NaCl, the antiparallel conformation population remains constant, as it accounts for ~62% in the absence and presence of I (Figure 6B and Table 5). Further examination of I docked on hTel-22 reveals that in the antiparallel conformation, the compound might contact the R5 label at nucleotide G3, but such contact is absent in the parallel conformation (Figure S6). Under conditions favoring the antiparallel fold (i.e., in NaCl), the effect of such contacts may cancel out the stabilizing effect of the compound. On the other hand, under conditions at which the antiparallel fold is less favorable (i.e., in KCl), such contacts, which push the DNA farther from the antiparallel conformation, might outweigh the stabilizing effect of compound I, resulting in the observed population decrease.
Figure 6.
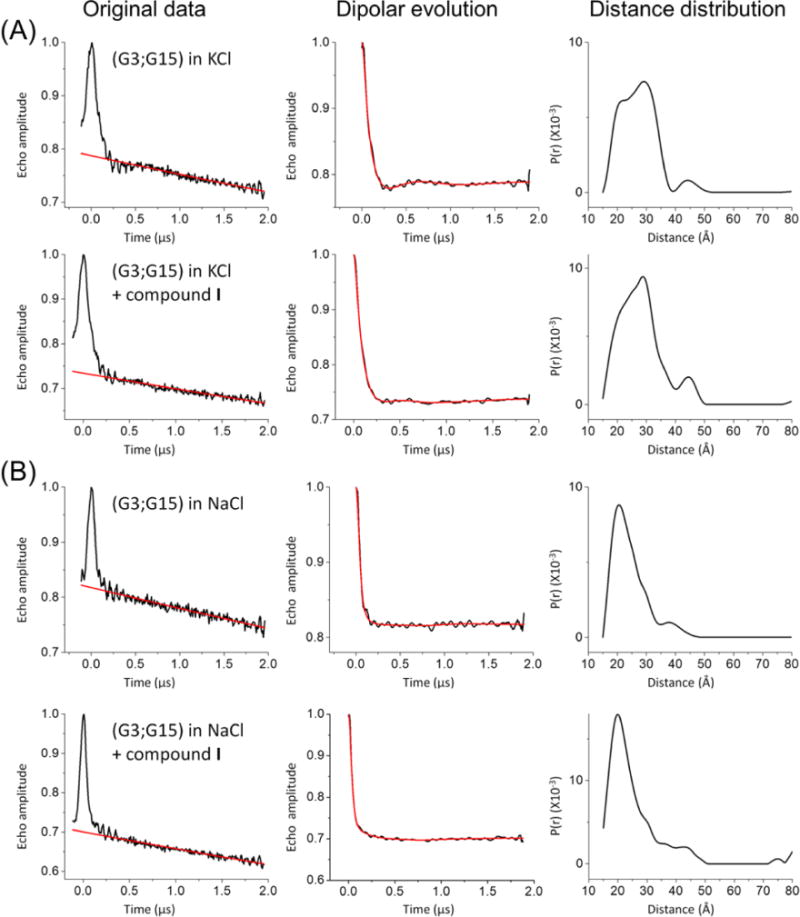
Effects of compound I on the (G3;G15) interspin distance. (A) hTel-22 folded in KCl, measured with or without compound I. (B) hTel-22 folded in NaCl, measured with or without compound I. Panels are arranged as described in the legend of Figure 2.
Table 5.
Effects of Compound I on the (G3;G15) Data Seta
| antiparallel conformationb
|
parallel conformationc
|
||||
|---|---|---|---|---|---|
| measured (Å)d | percentage (%)d | measured (Å)d | percentage (%)d | ||
| NaCl | without I | 21.0 | 62 | 29.5 | 38 |
| with I | 20.2 | 62 | 29.5 | 38 | |
| KCl | without I | 20.8 | 32 | 29.3 | 68 |
| with I | 20.3 | 28 | 28.7 | 72 | |
DEER data and analyses are shown in Figure 6.
Expected average distance of 21.7 Å (PDB entry 143D) or 22.3 Å (MD trajectories) (see Table 1).
Expected average distance of 30.6 Å (PDB entry 1KF1) or 32.7 Å (MD trajectories) (see Table 1).
Measured distances and percentages are based on a two-Gaussion fit of the distance distribution profiles (see Figure S5).
Overall, the data show that R5 can report on ligand-induced GQ conformational changes, though the placement of the label needs to be carefully designed.
DISCUSSION
In this work, we demonstrate that distances measured using the R5 nitroxide labels can be used to assess the conformation of a GQ as it folds in different salts (NaCl vs KCl) and in the absence or presence of small molecules (glycerol and compound I). In all data sets reported here, the measured distance profiles show at least two populations, and the corresponding center distances from the major populations match nicely with the expected (predicted) values for the parallel or antiparallel conformation (Table 2). All data sets indicate that in NaCl, the majority of hTel-22 adopts an antiparallel conformation, whereas in KCl, the percentage of the parallel conformation increases significantly and the parallel configuration becomes either nearly equally populated or the dominant population (Table 2). These results are consistent with published work.9,39
The R5 label is attached at the phosphate of a nucleotide,47 and the nucleotide-independent nature of this labeling scheme allows one to target any sites within the GQ-forming sequence. This is advantageous versus the previous spin labeling studies of GQs, in which the nitroxide label was attached to thymine bases residing at the loops of the hTel sequence.39,40 By placing the R5 labels at the G nucleotides that form the tetrads of the GQs, we can measure multiple distances between the “edges” of the GQ. This is highly desirable for discerning differences in the directionality of these edges, which is a key element in discriminating the topological fold of a GQ.
Another advantageous feature of the R5 tool kit is the NASNOX program,41,57 which allows efficient computation of expected inter-R5 distances based on input structures. NASNOX has been validated using known structures of DNA/RNA duplexes as well as protein–DNA complexes47,58,59 and has been previously used in deducing the conformation of a RNA junction42 and sequence-dependent DNA duplex shape.44 In this work, we have exploited NASNOX in a new way, namely to identify, prior to experimental work, informative distance pairs for differentiating various conformations, thus guiding (and not only interpreting) the DEER measurements. We examined the available atomic-resolution structures determined experimentally and from MD trajectories and used the results to guide our selection of labeling sites. Subsequent measurements indeed demonstrate the effectiveness of this approach; the fact that all the selected labeling sites give differences of >4 Å between different topological folds is crucial in dissecting the multiple populations observed in the experiments (see below). This strategy should be applicable to evaluation of new models of GQs and other biomolecules.
The studies also reveal a number of factors that should be taken into account in future spin labeling studies. As an extrinsic reporter, the impact of the R5 label on the native conformation should be taken into account, which was made evident by the different responses to compound I observed between different labeling sites (Figures 5 and 6). We also note that from an analysis of the DEER-derived distance distribution profiles, the occupancies of the parallel and antiparallel conformations show a fair degree of variation. Specifically, occupancies of the antiparallel conformation are quite consistent among the three data sets in NaCl [70 ± 8% (Table 2)] but show a larger variation in KCl [39 ± 16% (Table 2)]. In addition to limitations posted by the signal-to-noise ratio of the measured data and the analysis tools employed, occupancy variations in KCl might also reflect small site-dependent differences in how the R5 label impacts the GQ fold. Although CD spectroscopy suggests no significant perturbation of R5 to the native structures of GQ, each site possesses a unique character, such as a difference in flexibility revealed by MD simulations, and the response to R5 attachment could vary under different conditions. In addition, although R5 labeling is cost-effective and highly efficient, the flexible nature of this probe and the presence of diastereomers should be taken into account when designing experiments.
Currently, the majority of DEER measurements are conducted in a frozen solution with a cryoprotectant such as glycerol. We showed that a short incubation period (1–10 min), which is routine in DEER sample preparation, does not affect the conformation distribution, which agrees with previous EPR studies of G-quadruplexes.39 On the other hand, a long time incubation (24 h) of glycerol with hTel-22 prior to the DEER measurement does give measurable impact on the DNA conformation distributions. This is consistent with previous reports that crowding agents might alter the GQ structures45,65–68 and should be taken into consideration in future experiments.
In this work, existing high-resolution structures and MD trajectories of the hTel-22 were used as the basis for designing the EPR experiments and interpreting the results. However, determining whether a particular DNA sequence such as hTel-22 can adopt other topologies in various solutions might require more distance measurements. In the case of additional distance sets, as mentioned earlier, choices in which at least one pair lays in the central tetrad region are more favorable because of its higher rigidity, as identified by fairly small standard deviations of the distance distribution peaks from MD traces (Figure S3 and Table S1).
Note that SDSL EPR is not limited by the size of the target molecule, and the R5 label has been attached to long DNA strands.37 Together with the results here demonstrating that inter-R5 distance measurements can distinguish different GQ folds, the R5 tool kit provides a new means for studying the conformation and conformation changes of long DNA and RNA sequences that form GQ and even multimeric GQs, as well as investigating how a ligand might impact GQ conformations. Because studying long DNA/RNA molecule remains challenging for most physicochemical tools, we believe that our joint experimental–computational protocol will provide valuable information regarding the structure–function interplay for supramolecular GQ structures, which are likely to fold from long GQ motifs in vivo.
Supplementary Material
Acknowledgments
Funding
This work has been suported, in part, by the National Science Foundation (P.Z.Q., CHE-1213673 and CHE-1156836), the National Institutes of Health (P.Z.Q., RR028992), and the National Natural Science Foundation of China (21172274, 21328101, and 21231007). Computational work was funded by the Grant Agency of the Czech Republic through Grant P208/11/1822 (J.S. and P.S.); Project “CEITEC-Central European Institute of Technology” (CZ.1.05/1.1.00/02.0068) (J.S.); Project Employment of Best Young Scientists for International Cooperation Empowerment, registration number CZ.1.07/2.3.00/30.0037, co-financed by the European Social Fund and the state budget of the Czech Republic (B.I.); and USC-WiSE major support (R.D.F.).
Footnotes
Supporting Information
The Supporting Information is available free of charge on the ACS Publications website at DOI: 10.1021/acs.biochem.5b01189.
Details of MD simulations and additional DEER data and analyses (PDF)
Notes
The authors declare no competing financial interest.
References
- 1.Gellert M, Lipsett MN, Davies DR. Helix formation by guanylic acid. Proc Natl Acad Sci U S A. 1962;48:2013–2018. doi: 10.1073/pnas.48.12.2013. [DOI] [PMC free article] [PubMed] [Google Scholar]
- 2.Chaires JB, Graves D. Quadruplex Nucleic Acids. Vol. 330. Springer; Heidelberg: 2013. [Google Scholar]
- 3.Sen D, Gilbert W. Formation of parallel four-stranded complexes by guanine-rich motifs in DNA and its implications for meiosis. Nature. 1988;334:364–366. doi: 10.1038/334364a0. [DOI] [PubMed] [Google Scholar]
- 4.Lipps HJ, Rhodes D. G-quadruplex structures: in vivo evidence and function. Trends Cell Biol. 2009;19:414–422. doi: 10.1016/j.tcb.2009.05.002. [DOI] [PubMed] [Google Scholar]
- 5.Rodriguez R, Miller KM, Forment JV, Bradshaw CR, Nikan M, Britton S, Oelschlaegel T, Xhemalce B, Balasubramanian S, Jackson SP. Small-molecule-induced DNA damage identifies alternative DNA structures in human genes. Nat Chem Biol. 2012;8:301–310. doi: 10.1038/nchembio.780. [DOI] [PMC free article] [PubMed] [Google Scholar]
- 6.Biffi G, Tannahill D, McCafferty J, Balasubramanian S. Quantitative visualization of DNA G-quadruplex structures in human cells. Nat Chem. 2013;5:182–186. doi: 10.1038/nchem.1548. [DOI] [PMC free article] [PubMed] [Google Scholar]
- 7.Biffi G, Di Antonio M, Tannahill D, Balasubramanian S. Visualization and selective chemical targeting of RNA G-quadruplex structures in the cytoplasm of human cells. Nat Chem. 2013;6:75–80. doi: 10.1038/nchem.1805. [DOI] [PMC free article] [PubMed] [Google Scholar]
- 8.Dai J, Carver M, Yang D. Polymorphism of human telomeric quadruplex structures. Biochimie. 2008;90:1172–1183. doi: 10.1016/j.biochi.2008.02.026. [DOI] [PMC free article] [PubMed] [Google Scholar]
- 9.Phan AT. Human telomeric G-quadruplex: structures of DNA and RNA sequences. FEBS J. 2010;277:1107–1117. doi: 10.1111/j.1742-4658.2009.07464.x. [DOI] [PubMed] [Google Scholar]
- 10.Neidle S. Human telomeric G-quadruplex: the current status of telomeric G-quadruplexes as therapeutic targets in human cancer. FEBS J. 2010;277:1118–1125. doi: 10.1111/j.1742-4658.2009.07463.x. [DOI] [PubMed] [Google Scholar]
- 11.Campbell NH, Neidle S. G-quadruplexes and metal ions. Met Ions Life Sci. 2012;10:119–134. doi: 10.1007/978-94-007-2172-2_4. [DOI] [PubMed] [Google Scholar]
- 12.Chen Y, Yang D. Sequence, stability, and structure of G-quadruplexes and their interactions with drugs. Curr Protoc Nucleic Acid Chem. 2012;50:17.15.11–17.15.17. doi: 10.1002/0471142700.nc1705s50. [DOI] [PMC free article] [PubMed] [Google Scholar]
- 13.Balasubramanian S, Hurley LH, Neidle S. Targeting G-quadruplexes in gene promoters: a novel anticancer strategy? Nat Rev Drug Discovery. 2011;10:261–275. doi: 10.1038/nrd3428. [DOI] [PMC free article] [PubMed] [Google Scholar]
- 14.Muller S, Rodriguez R. G-quadruplex interacting small molecules and drugs: from bench toward bedside. Expert Rev Clin Pharmacol. 2014;7:663–679. doi: 10.1586/17512433.2014.945909. [DOI] [PubMed] [Google Scholar]
- 15.Zhang S, Wu Y, Zhang W. G-quadruplex structures and their interaction diversity with ligands. ChemMedChem. 2014;9:899–911. doi: 10.1002/cmdc.201300566. [DOI] [PubMed] [Google Scholar]
- 16.Yatsunyk LA, Mendoza O, Mergny JL. “Nano-oddities”: unusual nucleic acid assemblies for DNA-based nanostructures and nanodevices. Acc Chem Res. 2014;47:1836–1844. doi: 10.1021/ar500063x. [DOI] [PubMed] [Google Scholar]
- 17.Livshits GI, Stern A, Rotem D, Borovok N, Eidelshtein G, Migliore A, Penzo E, Wind SJ, Di Felice R, Skourtis SS, Cuevas JC, Gurevich L, Kotlyar AB, Porath D. Long-range charge transport in single G-quadruplex DNA molecules. Nat Nanotechnol. 2014;9:1040–1046. doi: 10.1038/nnano.2014.246. [DOI] [PubMed] [Google Scholar]
- 18.Parkinson GN, Lee MP, Neidle S. Crystal structure of parallel quadruplexes from human telomeric DNA. Nature. 2002;417:876–880. doi: 10.1038/nature755. [DOI] [PubMed] [Google Scholar]
- 19.Wang Y, Patel DJ. Solution structure of the human telomeric repeat d[AG3(T2AG3)3] G-tetraplex. Structure. 1993;1:263–282. doi: 10.1016/0969-2126(93)90015-9. [DOI] [PubMed] [Google Scholar]
- 20.Dai J, Carver M, Punchihewa C, Jones RA, Yang D. Structure of the Hybrid-2 type intramolecular human telomeric G-quadruplex in K+ solution: insights into structure polymorphism of the human telomeric sequence. Nucleic Acids Res. 2007;35:4927–4940. doi: 10.1093/nar/gkm522. [DOI] [PMC free article] [PubMed] [Google Scholar]
- 21.Dai J, Punchihewa C, Ambrus A, Chen D, Jones RA, Yang D. Structure of the intramolecular human telomeric G-quadruplex in potassium solution: a novel adenine triple formation. Nucleic Acids Res. 2007;35:2440–2450. doi: 10.1093/nar/gkm009. [DOI] [PMC free article] [PubMed] [Google Scholar]
- 22.Lim KW, Amrane S, Bouaziz S, Xu W, Mu Y, Patel DJ, Luu KN, Phan AT. Structure of the human telomere in K+ solution: a stable basket-type G-quadruplex with only two G-tetrad layers. J Am Chem Soc. 2009;131:4301–4309. doi: 10.1021/ja807503g. [DOI] [PMC free article] [PubMed] [Google Scholar]
- 23.Lim KW, Ng VC, Martin-Pintado N, Heddi B, Phan AT. Structure of the human telomere in Na+ solution: an antiparallel (2 + 2) G-quadruplex scaffold reveals additional diversity. Nucleic Acids Res. 2013;41:10556–10562. doi: 10.1093/nar/gkt771. [DOI] [PMC free article] [PubMed] [Google Scholar]
- 24.Karsisiotis AI, Hessari NM, Novellino E, Spada GP, Randazzo A, Webba da Silva M. Topological characterization of nucleic acid G-quadruplexes by UV absorption and circular dichroism. Angew Chem, Int Ed. 2011;50:10645–10648. doi: 10.1002/anie.201105193. [DOI] [PubMed] [Google Scholar]
- 25.Vorlickova M, Kejnovska I, Sagi J, Renciuk D, Bednarova K, Motlova J, Kypr J. Circular dichroism and guanine quadruplexes. Methods. 2012;57:64–75. doi: 10.1016/j.ymeth.2012.03.011. [DOI] [PubMed] [Google Scholar]
- 26.Wang ZF, Li MH, Hsu ST, Chang TC. Structural basis of sodium-potassium exchange of a human telomeric DNA quadruplex without topological conversion. Nucleic Acids Res. 2014;42:4723–4733. doi: 10.1093/nar/gku083. [DOI] [PMC free article] [PubMed] [Google Scholar]
- 27.Xu Y, Noguchi Y, Sugiyama H. The new models of the human telomere d[AGGG(TTAGGG)3] in K+ solution. Bioorg Med Chem. 2006;14:5584–5591. doi: 10.1016/j.bmc.2006.04.033. [DOI] [PubMed] [Google Scholar]
- 28.Shirude PS, Okumus B, Ying L, Ha T, Balasubramanian S. Single-molecule conformational analysis of G-quadruplex formation in the promoter DNA duplex of the proto-oncogene c-kit. J Am Chem Soc. 2007;129:7484–7485. doi: 10.1021/ja070497d. [DOI] [PMC free article] [PubMed] [Google Scholar]
- 29.Wang H, Nora GJ, Ghodke H, Opresko PL. Single molecule studies of physiologically relevant telomeric tails reveal POT1 mechanism for promoting G-quadruplex unfolding. J Biol Chem. 2011;286:7479–7489. doi: 10.1074/jbc.M110.205641. [DOI] [PMC free article] [PubMed] [Google Scholar]
- 30.Abraham Punnoose J, Cui Y, Koirala D, Yangyuoru PM, Ghimire C, Shrestha P, Mao H. Interaction of G-quadruplexes in the full-length 3′ human telomeric overhang. J Am Chem Soc. 2014;136:18062–18069. doi: 10.1021/ja510079u. [DOI] [PubMed] [Google Scholar]
- 31.Chiorcea-Paquim AM, Santos PV, Eritja R, Oliveira-Brett AM. Self-assembled G-quadruplex nanostructures: AFM and voltammetric characterization. Phys Chem Chem Phys. 2013;15:9117–9124. doi: 10.1039/c3cp50866h. [DOI] [PubMed] [Google Scholar]
- 32.Haider SM, Neidle S. A molecular model for drug binding to tandem repeats of telomeric G-quadruplexes. Biochem Soc Trans. 2009;37:583–588. doi: 10.1042/BST0370583. [DOI] [PubMed] [Google Scholar]
- 33.Sponer J, Cang X, Cheatham TE., 3rd Molecular dynamics simulations of G-DNA and perspectives on the simulation of nucleic acid structures. Methods. 2012;57:25–39. doi: 10.1016/j.ymeth.2012.04.005. [DOI] [PMC free article] [PubMed] [Google Scholar]
- 34.Woiczikowski PB, Kubar T, Gutierrez R, Cuniberti G, Elstner M. Structural stability versus conformational sampling in biomolecular systems: why is the charge transfer efficiency in G4-DNA better than in double-stranded DNA? J Chem Phys. 2010;133:035103. doi: 10.1063/1.3460132. [DOI] [PubMed] [Google Scholar]
- 35.Lech CJ, Phan AT, Michel-Beyerle ME, Voityuk AA. Electron-hole transfer in G-quadruplexes with different tetrad stacking geometries: a combined QM and MD study. J Phys Chem B. 2013;117:9851–9856. doi: 10.1021/jp404788t. [DOI] [PubMed] [Google Scholar]
- 36.Hubbell WL, Altenbach C. Investigation of structure and dynamics in membrane proteins using site-directed spin labeling. Curr Opin Struct Biol. 1994;4:566–573. [Google Scholar]
- 37.Ding Y, Nguyen P, Tangprasertchai NS, Reyes CV, Zhang X, Qin PZ. Electron Paramagnetic Resonance. The Royal Society of Chemistry; London: 2015. Nucleic acid structure and dynamics: perspectives from site-directed spin labeling; pp. 122–147. [Google Scholar]
- 38.Tangprasertchai NS, Zhang X, Ding Y, Tham K, Rohs R, Haworth IS, Qin PZ. An Integrated Spin-Labeling/Computational-Modeling Approach for Mapping Global Structures of Nucleic Acids. Methods Enzymol. 2015;564:427–453. doi: 10.1016/bs.mie.2015.07.007. [DOI] [PMC free article] [PubMed] [Google Scholar]
- 39.Singh V, Azarkh M, Exner TE, Hartig JS, Drescher M. Human telomeric quadruplex conformations studied by pulsed EPR. Angew Chem, Int Ed. 2009;48:9728–9730. doi: 10.1002/anie.200902146. [DOI] [PubMed] [Google Scholar]
- 40.Azarkh M, Singh V, Okle O, Dietrich DR, Hartig JS, Drescher M. Intracellular conformations of human telomeric quadruplexes studied by electron paramagnetic resonance spectroscopy. ChemPhysChem. 2012;13:1444–1447. doi: 10.1002/cphc.201100980. [DOI] [PubMed] [Google Scholar]
- 41.Qin PZ, Haworth IS, Cai Q, Kusnetzow AK, Grant GPG, Price EA, Sowa GZ, Popova A, Herreros B, He H. Measuring nanometer distances in nucleic acids using a sequence-independent nitroxide probe. Nat Protoc. 2007;2:2354–2365. doi: 10.1038/nprot.2007.308. [DOI] [PMC free article] [PubMed] [Google Scholar]
- 42.Zhang X, Tung CS, Sowa GZ, Hatmal MmM, Haworth IS, Qin PZ. Global structure of a three-way junction in a phi29 packaging RNA dimer determined using site-directed spin labeling. J Am Chem Soc. 2012;134:2644–2652. doi: 10.1021/ja2093647. [DOI] [PMC free article] [PubMed] [Google Scholar]
- 43.Ding Y, Zhang X, Tham KW, Qin PZ. Experimental mapping of DNA duplex shape enabled by global lineshape analyses of a nucleotide-independent nitroxide probe. Nucleic Acids Res. 2014;42:e140. doi: 10.1093/nar/gku695. [DOI] [PMC free article] [PubMed] [Google Scholar]
- 44.Zhang X, Dantas Machado AC, Ding Y, Chen Y, Lu Y, Duan Y, Tham KW, Chen L, Rohs R, Qin PZ. Conformations of p53 response elements in solution deduced using site-directed spin labeling and Monte Carlo sampling. Nucleic Acids Res. 2014;42:2789–2797. doi: 10.1093/nar/gkt1219. [DOI] [PMC free article] [PubMed] [Google Scholar]
- 45.Li J, Correia JJ, Wang L, Trent JO, Chaires JB. Not so crystal clear: the structure of the human telomere G-quadruplex in solution differs from that present in a crystal. Nucleic Acids Res. 2005;33:4649–4659. doi: 10.1093/nar/gki782. [DOI] [PMC free article] [PubMed] [Google Scholar]
- 46.Zhang X, Cekan P, Sigurdsson ST, Qin PZ. Studying RNA using site-directed spin-labeling and continuous-wave electron paramagnetic resonance spectroscopy. Methods Enzymol. 2009;469:303–328. doi: 10.1016/S0076-6879(09)69015-7. [DOI] [PMC free article] [PubMed] [Google Scholar]
- 47.Cai Q, Kusnetzow AK, Hubbell WL, Haworth IS, Gacho GPC, Van Eps N, Hideg K, Chambers EJ, Qin PZ. Site-directed spin labeling measurements of nanometer distances in nucleic acids using a sequence-independent nitroxide probe. Nucleic Acids Res. 2006;34:4722–4734. doi: 10.1093/nar/gkl546. [DOI] [PMC free article] [PubMed] [Google Scholar]
- 48.Jeschke G, Chechik V, Ionita P, Godt A, Zimmermann H, Banham J, Timmel C, Hilger D, Jung H. DeerAnalysis2006—a comprehensive software package for analyzing pulsed ELDOR data. Appl Magn Reson. 2006;30:473–498. [Google Scholar]
- 49.Blackburn ME, Veloro AM, Fanucci GE. Monitoring inhibitor-induced conformational population shifts in HIV-1 protease by pulsed EPR spectroscopy. Biochemistry. 2009;48:8765–8767. doi: 10.1021/bi901201q. [DOI] [PubMed] [Google Scholar]
- 50.Galiano L, Ding F, Veloro AM, Blackburn ME, Simmerling C, Fanucci GE. Drug pressure selected mutations in HIV-1 protease alter flap conformations. J Am Chem Soc. 2009;131:430–431. doi: 10.1021/ja807531v. [DOI] [PMC free article] [PubMed] [Google Scholar]
- 51.Gray RD, Li J, Chaires JB. Energetics and kinetics of a conformational switch in G-quadruplex DNA. J Phys Chem B. 2009;113:2676–2683. doi: 10.1021/jp809578f. [DOI] [PMC free article] [PubMed] [Google Scholar]
- 52.Casey TM, Fanucci GE. Spin labeling and Double Electron-Electron Resonance (DEER) to Deconstruct Conformational Ensembles of HIV Protease. Methods Enzymol. 2015;564:153–187. doi: 10.1016/bs.mie.2015.07.019. [DOI] [PMC free article] [PubMed] [Google Scholar]
- 53.Xu CX, Shen Y, Hu Q, Zheng YX, Cao Q, Qin PZ, Zhao Y, Ji LN, Mao ZW. Stabilization of Human Telomeric G-Quadruplex and Inhibition of Telomerase Activity by Propeller-Shaped Trinuclear Pt(II) Complexes. Chem – Asian J. 2014;9:2519–2526. doi: 10.1002/asia.201402258. [DOI] [PubMed] [Google Scholar]
- 54.Stadlbauer P, Krepl M, Cheatham TE, 3rd, Koca J, Sponer J. Structural dynamics of possible late-stage intermediates in folding of quadruplex DNA studied by molecular simulations. Nucleic Acids Res. 2013;41:7128–7143. doi: 10.1093/nar/gkt412. [DOI] [PMC free article] [PubMed] [Google Scholar]
- 55.Perez A, Marchan I, Svozil D, Sponer J, Cheatham TE, 3rd, Laughton CA, Orozco M. Refinement of the AMBER force field for nucleic acids: improving the description of alpha/gamma conformers. Biophys J. 2007;92:3817–3829. doi: 10.1529/biophysj.106.097782. [DOI] [PMC free article] [PubMed] [Google Scholar]
- 56.Krepl M, Zgarbova M, Stadlbauer P, Otyepka M, Banas P, Koca J, Cheatham TE, 3rd, Jurecka P, Sponer J. Reference simulations of noncanonical nucleic acids with different chi variants of the AMBER force field: quadruplex DNA, quadruplex RNA and Z-DNA. J Chem Theory Comput. 2012;8:2506–2520. doi: 10.1021/ct300275s. [DOI] [PMC free article] [PubMed] [Google Scholar]
- 57.Price EA, Sutch BT, Cai Q, Qin PZ, Haworth IS. Computation of nitroxide-nitroxide distances for spin-labeled DNA duplexes. Biopolymers. 2007;87:40–50. doi: 10.1002/bip.20769. [DOI] [PMC free article] [PubMed] [Google Scholar]
- 58.Cai Q, Kusnetzow AK, Hideg K, Price EA, Haworth IS, Qin PZ. Nanometer Distance Measurements in RNA Using Site-Directed Spin Labeling. Biophys J. 2007;93:2110–2117. doi: 10.1529/biophysj.107.109439. [DOI] [PMC free article] [PubMed] [Google Scholar]
- 59.Chen Y, Zhang X, Dantas Machado AC, Ding Y, Chen Z, Qin PZ, Rohs R, Chen L. Structure of p53 binding to the BAX response element reveals DNA unwinding and compression to accommodate base-pair insertion. Nucleic Acids Res. 2013;41:8368–8376. doi: 10.1093/nar/gkt584. [DOI] [PMC free article] [PubMed] [Google Scholar]
- 60.Balagurumoorthy P, Brahmachari SK. Structure and stability of human telomeric sequence. J Biol Chem. 1994;269:21858–21869. [PubMed] [Google Scholar]
- 61.Kear JL, Blackburn ME, Veloro AM, Dunn BM, Fanucci GE. Subtype polymorphisms among HIV-1 protease variants confer altered flap conformations and flexibility. J Am Chem Soc. 2009;131:14650–14651. doi: 10.1021/ja907088a. [DOI] [PMC free article] [PubMed] [Google Scholar]
- 62.Lane AN, Chaires JB, Gray RD, Trent JO. Stability and kinetics of G-quadruplex structures. Nucleic Acids Res. 2008;36:5482–5515. doi: 10.1093/nar/gkn517. [DOI] [PMC free article] [PubMed] [Google Scholar]
- 63.Redon S, Bombard S, Elizondo-Riojas MA, Chottard JC. Platinum cross-linking of adenines and guanines on the quadruplex structures of the AG3(T2AG3)3 and (T2AG3)4 human telomere sequences in Na+ and K+ solutions. Nucleic Acids Res. 2003;31:1605–1613. doi: 10.1093/nar/gkg259. [DOI] [PMC free article] [PubMed] [Google Scholar]
- 64.Petraccone L, Pagano B, Giancola C. Studying the effect of crowding and dehydration on DNA G-quadruplexes. Methods. 2012;57:76–83. doi: 10.1016/j.ymeth.2012.02.011. [DOI] [PubMed] [Google Scholar]
- 65.Yu H, Gu X, Nakano S, Miyoshi D, Sugimoto N. Beads-on-a-string structure of long telomeric DNAs under molecular crowding conditions. J Am Chem Soc. 2012;134:20060–20069. doi: 10.1021/ja305384c. [DOI] [PubMed] [Google Scholar]
- 66.Miller MC, Buscaglia R, Chaires JB, Lane AN, Trent JO. Hydration is a major determinant of the G-quadruplex stability and conformation of the human telomere 3′ sequence of d(AG3(TTAG3)3. J Am Chem Soc. 2010;132:17105–17107. doi: 10.1021/ja105259m. [DOI] [PubMed] [Google Scholar]
- 67.Heddi B, Phan AT. Structure of human telomeric DNA in crowded solution. J Am Chem Soc. 2011;133:9824–9833. doi: 10.1021/ja200786q. [DOI] [PubMed] [Google Scholar]
- 68.Dhakal S, Cui Y, Koirala D, Ghimire C, Kushwaha S, Yu Z, Yangyuoru PM, Mao H. Structural and mechanical properties of individual human telomeric G-quadruplexes in molecularly crowded solutions. Nucleic Acids Res. 2013;41:3915–3923. doi: 10.1093/nar/gkt038. [DOI] [PMC free article] [PubMed] [Google Scholar]
Associated Data
This section collects any data citations, data availability statements, or supplementary materials included in this article.