

Abstract
Introduction
Diffusion weighted imaging (DWI) methods can noninvasively ascertain cerebral microstructure by examining pattern and directions of water diffusion in the brain. We calculated heritability for DWI parameters in cerebral white (WM) and gray matter (GM) to study the genetic contribution to the diffusion signals across tissue boundaries.
Methods
Using Old Order Amish (OOA) population isolate with large family pedigrees and high environmental homogeneity, we compared the heritability of measures derived from three representative DWI methods targeting the corpus callosum WM and cingulate gyrus GM: diffusion tensor imaging (DTI), the permeability‐diffusivity (PD) model, and the neurite orientation dispersion and density imaging (NODDI) model. These successively more complex models represent the diffusion signal modeling using one, two, and three diffusion compartments, respectively.
Results
We replicated the high heritability of the DTI‐based fractional anisotropy (h 2 = 0.67) and radial diffusivity (h 2 = 0.72) in WM. High heritability in both WM and GM tissues were observed for the permeability‐diffusivity index from the PD model (h 2 = 0.64 and 0.84), and the neurite density from the NODDI model (h 2 = 0.70 and 0.55). The orientation dispersion index from the NODDI model was only significantly heritable in GM (h 2 = 0.68).
Conclusion
DWI measures from multicompartmental models were significantly heritable in WM and GM. DWI can offer valuable phenotypes for genetic research; and genes thus identified may reveal mechanisms contributing to mental and neurological disorders in which diffusion imaging anomalies are consistently found. Hum Brain Mapp 37:525–535, 2016. © 2015 Wiley Periodicals, Inc.
Keywords: DTI, DWI, heritability, genetics, imaging
INTRODUCTION
Brain white matter (WM) is composed of primarily myelinated axonal fibers and their supportive cellular and extracellular structures. By restricting water and ion exchange, myelinated WM facilitates rapid electrical signal conductance among neural cells. Assuming that this function is evolutionarily selected and thus genetically influenced, identification of specific genes that affect WM structure and function may facilitate discovery of molecular mechanisms involved in brain disorders that impact WM. To this end, diffusion weighted imaging (DWI) offers a noninvasive way to assess WM properties and to potentially develop relevant phenotypes for genetic research. DWI uses one or more diffusion sensitization contrasts (b‐values) to characterize myelinated tissue by measuring how it restricts diffusion of water throughout the brain, probing a core property of the myelinated structures. However, there are many DWI approaches that give rise to numerous diffusion phenotypes. Establishing genetic influences on these will improve our understanding of WM genetics.
Researchers have shown that diffusion tensor imaging (DTI) can yield heritable measures from the WM [Braskie et al., 2011; Brouwer et al., 2010; Chiang et al., 2011; Glahn et al., 2007; Hasler and Northoff, 2011; Jahanshad et al., 2013; Kochunov et al., 2011b, 2015], supporting the use of diffusion signals for genetic research. The DTI is the simplest of DWI models developed to explain behavior of water diffusion in biological tissues. It assumes a single biological compartment with a monoexponential decay of the diffusion signal (Fig. 1) [Basser and Pierpaoli, 1996]. DTI protocols use a single diffusion weighting b‐value, which is a setting on the scanner used to sensitize the scan to water diffusion. Due to its relatively modest imaging requirements and simple analysis, it became the most popular DWI technique in neuroimaging research [Basser and Pierpaoli, 2011].
Figure 1.
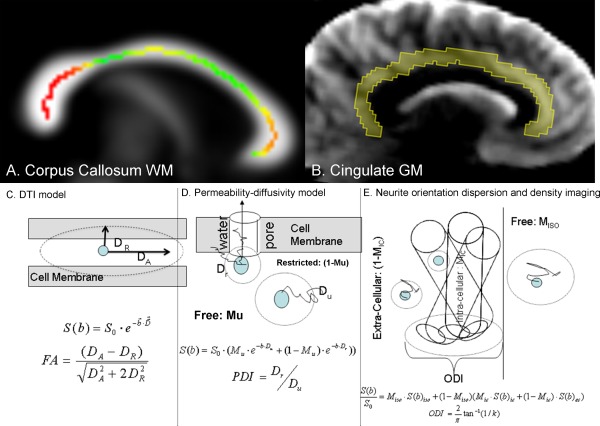
Upper panel: (A) Corpus callosum (CC) white matter (WM) region‐of‐interest was identified by thresholding the FA image at FA = 0.20. The skeleton of the midsagittal colossal WM measured using the ENIGMA‐DTI pipeline is shown as colored line with the magnitude of FA values represented by colors and overlaid on the fractional anisotropy map at midline. (B) The region of interest for cingulate gray matter (GM) was identified using radial diffusivity maps that show excellent contrast between GM, WM, and CSF. Lower panel: schematic comparison of the DTI model (C), permeability‐diffusivity (PD) model (D), and Neurite orientation dispersion and density imaging (NODDI) model (E). The DTI model assumes that the signal is produced by a single pool of anisotropically diffusing water and characterizes this anisotropy using fractional anisotropy (FA). The PD‐model, developed by Sukstanskii et al. (2004), assumes that the signal is produced by two quasi‐pools of isotropically diffusing water. Unrestricted pool (M u) is produced by water molecules that are sufficiently away from the cellular membranes to be unaffected by them. The water near the membrane forms the restricted compartment (1 − M u) whose diffusivity depends on both the passive diffusivity of water through the cellular/myelin membrane and the active (thick arrow) permeability via the ionic channels and water pores that use water as a substrate for compartment exchange. The NODDI model, developed by Zhang et al. (2012) assumes contribution from three compartments: the unrestricted diffusion compartment (M iso), intracellular (M ic), and extra cellular (1 − M ic). Neurites (neurons or axons) are expected to have a given angular distribution about the principle axis that is characterized by the orientation dispersion index (ODI). [Color figure can be viewed in the online issue, which is available at http://wileyonlinelibrary.com.]
The monocompartmental, 3D‐Gausian, approximation of diffusion decay used by DTI is arguably only valid at the low diffusion weighting (b‐values ≤1,000 s/mm2). At higher b‐values the diffusion signal behavior in brain tissue deviates from the mono exponential behavior (Fig. 1). In fact, the 3D‐Gaussian, monoexponential decay of diffusion signal can only be observed in CSF [Assaf and Cohen, 1998; Clark et al., 2002; Kochunov et al., 2013; Wu et al., 2011a, 2011b]. DWI methods that assume more than one diffusion compartment were developed to better approximate the behavior of diffusion signal at higher b‐values and to capture richer information on the molecular propagation mechanisms in brain tissues. Measurements derived by these methods show stronger effect size and provide more information in neuropsychiatric research than these measured from the standard DTI model [Baumann et al., 2012; Kochunov et al., 2013, 2014a; Zhu et al., 2014]. We aimed to assess additional complex DWI measures that might be under genetic control. Many DWI modeling approaches have emerged, making testing all models overwhelming. We chose to test genetic influences on measures derived from the two and three diffusion compartment modeling approaches that are used to quantify diffusion signal behavior at higher b‐values.
Two‐compartment DWI models have been developed to account for the non‐Gaussian behavior of diffusion signal. There are several models that use a two‐compartment terminology; one of which is the permeability diffusivity (PD) model [Kochunov et al., 2013, 2014a]. In general, the two‐compartment models calculate: the compartment fraction for the unrestricted, freely diffusing (M u) and restricted (1 − M u) compartments and their corresponding diffusivities. Some two‐compartment models ascribe restricted and unrestricted fractions to two physical compartments, typically to extra‐ and intracellular compartments [Clark et al., 2002; Wu et al., 2011a, 2011b]. However, experiments in animals and extruded liposomes show that population fractions for the unrestricted and restricted “pools” may not coincide with the known volume fractions of extra‐ and intracellular spaces [Hwang et al., 2003; Schwarcz et al., 2004; Stokes et al., 2012; Yablonskiy et al., 2003]. The PD model is based on theoretical work by Sukstanskii et al. that explains the biexponential behavior of the diffusion signal by the presence of a permeable cellular membrane, leading to an inhomogeneous distribution of local transverse magnetization (Fig. 1) [Sukstanskii et al., 2003, 2004]. It calculates the permeability‐diffusivity index (PDI), which is the ratio of the diffusivity of the unrestricted versus the restricted compartments. This ratio depends on the water exchange between two compartments (see Methods). The PD‐model was previously evaluated in schizophrenia, where the PDI deficit showed improved ability to discriminate between patients versus controls compared with DTI, and correlated closely to white matter aging in schizophrenia [Kochunov et al., 2013, 2014a].
Other DWI models assume three diffusion compartments: glial cells, axons, and extra‐cellular spaces [Assaf et al., 2002; Behrens et al., 2003; Stanisz et al., 1997; Zhang et al., 2012]. One example is the Neurite Orientation Dispersion and Density Imaging (NODDI) model [Zhang et al., 2012]. NODDI assumes that the diffusion signals from each imaging “voxel” are originated from intra‐axonal, extra‐axonal, and isotropic or “free‐diffusing water” diffusion spaces. This model aims to link diffusion‐weighted signals to cellular tissue properties such as intra‐ vs. extra‐axonal diffusivity, axon diameter, and neurite orientation. NODDI calculates the orientation dispersion index (ODI) that reflects the angular variation of the modeled axonal orientation within a diffusion imaging voxel. Two other parameters are the fractions of the intra‐axonal space (M ic), which is intended to represent the neurite density, and the fraction of the voxel that is modeled by isotropic water diffusion (M iso). Applications of the NODDI model reveal that ODI and M iso capture age‐related brain changes better than DTI [Billiet et al., 2015; Jelescu et al., 2014; Nazeri et al., 2014]. Despite the intriguing modeling claims, these increasingly sophisticated techniques face the question about their validity for indexing genetically (and environmentally) regulated WM neurobiology. The presumed higher accuracy of DWI models should theoretically lead to new and/or more heritable brain measures and present a better target for genome‐wide studies to identify genetic variants affecting WM.
We set out to identify DWI models with the highest heritability using a family study design. The Old Order Amish (OOA) are of European Caucasian ancestry. They are known for their very large family sizes and accurate genealogical record keeping, making OOA population a powerful resource for heritability analyses even in modest sample sizes. In addition, the OOA share similar rural upbringing, all individuals receive the same level of basic school education, and few use illicit substances. The greatly improved environmental homogeneity as compared with a general population sample is advantageous for comparing heritability of different diffusion traits as it reduces between‐subject variations in uncontrolled developmental and environmental factors that may nonuniformly confound the different traits, yielding more precise estimates of the genetic contributions.
We chose three models, DTI, PD, and NODDI, to represent the one, two, and three compartment modeling approaches, respectively. Our experiment was performed in the midsagittal band of the brain that encompassed the corpus callosum. We focused our study on this region because the midsagittal band of corpus callosum is the best location to assess homogeneous WM. The corpus callosum has a simple parallel fiber orientation that contains no crossing fibers [Aboitiz et al., 1992]. The comparison of the DTI, PD, and NODDI models should be more straightforward in this region because the impact of intravoxel crossing fibers may be difficult to assess. Furthermore, the PD and NODDI models can be applied across cerebral tissue boundaries [Kochunov et al., 2013; Zhang et al., 2012]. Therefore, we also assessed the heritability of PD and NODDI parameters measured from the gray matter (GM) of the cingulate gyrus overlaying the corpus callosum. This presented an opportunity to evaluate the additive genetic influences on DWI parameters in both WM and GM tissues.
METHODS
Subjects
Our study included 137 members (59M/78F, age = 51.2 ± 15.1; 18–80 years) of OOA families from Lancaster County, PA. The participants were from seventeen nuclear families, and belonged to a pedigree that connected them within eight generations based on genealogical records that are meticulously maintained by the OOA community and recorded in the NIH Anabaptist Genealogy Database (AGDB) which traces back to the founders [Agarwala et al., 1998; Lee et al., 2010; Mitchell et al., 2012]. The genealogical data extracted from this database was converted to the pedigree format used by the SOLAR‐Eclipse software package (http://www.nitrc.org/projects/se_linux). Exclusion criteria included major medical and neurological conditions that may affect gross brain structures such as developmental disability, head trauma, seizure, stroke, or transient ischemic attack. Psychiatric conditions without gross structural abnormalities were not excluded: the sample included 29 individuals with a lifetime diagnosis of psychiatric disorders, including mood disorders (n = 8), anxiety disorders (n = 12), psychosis (n = 3), and other psychiatric disorders (n = 6) based on Schedule for Clinical Interview for DSM‐IV (SCID). This represented a 21.5% rate of psychiatric illness in this sample of the OOA isolate, which is comparable to the 22.4% prevalence rate of psychiatric illnesses in the general U.S. population [Kessler et al., 2005]. The psychiatric subgroup was not excluded in part because including them preserved the familial structure. All subjects with psychiatric disorders were taking psychotropic medications for their conditions. This included six subjects who were taking anti‐psychotic, thirteen subjects taking anti‐depressant, eleven subjects taking mood‐stabilizers and four subjects taking other psychotropic medications. Heritability analyses were performed by adding medication status as a binary covariate.
Imaging and Data Analysis Protocols
Amish study subjects were brought to the University of Maryland Center for Brain Imaging Research where they were imaged using a Siemens 3 T TRIO (Erlangen, Germany) system and a 32‐channel head coil. Two imaging protocols were applied: (1) high‐angular resolution diffusion imaging (HARDI) for DTI measures and (2) multi‐b‐value diffusion imaging (MBI) for PD and NODDI.
HARDI protocol
The full protocol is described in detail elsewhere [Kochunov et al., 2011a]. Briefly, it consists of a single‐shot, echo‐planar, single refocusing spin‐echo, T2‐weighted sequence with a spatial resolution of 1.7 × 1.7 × 3.0 mm. The sequence parameters were: TE/TR = 87/8,000 ms, FOV = 200 mm, axial slice orientation with 50 slices and no gaps, 64 isotropically distributed diffusion weighted directions, two diffusion weighting values (b = 0 and 700 s/mm2) and five b = 0 images, calculated using an optimization technique that maximizes the contrast to noise ratio for FA measurements [Jones et al., 1999]. The total scan time was about 9 min. The HARDI data were corrected for eddy‐current distortions and a tensor was fitted at each voxel to extract DTI measures including FA, axial (D A) and radial (D R) diffusivity. Multisubject analysis of FA values was performed using ENIGMA‐DTI pipeline (http://enigma.ini.usc.edu/ongoing/dti-working-group/) [Jahanshad et al., 2013] along the spatial course of the corpus callosum.
Multi‐b‐value imaging protocol
The protocol was developed based on q‐space in vivo mapping of water diffusion [Clark et al., 2002; Wu et al., 2011b]. This protocol consisted of 15 shells of b‐values (b = 250, 500, 600, 700, 800, 900, 1,000, 1,250, 1,500, 1,750, 2,000, 2,500, 3,000, 3,500, and 3,800 s/mm2; diffusion gradient duration = 47 ms, separation = 54 ms). Thirty isotropically distributed diffusion weighted directions were collected per shell, including sixteen b = 0 images. The highest b‐value (b = 3,800 s/mm2) was chosen because the SNR for the corpus callosum (SNR = 6.1 ± 0.7) measured in five healthy volunteers (ages 25–50 years) during protocol development met the empirical requirement of SNR = 5.0. The b‐values and the number of directions per shell were chosen for improved fit of the biexponential model [Jones et al., 1999]. The data were collected using a single‐shot, echo‐planar, single refocusing spin‐echo, T2‐weighted sequence (TE/TR = 120/1,500 ms with the FOV = 200 mm) with a spatial resolution of 1.7 × 1.7 × 4.6 mm and seven slices prescribed in sagittal orientation to sample the corpus callosum and cingulate gyrus (Fig. 1). The scan time was about 10 min.
Segmentation of corpus callosum and cingulate gyrus
The corpus callosum mask was derived per subject based on the contrast in FA between corpus callosum and the nearby GM and CSF. Voxel‐wise FA, D A, and D R images were created using Camino software (http://cmic.cs.ucl.ac.uk/camino) [Alexander et al., 2011]. Segmentation was semiautomatic, using an intensity histogram‐approach and manual editing in the Mango software (http://ric.uthscsa.edu/mango). Next, the D R map was used to derive the cingulate gyrus mask using intensity‐histogram and manual editing. D R maps provide good contrast between GM (moderate radial diffusivity), WM (low radial diffusivity) and CSF (high radial diffusivity) (Fig. 1).
PD model calculations
The PD model was presented elsewhere [Kochunov et al., 2013], using parameters derived from the following bi‐exponential two‐compartment diffusion model fit [Eq. (1)]:
| (1) |
| (2) |
Here S(b) is the average diffusion weighted signal for a given b value, averaged across all directions. M u is the compartmental fraction of the signal that comes from unrestricted diffusion, and (1 − M u) is the signal from the compartment with restricted diffusion. This model assumes that the diffusion signal is produced by two quasi‐pools of anisotropically diffusing water. D u is the mean unrestricted diffusivity of the water molecules that are away from the axonal membranes. D r is the mean restricted diffusivity of the water molecules that are within the restricted ion channels or close to axonal membranes. The parameters are the compartmental fraction M u and the permeability‐diffusivity index (PDI), which is the ratio of D r and D u [Eq. (2)]. An increase in membrane permeability via activated ion channels should increase water exchange and thus D r, resulting in higher PDI. Conversely, reduced active permeability should reduce PDI. The diffusion weighted images were calculated for corpus callosum and cingulate gyrus (Fig. 1).
NODDI model calculations
NODDI was fitted using the default model parameters in the NODDI toolbox [Eq. (3)] by assuming that normalized diffusion signal S(b)/S o is a combination of signals from intercellular (S ic), extracellular (S ec), and isotropic (S iso) compartments [Zhang et al., 2012]. The model calculates the orientation dispersion index (ODI) and the size for the intracellular (M ic) and isotropic (M iso) compartments. ODI is an index of spatial dispersion [Eq. (4)] that is obtained by normalizing the “concentration” parameter k, produced by fitting an orientation distribution function to the intra‐axonal space [Zhang et al., 2011].
| (3) |
| (4) |
ODI takes values from 0 to 1, with 0 values indicating a strictly parallel orientation of fibers and 1 indicating isotropically‐dispersed orientation [Zhang et al., 2011].
Statistical Analysis
The variance components method, as implemented in the SOLAR‐Eclipse software package (http://www.nitrc.org/projects/se_linux) was used to calculate heritability (h 2), which is defined as the proportion of the total phenotypic variance (σ 2 p) that is explained by additive genetic factors (σ 2 g) in related individuals. Briefly, SOLAR‐Eclipse employs maximum likelihood variance decomposition methods [Amos, 1994]. The covariance matrix, Ω, for a pedigree of individuals is given by Eq. (5):
| (5) |
where σ g 2 is the portion of the variance that is due to additive genetic factors, Φ is the kinship matrix, σ e 2 is the variance due to unique environmental effects and measurement error, and I is an identity matrix. The variance parameters are estimated by comparing the observed phenotypic covariance matrix with the covariance matrix predicted by kinship. Significance of the heritability is tested by comparing the likelihood of the model in which σ g 2 is constrained to zero with that of a model in which σ g 2 is estimated. Twice the difference between the loge likelihoods of these models yields a test statistic, which is asymptotically distributed as a 1/2:1/2 mixture of a χ 2 variable.
We also performed a correlation analysis to quantify the magnitude of shared phenotypic variance among traits. The statistical significance for all heritability and correlation analyses was based on the Bonferroni correction for multiple comparisons.
RESULTS
Additive Genetic Effect of DWI Measurements in WM and GM
The corpus callosum showed significant heritability in FA (h 2 = 0.67 ± 0.22) and radial diffusivity D R (h 2 = 0.72 ± 0.22) of DTI, PDI of the PD model (h 2 = 0.64 ± 0.24), and the neurite density (fraction of intracellular space M ic) of the NODDI model (h 2 = 0.70 ± 0.21) (Table 1 and Fig. 2).
Table 1.
The average value and the results of the heritability analysis for the parameters of the diffusion models are shown
| White matter: corpus callosum | Variable | Symbol | Average ± std. dev. | h 2 | SE | P |
Significant covariates (P < 0.05) |
|---|---|---|---|---|---|---|---|
| DTI | Fractional Anisotropy | FA | 0.69 ± 0.03 | 0.67 | 0.25 | 0.001 | Age |
| Axial Diffusivity | DA | 1.43 ± 0.09 × 10⁻³ | 0.41 | 0.35 | 0.10 | none | |
| Radial Diffusivity | DR | 0.50 ± 0.04 × 10⁻³ | 0.72 | 0.22 | 0.001 | Age | |
| PD Model | Permeability‐diffusivity Index | PDI | 0.04 ± 0.01 | 0.64 | 0.24 | 0.001 | Age |
| Compartmental Fraction | Mu | 0.56 ± 0.04 | 0.33 | 0.31 | 0.16 | Age | |
| NODDI Model | Orientation Dispersion Index | ODI | 0.08 ± 0.01 | 0.42 | 0.31 | 0.08 | Age |
| Neurite Density | M ic | 0.59 ± 0.07 | 0.70 | 0.21 | 0.005 | Age | |
| Isotropic Water Volume | M iso | 0.36 ± 0.12 | 0.41 | 0.45 | 0.25 | Age | |
| Gray Matter: Cingulate | |||||||
| PD Model | Permeability‐Diffusivity Index | PDI | 0.08 ± 0.02 | 0.84 | 0.27 | 0.0007 | Age |
| Compartmental Fraction | Mu | 0.67 ± 0.05 | 0.53 | 0.37 | 0.09 | Age | |
| NODDI Model | Orientation Dispersion Index | ODI | 0.40 ± 0.13 | 0.68 | 0.30 | 0.01 | Age |
| Neurite Density | M ic | 0.42 ± 0.09 | 0.55 | 0.24 | 0.01 | Age | |
| Isotropic Water Volume | M iso | 0.27 ± 0.08 | 0.44 | 0.25 | 0.06 | Age |
DTI: diffusion tensor imaging model. PD: permeability‐diffusivity model. M u is the compartmental fraction of the signal that comes from the compartment with unrestricted diffusion. NODDI: the Neurite Orientation Dispersion and Density Imaging model. ODI: the orientation dispersion index. M ic: the fraction for the intracellular compartment, thought to represent neurite density in the voxel space. Miso: the fraction for the isotropic diffusion compartment, thought to represent free standing water in the voxel space, e.g., cerebrospinal fluid. Bolded statistics were significant after Bonferroni correction for eight tests in the WM (P < 0.00625) and five tests in the GM (P < 0.01).
Figure 2.
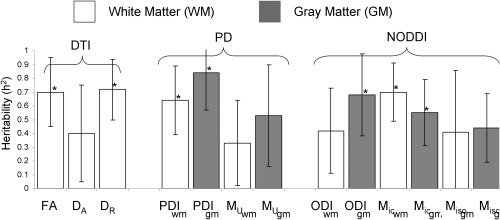
Heritability values for DWI parameters measured in white matter (WM) and gray matter (GM), the bars represent standard error of the mean. *Significant heritability estimate (P < 0.05).
The cingulate gyrus showed significant heritability for PDI (h 2 = 0.84 ± 0.27) from the PD and ODI and M ic from the NODDI model GM (h 2 = 0.68 ± 0.30 and 0.55 ± 0.24, respectively) (Table 1). Therefore, PDI was significantly heritable in WM and GM. The neurite density (M ic) from the NODDI model was also significantly heritable in both WM and GM. Linear age was the only significant covariate for twelve out of thirteen measurements. Sex and its interaction with age were not significant (all P > 0.2). Medication status was a robustly non‐significant covariate (all P > 0.5).
Phenotypic Correlations Between DTI and Other DWI in WM
FA was inversely and significantly correlated with the compartment fraction of the PDI model (M u) (Table 2). Radial diffusivity (D R) was positively associated with M u (r = 0.65; P = 8.3 × 10⁻¹⁶), which appeared to match theoretical assumptions: the larger unrestricted intra‐axonal diffusion pool should be associated with higher D R. In comparison, axial diffusivity (D A) was strongly and positively correlated with PDI and inversely correlated with ODI.
Table 2.
Corpus callosum white matter phenotypic correlation (P value) between DTI vs. PD and DTI vs. NODDI
| PD model | NODDI model | |||||
|---|---|---|---|---|---|---|
| PDIwm | M u_wm | ODIwm | M ic_wm | M iso_wm | ||
| DTI | FAwm | 0.05 (0.6) | −0.48 (2.8 × 10⁻⁸) | −0.05 (0.5) | 0.02 (0.8) | 0.27 (0.003) |
| D A_wm | 0.61 (4 × 10⁻¹³) | 0.11 (0.35) | −0.60 (8.3 × 10⁻¹⁶) | 0.04 (0.7) | −0.24 (0.008) | |
| D R_wm | −0.12 (0.24) | 0.65 (8.3 × 10⁻¹⁶) | 0.36 (5.3 × 10⁻⁵) | −0.09 (0.36) | 0.43 (9.3 × 10⁻⁷) | |
Bolded values are significant after corrected for 52 comparisons across Tables 2, 4 to IV (P < 9.6 × 10⁻⁴). DTI: diffusion tensor imaging; PD: permeability‐diffusivity model; NODDI: neurite orientation dispersion and density imaging model; FA: fractional anisotropy; D A and D R: axial and radial diffusivities; PDI: permeability‐diffusivity index; M u: fraction of the unrestricted freely diffusing compartment; ODI: orientation dispersion index; M ic and M iso: size for the intracellular and isotropic compartments.
Phenotypic Correlations Between PD and NODDI in WM and GM
Correlations are shown in Table 3. The correlations in GM followed the same pattern as in WM. PDI was inversely related to all NODDI measures in both types of tissues, but more strongly in corpus callosum. The correlations between ODI, PDI, and Mu were significant in WM, but not in GM.
Table 3.
Phenotypic correlation (P value) among the parameters of the PD model (PDI and Mu) and NODDI model (ODI, Mic and Miso) in corpus callosum (left panel) and cingulate gyrus (right panel)
| Corpus callosum | Cingulate gyrus | ||||||
|---|---|---|---|---|---|---|---|
| PDI | PDI | ||||||
| NODDI | PDI_wm | M u_wm | NODDI | PDI_gm | M u_gm | ||
| ODIwm | −0.64 (3.1 × 10⁻¹⁵) | 0.42 (1.7 × 10⁻⁶) | ODIgm | −0.23 (0.01) | 0.18 (0.05) | ||
| Mic_wm | −0.53 (4.5 × 10⁻¹⁰) | −0.32 (8.6 × 10⁻⁴) | M ic_gm | −0.43 (1.2 × 10⁻⁶) | −0.60 (5.3 × 10⁻¹³) | ||
| M iso _wm | −0.61 (1.2 × 10⁻¹³) | 0.27 (0.002) | M iso_gm | −0.31 (0.005) | −0.33 (1.9 × 10⁻⁴) | ||
Phenotypic Correlations of DWI Parameters Measured in WM Versus GM
Overall, the DWI parameters measured in GM showed good correlations with the same parameter in WM (r = 0.47–0.72) (Table 4). The highest correlation between the WM and GM was observed for the PDI and M ic coefficients (both r = 0.72).
Table 4.
White matter (WM) and gray matter (GM) phenotypic correlation (P value) among the parameters of the permeability‐diffusivity model (PDI and Mu) and the NODDI model (ODI, Mic and Miso)
| WM vs. GM | PD model | NODDI model | ||||
|---|---|---|---|---|---|---|
| PDIwm | M u_wm | ODIwm | M ic_wm | M iso_wm | ||
| PD Model | PDIgm | 0.72 (8.3 × 10⁻²⁰) | 0.05 (0.6) | −0.39 (3.7 × 10⁻⁵) | −0.45 (3.0 × 10⁻⁷) | −0.36 (5.0 × 10⁻⁵) |
| M u_gm | 0.02 | 0.47 (6.0 × 10⁻⁸) | −0.35 (1.0 × 10⁻³) | −0.41 (3.5 × 10⁻⁶) | 0.50 (6.1 × 10⁻⁹) | |
| NODDI Model | ODIgm | −0.48 (9.7 × 10⁻⁷) | 0.35 (6.1 × 10⁻⁵) | 0.70 (6.5 × 10⁻¹⁶) | .25 (0.005) | 0.57 (1.1 × 10⁻¹³) |
| M ic_gm | −0.35 (7.5 × 10⁻⁵) | −0.43 (1.6 × 10⁻⁶) | −0.03 (0.7) | 0.72 (1.0 × 10⁻¹⁸) | 0.08 (0.5) | |
| M iso_gm | −0.60 (5.7 × 10⁻¹³) | 0.02 (0.9) | 0.35 (1.2 × 10⁻⁴) | −0.53 (1.6 × 10⁻¹⁰) | 0.54 (9.5 × 10⁻¹¹) | |
DISCUSSION
In the first study of genetic attributes across different DWI techniques, several important findings emerged. First, we replicated the significant heritability of the DTI‐based measurements in Old Order Amish (OOA) participants. Heritability of the FA values for the corpus callosum (h 2 = 0.67 ± 0.25) in OOA participants was in line with the range of heritability estimates observed in other cohorts (h 2 = 0.42–0.89) [Jahanshad et al., 2013; Kochunov et al., 2014b, 2015]. Likewise, we confirmed high heritability for DR compared with a more modest genetic control over DA [Kochunov et al., 2010]. Novel findings are that PD and NODDI models can also yield significant heritability estimates in both WM and GM. PDI, the permeability‐diffusivity index, showed the highest heritability (h 2 = 0.64 ± 0.24) for the PD model, while M ic, thought to represent neurite density, had the highest heritability (h 2 = 0.70 ± 0.21) for the NODDI model. Age was the only significant covariate. This was expected as the DTI and DWI measurements are sensitive indices of WM aging [Kochunov et al., 2012, 2014a]. We replicated previously reported significant cross‐tissue correlation of PD and NODDI parameters in WM and GM [Chang et al., 2015; Kochunov et al., 2013]. Significant shared variance between DWI parameters measured in WM and GM suggests that these techniques may capture the similar biological properties shared in WM and GW. This may help with studying genetic effects of diffusion properties in both tissues. In that sense, this finding was encouraging, and suggesting that, unlike DTI that is restricted to WM, the PD and NODDI models can be used to study microstructural integrity of cerebral GM in addition to WM.
The neurobiology of these DWI measures remains somewhat obscure, limiting the mechanistic interpretation of our findings. Meanwhile, their high heritability increases the potential that one may use these diffusion measures as phenotypes to identify contributing genetic variants, which in turn should facilitate research on the neurobiological basis of DWI.
An advantage of DWI techniques, such as PD and NODDI, is that their derived measures are meaningful in both GM and WM. Heritability analysis showed that the degree of genetic contribution was similar among tissue types, but not uniform across parameters. Two DWI parameters, PDI and M ic, were robustly heritable in both corpus callosum and cingulate gyrus (Table 1). In particular, the main parameter, PDI, in the PD model showed significant heritability in both GM (h 2 = 0.84 ± 0.27) and WM (h 2 = 0.64 ± 0.24) and the difference in the heritability of PDI in GM versus WM was not significant (P = 0.11). PDI was postulated to be sensitive to the active membrane permeability [Sukstanskii et al., 2004], which may be under strong genetic control. The clinical potentials of these data are further corroborated with earlier findings that PDI provided a better separation of schizophrenia from controls than DTI and showed significant patient control differences in both GM and WM [Kochunov et al., 2013; Sukstanskii et al., 2004].
The M ic of the NODDI model, defined as the fraction of the intracellular compartment with restricted diffusivity and was termed “neurite density” by the originator of the NODDI model, was also shown to be under a strong genetic control in the GM and WM regions evaluated here. Other parameters were also significantly heritable but appeared more tissue‐dependent. The key NODDI parameter ODI was significantly heritable in GM but not in WM (h 2 = 0.68 ± 0.30 vs. 0.42 ± 0.31, respectively). As stated previously, ODI is an estimate of the spatial coherence, with zero representing perfect coherence. As WM fibers are in parallel alignment in the mid‐sagittal corpus callosum [Aboitiz, 1992; Aboitiz et al., 1992], it has high spatial coherence and thus low values and minimal variability across the entire population: ODI for the corpus callosum was much lower than that for the cingulate gyrus (0.13 ± 0.07 vs. 0.57 ± 0.23, respectively). The low variance and value may have contributed to the lower heritability for ODI in corpus callosum.
The unrestricted compartmental fraction M u of the PD model and isotropic water fraction M iso of the NODDI model were not significantly heritable in either tissue type. Both parameters represent the fraction of the water pool (high diffusivity) in their respective models. The lack of genetic control implies that their variances may be influenced by environmental factors. This interpretation would be consistent with the finding that M u was related to the volume of the hyperintensive WM lesions [Kochunov et al., 2014a] that are commonly associated with environmental factors such as brain trauma [McGuire et al., 2013a,2013b,2014]. However, we should interpret any insignificant findings in this sample with caution because the lack of statistical significance in the heritability estimates of some parameters could be due to a modest study sample size and/or random noise variations.
The phenotypic correlation analyses help to understand the similarities and differences among the models. The PDI and ODI measured in the two tissue types were highly correlated (both r > 0.7). Such high correlation between the same DWI parameters measured in two tissue types argues that they are good measures for common diffusion properties shared by GM and WM tissues. The model parameters that represent the fraction of free water, M u and M iso, showed weaker correlations (r = 0.47 and 0.54) between GM and WM. A limitation of these correlation results is that it is difficult to draw a direct biological interpretation among the models as they are built on different theoretical assumptions and methodologies.
Between models, we replicated a previously reported negative correlation between FA and M u of the PDI model (r = −0.48, P = 2.8 × 10⁻⁸; Table 2) [Kochunov et al., 2014a]. M u was increased by neurodegenerative processes that increase the extra‐cellular water fraction [Kochunov et al., 2014a], which should be opposite to FA that was reduced in many neurodegenerative conditions. The same interpretation may be applied to the negative correlation between FA and the isotropic diffusion space (M iso) of the NODDI model. Also consistent with these interpretations is that both Mu and M iso were positively correlated with radial diffusivity. In comparison, axial diffusivity was strongly correlated with PDI (r = 0.61, P = 4 × 10⁻¹³; Table 2), confirming a previously reported finding in an independent cohort [Kochunov et al., 2013]. Therefore, although we currently have limited ability to explain the correlations neurobiologically, there is a great deal of conceptual and empirical consistency among model parameters.
The complexity of the interpretation of the shared variance among some DWI parameters is a long‐standing issue [Clark et al., 2002; Wu et al., 2011a, 2011b]. Experiments in biological tissues [Schwarcz et al., 2004], extruded liposomes [Stokes et al., 2012], and computer simulations [Hwang et al., 2003; Yablonskiy et al., 2003] indicate that the proposed physical interpretations for DWI models, such as the fractions for the extra‐and‐intracellular spaces may not agree with the volume fractions that were measured directly. Therefore, a remaining challenge in the field is to understand the neurobiology of the underlying microscopic processes contributing to the complex diffusion decay functions. One way to meet this challenge may be to first identify those diffusion parameters that are heritable in order to affirm a potential genetic and thus biological underpinning. This can then be followed by genetic association studies on these heritable diffusion traits. If genes associated with some of these heritable diffusion traits can be identified, it would fundamentally elevate our ability to identify the biological basis of the DWI diffusion signals including the relationships among DWI models. Additional biological insight may also be gained by performing multi‐dimensional genetic analysis on DWI measurements. For instance, diffusion tensors can be considered as six‐dimensional variables [Lee et al., 2009] for Falconer's heritability statistics.
A limitation of this study is that its scope maybe limited because of the unique cohort of OOA individual. However, heritability for DTI in the OOA is within the range previously reported; and for a comparative study of heritability across different phenotypes, the current cohort should have provided the advantage of reduced confounds from differential exposures to environmental variance across traits. The terminology of the DWI measures, assigned by the original authors to imply specific aspects of neurobiology, should be interpreted with caution. The meaning of DWI parameters is model‐specific and may not be comparable across DWI models. For instance, the fraction of unrestricted water compartment of PD‐model and the fraction of free diffusing water in NODDI model showed only modest correlation. Finally, each of the measurement was treated as an independent trait despite the significant shared variance 10 to 50% that was discovered among them.
The study was performed in the sagittal band of corpus callosum. This was based on two considerations: homogeneity of WM in this region and long‐scan time needed to collect the whole‐brain multi‐b‐value data. The DTI, PD and NODDI models do not equally account for crossing fibers and it remains to be determined how crossing fibers may influence the heritability measurements. Therefore, using corpus callosum in our first comparison overcame this since corpus callosum has a simple architecture with no crossing fibers [Aboitiz et al., 1992]. The second consideration can now be resolved using multiplex DTI sequences, including these distributed by the Human Connectome Project [Feinberg et al., 2010; Moeller et al., 2010]. These sequences can accelerate collection of imaging data by two to eightfold, making the whole‐brain multi‐b‐value imaging practical. Additional cross‐evaluations of DWI models can therefore be directed toward clinically‐important regions with crossing fibers.
CONCLUSIONS
We took advantage of a family design to perform genetic dissections and comparisons of the DWI models. The multigenerational pedigree structure of the OOA sample allowed for a good statistical power using only a modest sample size. The relative environmental homogeneity of the cohort further increased our confidence of the calculated heritability. The strong additive genetic load thus identified and observed to be shared between GM and WM supports the use of advanced DWI models to derive diffusion‐based endophenotypes for genetic studies on the cerebral microstructure under normal and neuropsychiatric conditions.
ACKNOWLEDGMENT
The authors are grateful of the Amish families who have supported this research.
Peter Kochunov and Mao Fu share first authorship on this manuscript.
REFERENCES
- Aboitiz F (1992): Brain connections: Interhemispheric fiber systems and anatomical brain asymmetries in humans. Biol Res 25:51–61. [PubMed] [Google Scholar]
- Aboitiz F, Scheibel AB, Fisher RS, Zaidel E (1992): Fiber composition of the human corpus callosum. Brain Res 598:143–153. [DOI] [PubMed] [Google Scholar]
- Agarwala RBLG, Hopkins KA, Francomano CA, Schaffer AA (1998): Software for constructing and verifying pedigrees within large genealogies and an application to the old order Amish of Lancaster County. Genome Res 8:211–221. [DOI] [PubMed] [Google Scholar]
- Alexander DC, Hubbard PL, Hall MG, Moore EA, Ptito M, Parker GJ, Dyrby TB (2011): Orientationally invariant indices of axon diameter and density from diffusion MRI. Neuroimage 52:1374–1389. [DOI] [PubMed] [Google Scholar]
- Amos CI (1994): Robust variance‐components approach for assessing genetic linkage in pedigrees. Am J Hum Genet 54:535–543. [PMC free article] [PubMed] [Google Scholar]
- Assaf Y, Ben‐Bashat D, Chapman J, Peled S, Biton IE, Kafri M, Segev Y, Hendler T, Korczyn AD, Graif M, Cohen Y (2002): High b‐value q‐space analyzed diffusion‐weighted MRI: Application to multiple sclerosis. Magn Reson Med 47:115–126. [DOI] [PubMed] [Google Scholar]
- Assaf Y, Cohen Y (1998): Non‐monoexponential attenuation of water and N‐acetyl aspartate signals due to diffusion in brain tissue. J Magn Reson 131:69–85. [DOI] [PubMed] [Google Scholar]
- Basser PJ, Pierpaoli C (1996): Microstructural and physiological features of tissues elucidated by quantitative‐diffusion‐tensor MRI. J Magn Reson B 111:209–219. [DOI] [PubMed] [Google Scholar]
- Basser PJ, Pierpaoli C (2011): Microstructural and physiological features of tissues elucidated by quantitative‐diffusion‐tensor MRI. 1996. J Magn Reson 213:560–570. [DOI] [PubMed] [Google Scholar]
- Baumann PS, Cammoun L, Conus P, Do KQ, Marquet P, Meskaldji D, Meuli R, Thiran JP, Hagmann P (2012): High b‐value diffusion‐weighted imaging: a sensitive method to reveal white matter differences in schizophrenia. Psychiatry Res 201:144–151. [DOI] [PubMed] [Google Scholar]
- Behrens TE, Woolrich MW, Jenkinson M, Johansen‐Berg H, Nunes RG, Clare S, Matthews PM, Brady JM, Smith SM (2003): Characterization and propagation of uncertainty in diffusion‐weighted MR imaging. Magn Reson Med 50:1077–1088. [DOI] [PubMed] [Google Scholar]
- Billiet T, Vandenbulcke M, Madler B, Peeters R, Dhollander T, Zhang H, Deprez S, Van den Bergh BR, Sunaert S, Emsell L (2015): Age‐related microstructural differences quantified using myelin water imaging and advanced diffusion MRI. Neurobiol Aging 36:2107–2121. [DOI] [PubMed] [Google Scholar]
- Braskie MN, Ringman JM, Thompson PM (2011): Neuroimaging measures as endophenotypes in Alzheimer's disease. Int J Alzheimers Dis 2011:490140. [DOI] [PMC free article] [PubMed] [Google Scholar]
- Brouwer RM, Mandl RC, Peper JS, van Baal GC, Kahn RS, Boomsma DI, Hulshoff Pol HE (2010): Heritability of DTI and MTR in nine‐year‐old children. Neuroimage 53:1085–1092. [DOI] [PubMed] [Google Scholar]
- Chang YS, Owen JP, Pojman NJ, Thieu T, Bukshpun P, Wakahiro ML, Berman JI, Roberts TP, Nagarajan SS, Sherr EH, Mukherjee P (2015): White matter changes of neurite density and fiber orientation dispersion during human brain maturation. PLoS One 10:e0123656. [DOI] [PMC free article] [PubMed] [Google Scholar]
- Chiang MC, McMahon KL, de Zubicaray GI, Martin NG, Hickie I, Toga AW, Wright MJ, Thompson PM (2011): Genetics of white matter development: A DTI study of 705 twins and their siblings aged 12 to 29. Neuroimage 54:2308–2317. [DOI] [PMC free article] [PubMed] [Google Scholar]
- Clark CA, Hedehus M, Moseley ME (2002): In vivo mapping of the fast and slow diffusion tensors in human brain. Magn Reson Med 47:623–628. [DOI] [PubMed] [Google Scholar]
- DA Feinberg, S Moeller, SM Smith, E Auerbach, S Ramanna, M Gunther, MF Glasser, KL Miller, K Ugurbil, E Yacoub (2010): Multiplexed echo planar imaging for sub‐second whole brain FMRI and fast diffusion imaging. PLoS One 5. [DOI] [PMC free article] [PubMed] [Google Scholar]
- Glahn DC, Thompson PM, Blangero J (2007): Neuroimaging endophenotypes: Strategies for finding genes influencing brain structure and function. Hum Brain Mapp 28:488–501. [DOI] [PMC free article] [PubMed] [Google Scholar]
- Hasler G, Northoff G (2011): Discovering imaging endophenotypes for major depression. Mol Psychiatry 16:604–619. [DOI] [PubMed] [Google Scholar]
- Hwang SN, Chin CL, Wehrli FW, Hackney DB (2003): An image‐based finite difference model for simulating restricted diffusion. Magn Reson Med 50:373–382. [DOI] [PubMed] [Google Scholar]
- Jahanshad N, Kochunov PV, Sprooten E, Mandl RC, Nichols TE, Almasy L, Blangero J, Brouwer RM, Curran JE, de Zubicaray GI, Duggirala R, Fox PT, Hong LE, Landman BA, Martin NG, McMahon KL, Medland SE, Mitchell BD, Olvera RL, Peterson CP, Starr JM, Sussmann JE, Toga AW, Wardlaw JM, Wright MJ, Hulshoff Pol HE, Bastin ME, McIntosh AM, Deary IJ, Thompson PM, Glahn DC (2013): Multi‐site genetic analysis of diffusion images and voxelwise heritability analysis: A pilot project of the ENIGMA‐DTI working group. Neuroimage 81:455–469. [DOI] [PMC free article] [PubMed] [Google Scholar]
- Jelescu IO, Veraart J, Adisetiyo V, Milla SS, Novikov DS, Fieremans E (2014): One diffusion acquisition and different white matter models: How does microstructure change in human early development based on WMTI and NODDI? Neuroimage 107:242–256. [DOI] [PMC free article] [PubMed] [Google Scholar]
- Jones DK, Horsfield MA, Simmons A (1999): Optimal strategies for measuring diffusion in anisotropic systems by magnetic resonance imaging. Magn Reson Med 42:515–525. [PubMed] [Google Scholar]
- Kessler RC, Demler O, Frank RG, Olfson M, Pincus HA, Walters EE, Wang P, Wells KB, Zaslavsky AM (2005): Prevalence and treatment of mental disorders, 1990 to 2003. N Engl J Med 352:2515–2523. [DOI] [PMC free article] [PubMed] [Google Scholar]
- Kochunov P, Glahn DC, Lancaster JL, AM Winkler, S Smith, PM Thompson, L Almasy, R Duggirala, PT Fox, J Blangero (2010): Genetics of microstructure of cerebral white matter using diffusion tensor imaging. Neuroimage 53:1109–1116. [DOI] [PMC free article] [PubMed] [Google Scholar]
- Kochunov P, Glahn DC, Lancaster J, Thompson PM, Kochunov V, Rogers B, Fox P, Blangero J, Williamson DE (2011a): Fractional anisotropy of cerebral white matter and thickness of cortical gray matter across the lifespan. Neuroimage 58:41–49. [DOI] [PMC free article] [PubMed] [Google Scholar]
- Kochunov P, Glahn DC, Nichols TE, Winkler AM, Hong EL, Holcomb HH, Stein JL, Thompson PM, Curran JE, Carless MA, Olvera RL, Johnson MP, Cole SA, Kochunov V, Kent J, Blangero J (2011b): Genetic analysis of cortical thickness and fractional anisotropy of water diffusion in the brain. Front Neurosci 5:120. [DOI] [PMC free article] [PubMed] [Google Scholar]
- Kochunov P, Williamson DE, Lancaster J, Fox P, Cornell J, Blangero J, Glahn DC (2012): Fractional anisotropy of water diffusion in cerebral white matter across the lifespan. Neurobiol Aging 33:9–20. [DOI] [PMC free article] [PubMed] [Google Scholar]
- Kochunov P, Chiappelli J, Hong LE (2013): Permeability‐diffusivity modeling vs. fractional anisotropy on white matter integrity assessment and application in schizophrenia. Neuroimage 3:18–26. [DOI] [PMC free article] [PubMed] [Google Scholar]
- Kochunov P, Chiappelli J, Wright SN, Rowland LM, Patel B, Wijtenburg SA, Nugent K, McMahon RP, Carpenter WT, Muellerklein F, Sampath H, Hong LE (2014a): Multimodal white matter imaging to investigate reduced fractional anisotropy and its age‐related decline in schizophrenia. Psychiatry Res 223:148–156. [DOI] [PMC free article] [PubMed] [Google Scholar]
- Kochunov P, Jahanshad N, Sprooten E, Nichols TE, Mandl RC, Almasy L, Booth T, Brouwer RM, Curran JE, de Zubicaray GI, Dimitrova R, Duggirala R, Fox PT, Elliot Hong L, Landman BA, Lemaitre H, Lopez LM, Martin NG, McMahon KL, Mitchell BD, Olvera RL, Peterson CP, Starr JM, Sussmann JE, Toga AW, Wardlaw JM, Wright MJ, Wright SN, Bastin ME, McIntosh AM, Boomsma DI, Kahn RS, den Braber A, de Geus EJ, Deary IJ, Hulshoff Pol HE, Williamson DE, Blangero J, van ‘t Ent D, Thompson PM, Glahn DC (2014b): Multi‐site study of additive genetic effects on fractional anisotropy of cerebral white matter: Comparing meta and megaanalytical approaches for data pooling. Neuroimage 95:136–150. [DOI] [PMC free article] [PubMed] [Google Scholar]
- Kochunov P, Jahanshad N, Marcus D, Winkler A, Sprooten E, Nichols TE, Wright SN, Hong LE, Patel B, Behrens T, Jbabdi S, Andersson J, Lenglet C, Yacoub E, Moeller S, Auerbach E, Ugurbil K, Sotiropoulos SN, Brouwer RM, Landman B, Lemaitre H, den Braber A, Zwiers MP, Ritchie S, van Hulzen K, Almasy L, Curran J, deZubicaray GI, Duggirala R, Fox P, Martin NG, McMahon KL, Mitchell B, Olvera RL, Peterson C, Starr J, Sussmann J, Wardlaw J, Wright M, Boomsma DI, Kahn R, de Geus EJ, Williamson DE, Hariri A, van ‘t Ent D, Bastin ME, McIntosh A, Deary IJ, Hulshoff Pol HE, Blangero J, Thompson PM, Glahn DC, Van Essen DC (2015): Heritability of fractional anisotropy in human white matter: A comparison of Human Connectome Project and ENIGMA‐DTI data. Neuroimage 111:300–311. [DOI] [PMC free article] [PubMed] [Google Scholar]
- Lee AD, Lepore N, Brun C, Chou YY, Barysheva M, Chiang MC, Madsen SK, de Zubicaray GI, McMahon KL, Wright MJ, Toga AW, Thompson PM (2009): Tensor‐based analysis of genetic influences on brain integrity using DTI in 100 twins. Med Image Comput Assist Interv 12:967–974. [DOI] [PubMed] [Google Scholar]
- Lee W‐JPTI, O'Connell JR, Agarwala R, Schaffer AA (2010): PedHunter 2.0 and its usage to characterize the founder structure of the old order Amish of Lancaster County. BMC Med Genet 11:68. [DOI] [PMC free article] [PubMed] [Google Scholar]
- McGuire S, Sherman P, Profenna L, Grogan P, Sladky J, Brown A, Robinson A, Rowland L, Hong E, Patel B, Tate D, Kawano ES, Fox P, Kochunov P (2013a): White matter hyperintensities on MRI in high‐altitude U‐2 pilots. Neurology 81:729–735. [DOI] [PMC free article] [PubMed] [Google Scholar]
- McGuire SA, Sherman PM, Brown AC, Robinson AY, Tate DF, Fox PT, Kochunov PV (2013b): Hyperintense white matter lesions in 50 high‐altitude pilots with neurologic decompression sickness. Aviat Space Environ Med 83:1117–1122. [DOI] [PMC free article] [PubMed] [Google Scholar]
- McGuire SA, Sherman PM, Wijtenburg SA, Rowland LM, Grogan PM, Sladky JH, Robinson AY, Kochunov PV (2014): White matter hyperintensities and hypobaric exposure. Ann Neurol 76:719–726. [DOI] [PMC free article] [PubMed] [Google Scholar]
- Mitchell BDLW‐J, Tolea M, Shields K, Ashtorab Z, Madger LS, Ryan KA, Pollin TI, McArdle PF, Shuldiner AR, Schaffer AA (2012): Living the good life? Mortality and hospital utilization patters in the Lancaster County Amish. PLos One 7:e51560. [DOI] [PMC free article] [PubMed] [Google Scholar]
- S Moeller, E Yacoub, CA Olman, E Auerbach, J Strupp, N Harel, K Uǧurbil (2010): Multiband multislice GE‐EPI at 7 tesla, with 16‐fold acceleration using partial parallel imaging with application to high spatial and temporal whole‐brain fMRI. Magn Reson Med 63:1144–1153. [DOI] [PMC free article] [PubMed] [Google Scholar]
- Nazeri A, Chakravarty MM, Rotenberg DJ, Rajji TK, Rathi Y, Michailovich OV, Voineskos AN (2014): Functional consequences of neurite orientation dispersion and density in humans across the adult lifespan. J Neurosci 35:1753–1762. [DOI] [PMC free article] [PubMed] [Google Scholar]
- Schwarcz A, Bogner P, Meric P, Correze JL, Berente Z, Pal J, Gallyas F, Doczi T, Gillet B, Beloeil JC (2004): The existence of biexponential signal decay in magnetic resonance diffusion‐weighted imaging appears to be independent of compartmentalization. Magn Reson Med 51:278–285. [DOI] [PubMed] [Google Scholar]
- Stanisz GJ, Szafer A, Wright GA, Henkelman RM (1997): An analytical model of restricted diffusion in bovine optic nerve. Magn Reson Med 37:103–111. [DOI] [PubMed] [Google Scholar]
- Stokes AM, Wilson JW, Warren WS (2012): Characterization of restricted diffusion in uni‐ and multi‐lamellar vesicles using short distance iMQCs. J Magn Reson 223:31–40. [DOI] [PMC free article] [PubMed] [Google Scholar]
- Sukstanskii AL, Ackerman JJ, Yablonskiy DA (2003): Effects of barrier‐induced nuclear spin magnetization inhomogeneities on diffusion‐attenuated MR signal. Magn Reson Med 50:735–742. [DOI] [PMC free article] [PubMed] [Google Scholar]
- Sukstanskii AL, Yablonskiy DA, Ackerman JJ (2004): Effects of permeable boundaries on the diffusion‐attenuated MR signal: Insights from a one‐dimensional model. J Magn Reson 170:56–66. [DOI] [PubMed] [Google Scholar]
- Wu YC, Field AS, Duncan ID, Samsonov AA, Kondo Y, Tudorascu D, Alexander AL (2011a): High b‐value and diffusion tensor imaging in a canine model of dysmyelination and brain maturation. Neuroimage 58:829–837. [DOI] [PMC free article] [PubMed] [Google Scholar]
- Wu YC, Field AS, Whalen PJ, Alexander AL (2011b): Age‐ and gender‐related changes in the normal human brain using hybrid diffusion imaging (HYDI). Neuroimage 54:1840–1853. [DOI] [PMC free article] [PubMed] [Google Scholar]
- Yablonskiy DA, Bretthorst GL, Ackerman JJ (2003): Statistical model for diffusion attenuated MR signal. Magn Reson Med 50:664–669. [DOI] [PMC free article] [PubMed] [Google Scholar]
- Zhang H, Hubbard PL, Parker GJ, Alexander DC (2011): Axon diameter mapping in the presence of orientation dispersion with diffusion MRI. Neuroimage 56:1301–1315. [DOI] [PubMed] [Google Scholar]
- Zhang H, Schneider T, Wheeler‐Kingshott CA, Alexander DC (2012): NODDI: practical in vivo neurite orientation dispersion and density imaging of the human brain. Neuroimage 61:1000–1016. [DOI] [PubMed] [Google Scholar]
- Zhu J, Zhuo C, Qin W, Wang D, Ma X, Zhou Y, Yu C (2014): Performances of diffusion kurtosis imaging and diffusion tensor imaging in detecting white matter abnormality in schizophrenia. Neuroimage Clin 7:170–176. [DOI] [PMC free article] [PubMed] [Google Scholar]