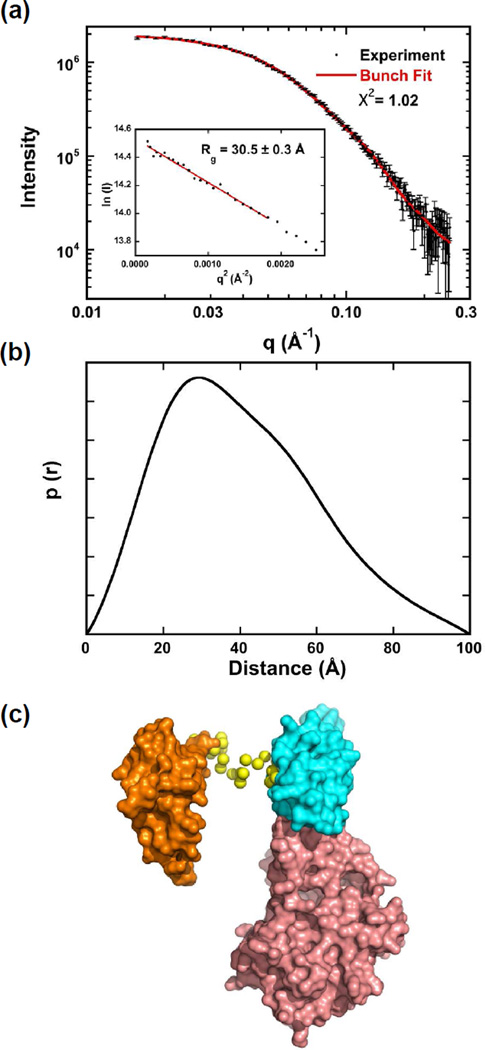
Figure 6.
SAXS analysis of PKRΔVB conformation. Data were collected at 4°C at a protein concentration of 5 mg/ml. (a) Scattering data (points) and BUNCH fit (solid red line). Inset: Guinier analysis yields Rg = 30.5 ± 0.3 Å. (b) p(r) distance distribution produced by transforming the data in part (a) using GNOM.23 (c) Structural model produced by BUNCH.28 The domains are shown in surface representation: dsRBD1 (orange), dsRBD2 (cyan) and kinase (salmon). The linker residues are depicted as yellow spheres.

