Abstract
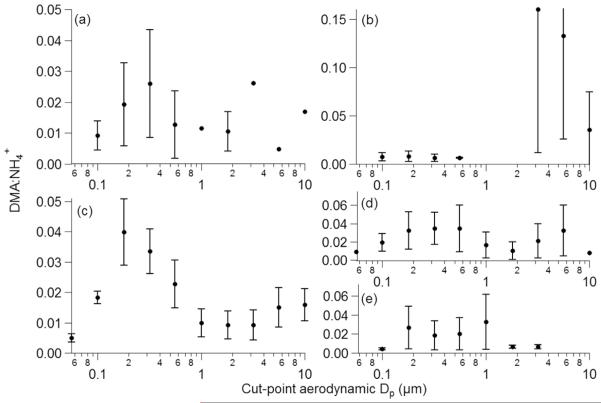
Aerosol and cloud water measurements of dimethylamine (DMA), the most abundant amine in this study, were conducted in semi-arid (Tucson, Arizona) and marine (Nucleation in California Experiment, NiCE; central coast of California) areas. In both regions, DMA exhibits a unimodal aerosol mass size distribution with a dominant peak between 0.18 and 0.56 μm. Particulate DMA concentrations increase as a function of marine biogenic emissions, sulfate, BVOC emissions, and aerosol-phase water. Such data supports biogenic sources of DMA, aminium salt formation, and partitioning of DMA to condensed phases. DMA concentrations exhibit positive correlations with various trace elements and most especially vanadium, which warrants additional investigation. Cloud water DMA levels are enhanced significantly during wildfire periods unlike particulate DMA levels, including in droplet residual particles, due to effective dissolution of DMA into cloud water and probably DMA volatilization after drop evaporation. DMA:NH+4 molar ratios peak between 0.18 and 1.0 μm depending on the site and time of year, suggesting that DMA competes better with NH3 in those sizes in terms of reactive uptake by particles.
Keywords: Aerosol, Amines, MOUDI, Cloud water, Marine, Biomass burning, Dimethylamine
1. Introduction
Alkyl amines (NR3), one of many classes of species comprising the complex organic fraction of ambient aerosol, play a pivotal role in aerosol growth processes (Silva and Prather, 2000; Moffet et al., 2008; Barsanti et al., 2009), impact radiative and hygroscopic properties of particles (Lavi et al., 2013), and pose negative health effects (Greim et al., 1998). Reported amine sources in the gas phase include animal husbandry operations, the ocean, industrial operations, biomass burning, vehicular traffic, waste incineration and sewage treatment, carbon capture and storage, tobacco smoke, and the food industry (Ge et al., 2011).
Understanding the sources, transformations, and fate of particulate amines warrants research as these species are more likely to enhance new particle formation than ammonia (NH3) (Kurten et al., 2008; Bzdek et al., 2010, 2011; Smith et al., 2010; Kirkby et al., 2011; Glasoe et al., 2015). For instance, dimethylamine (DMA) concentrations in the accumulation mode were 30 times higher during nucleation events in the boreal forest of Finland as compared to non-nucleation events (Makela et al., 2001). While NH3 typically is responsible for the subsequent neutralization owing to higher ambient mixing ratios (Kurten et al., 2008; Bzdek et al., 2010, 2011), and thus higher accumulation mode concentrations (VandenBoer et al., 2011), fine particle measurements have shown that amines accounted for up to 20% of organic mass during the wintertime in Utah (Silva et al., 2008), and reached up to 23% of measured ammonium mass concentration levels downwind of a major bovine source (Sorooshian et al., 2008). Amines have been shown to play a role in production of secondary organic aerosol (SOA) via acid-base chemistry with inorganic and organic acids to form amine salts (Angelino et al., 2001; Murphy et al., 2007) and via reactions with ozone (O3), the hydroxyl radical (OH), and the nitrate radical (Tang et al., 2013). Amines can partition from being gases in the atmosphere to condensed aqueous phases in the form of deliquesced particles (Chan and Chan, 2013) and cloud and fog drops (McGregor and Anastasio, 2001; Sellegri et al., 2005).
The most abundant amines in ambient aerosol tend to be low molecular weight aliphatic amines with carbon numbers less than six (Ge et al., 2011). Dimethylamine is of particular significance as it is one of, if not the most, abundant aliphatic amine in ambient particles (Muller et al., 2009; this study), in the gas phase (Hellen et al., 2014), in fog water (Wang et al., 2015), and in cloud water (this study). Dimethylamine is important for aerosol formation as it is less volatile than NH3 (vapor pressures of 203 kPa and 1003 kPa at 298.15 K, respectively). The goal of this work is to use field data of DMA in ambient particles and cloud water in marine and semi-arid regions to address the following: (i) mass size distribution of DMA; (ii) factors related to DMA concentrations; and (iii) the size-dependent molar ratio of DMA to ammonium.
2. Experimental methods
2.1. Tucson aerosol characterization observatory (TACO)
Aerosol composition measurements were conducted at TACO, which is on top of a building (30 m AGL, 720 m ASL; 32.2299°N, 110.9538°W) in inner city Tucson (metro population ~1 million; U.S. Census Bureau, 2011) on the campus of the University of Arizona. PM1.0 composition was measured between July 2012 and June 2013 using a single-stage filter sampler (24–72 h) with pre-baked 47 mm quartz fiber filters. Size-resolved aerosol composition was measured using two micro-orifice uniform deposit impactors (MOUDI, MSP Corporation; Marple et al., 1991) with aerodynamic cut-point diameters of 0.056, 0.1, 0.18, 0.32, 0.56, 1.0, 1.8, 3.2, 5.6, 10.0, and 18.0 μm. Teflon filters were used for MOUDI sampling (PTFE membrane, 2 μm pore, 46.2 mm, Whatman). MOUDI sample sets were collected between August 2013 and February 2015 with sampling details shown in Table 1.
Table 1.
Summary of sampling details for each MOUDI set collected at TACO and NiCE. TACO data are divided into three subsets of time to reflect different meteorological conditions. (+: Fire-influenced sets; RH: relative humidity, WVMR: water vapor mixing ratio, WS: wind speed, WD: wind direction, T: temperature).
| Sample set | Start date | End date | Total hours | RH (%) | WVMR (g kg−1) | WS (m s−1) | WD(°) | T (°C) |
|---|---|---|---|---|---|---|---|---|
| TACO 1 | 8/19/2013 | 8/23/2013 | 96 | 36 | 11.0 | 1.9 | 148 | 31 |
| TACO 2 | 8/26/2013 | 8/30/2013 | 96 | 52 | 14.0 | 1.7 | 150 | 29 |
| TACO 3 | 9/3/2013 | 9/7/2013 | 96 | 36 | 10.6 | 1.7 | 176 | 31 |
| TACO 4 | 9/9/2013 | 9/13/2013 | 96 | 51 | 12.3 | 2.5 | 151 | 27 |
| TACO 5 | 9/16/2013 | 9/20/2013 | 97 | 24 | 8.0 | 2.3 | 179 | 32 |
| TACO 6 | 5/27/2014 | 5/30/2014 | 24 | 20 | 5.1 | 1.8 | 178 | 28 |
| TACO 7 | 5/27/2014 | 5/30/2014 | 24 | 14 | 5.5 | 2.3 | 141 | 35 |
| TACO 8 | 5/31/2014 | 6/8/2014 | 24 | 28 | 4.6 | 0.7 | 204 | 28 |
| TACO 9 | 5/31/2014 | 6/8/2014 | 24 | 8 | 4.1 | 3.2 | 133 | 38 |
| TACO 10 | 6/2/2014 | 6/6/2014 | 30 | 11 | 3.0 | 0.7 | 209 | 29 |
| TACO 11 | 6/2/2014 | 6/6/2014 | 30 | 5 | 2.8 | 3.5 | 121 | 39 |
| TACO 12 | 2/2/2015 | 2/15/2015 | 168 | 36 | 5.1 | 2.2 | 184 | 19 |
| TACO 13 | 2/2/2015 | 2/16/2015 | 168 | 46 | 5.9 | 2.3 | 191 | 17 |
| NiCE 1 | 7/3/2013 | 7/9/2013 | 94 | 75 | 8.8 | 3.2 | 244 | 16 |
| NICE 2 | 7/3/2013 | 7/10/2013 | 63 | 87 | 8.6 | 1.5 | 176 | 14 |
| NiCE 3 | 7/10/2013 | 7/16/2013 | 105 | 78 | 8.6 | 3.0 | 253 | 15 |
| NiCE 4 | 7/10/2013 | 7/17/2013 | 63 | 88 | 8.5 | 1.3 | 210 | 13 |
| NiCE 5 | 7/17/2013 | 7/24/2013 | 103 | 82 | 9.1 | 2.9 | 259 | 15 |
| NiCE 6 | 7/17/2013 | 7/24/2013 | 63 | 93 | 9.0 | 1.2 | 226 | 13 |
| NiCE 7+ | 7/24/2013 | 7/31/2013 | 94 | 77 | 9.0 | 3.2 | 258 | 16 |
| NiCE 8+ | 7/24/2013 | 7/31/2013 | 63 | 89 | 8.9 | 1.3 | 211 | 14 |
| NiCE 9 | 7/31/2013 | 8/9/2013 | 131 | 79 | 8.8 | 3.3 | 253 | 15 |
| NiCE 10 | 7/31/2013 | 8/9/2013 | 81 | 89 | 8.9 | 2.1 | 219 | 14 |
The chemical analysis procedure for the PM1.0 and MOUDI samples was the same. Filters were cut in half to use one half for chemical speciation analysis and the other for storage. Filter halves and 10 mL of milli-Q water were put in glass vials that underwent sonication at 30 °C for 20 min. The aqueous extracts were then analyzed with inductively coupled plasma mass spectrometry (ICP-MS; Agilent 7700 Series) for elements and ion chromatography (IC; Thermo Scientific Dionex ICS – 2100 system) for anions and cations. The dual IC system includes AS11-HC (2 × 250 mm) and CS12A (2 × 250 mm) columns for anion and cation analysis, respectively, in addition to a 25-μL injection loop. Anion IC analysis was conducted with a 38-min multi-step gradient with potassium hydroxide eluent (2 mM–5 mM from 0 to 8 min, 5 mM to 10 mM from 8 to 20 min, 10 mM from 20 to 25 min, 10 mM–18.67 mM from 25 to 38 min). Cation IC analysis was conducted with a 38-min isocratic method with methanesulfonic acid eluent (10 mM), which was sufficient to resolve DMA without interferences from neighboring peaks. The limit of detection (LOD) DMA was equivalent to 1 ng m−3. LODs for other species are reported by Wang et al. (2014). Other amines were not detected above detection limits, or if they were like diethylamine (DEA), they were in the minority of samples and thus not discussed here. Of the 72 PM1.0 samples collected, 68 exhibited reportable DMA levels along with 142 of 253 MOUDI filters (combined between TACO and NiCE, which is introduced below).
To determine how meteorological and source factors are related to DMA, other datasets are used. Collocated data were obtained for temperature (T), relative humidity (RH), water vapor mixing ratio (WVMR), wind speed (WS), and wind direction (WD). As a representation of biogenic emissions, monthly values of the Normalized Difference Vegetation Index (NDVI) were obtained from the Moderate Resolution Imaging Spectroradiometer (MODIS) between July 2012 and June 2013 for the spatial area bounded by 32–33°N and 110–112°W. Modeled surface concentrations of isoprene and monoterpenes were adopted from Youn et al. (2013) for Tucson with spatial resolution of 1.9° latitude by 2.5° longitude.
2.2. Nucleation in California Experiment (NiCE)
The NiCE campaign, based out of Marina, California, included surface measurements and 23 research flights with the Center for Interdisciplinary Remotely-Piloted Aircraft Studies (CIRPAS) Twin Otter between July and August 2013. The study region was influenced at times by biomass burning emissions originating from wildfires near the California–Oregon border by the coast (Big Windy, Whiskey Complex, and Douglas Complex forest fires; Coggon et al., 2014). From the aircraft portion of the experiment, we focus on the cloud water measurements made using a Mohnen slotted-rod collector (Hegg and Hobbs, 1986). A total of 119 samples were collected during flights in polyethylene bottles that were subsequently analyzed for chemical composition using the IC and ICP-MS techniques mentioned above. Eighty seven of these samples exhibited reportable DMA concentrations. Further details about the collection, storage, and chemical analyses can be found elsewhere (Prabhakar et al., 2014a). Airborne PM1.0 composition measurements were obtained using a particle-into-liquid sampler (PILS; Sorooshian et al., 2006) coupled to ion chromatography, with measurements in cloud conducted downstream of a counterflow virtual impactor (CVI) to characterize droplet residual particle properties (Shingler et al., 2012). During NiCE, the CVI Dp,50 cutsize was approximately 11 μm.
Ten sets of MOUDI samples were collected at a surface site in Marina, ~5 km from the coastline (36.7° N, 121.8° W), between 4 July and 9 August 2013 (see Table 1 for details). The sampling and post-processing procedures were identical to those of the TACO MOUDI filters.
To complement the MOUDI measurements, meteorological data during NiCE were gathered from the Monterey Peninsula station (KMRY; 36.6° N, 121.8° W) from the Mesowest database (Horel et al., 2002). Averages of several meteorological variables were calculated for each MOUDI set (Table 1). Eight day averages of chlorophyll-a data derived from MODIS-Aqua (8-Day Global 4-km Product) are used as a proxy for ocean bio-productivity as a potential DMA source. The spatial area of the MODIS data (36–38° N/ 121–123° W) corresponds to the region encompassing the area over which three-day back-trajectories covered (Fig. S1).
3. Results and discussion
3.1. Meteorological conditions
Prior to discussing aerosol composition results, a summary of the average meteorological conditions coinciding with the TACO and NiCE measurements is provided. TACO data are divided into different groups based on the time of year to reflect different meteorological conditions. As the TACO PM1.0 data cover more months than the MOUDI data, the average conditions coinciding with the former are discussed here (Table 2), while conditions for the latter are in Table 1. The period between May and September is divided into two sub-periods (May–June = MJ; July–September = JAS) in Tucson to reflect the burst of moisture introduced during the Monsoon season (JAS). The average WVMR in JAS and MJ is 12.6 g kg−1 and 6.2 g kg−1, respectively, and the average RH (sensitive to T unlike WVMR) was more than two times higher in JAS. Ambient temperature remains similarly high during these five months (29.4 °C in JAS, 29.8 °C in MJ) in contrast to reduced values in November (N, 17.2 °C) and December–January (DJ, 9.6 °C). The N and DJ periods were characterized by lower WVMR (3.3–4.1 g kg−1) than the summer months. Wind directions (150°–162°) and speeds (1.7–3.2 m s−1) were generally similar during the months examined. Average conditions during NiCE were markedly different than those in Tucson with lower temperatures (14.5 °C) and consistently higher RH (83.7%). Winds during NiCE were predominantly westerly from the adjacent ocean at an average speed of 2.29 m s−1. The coastal region had persistent stratocumulus cloud cover during NiCE.
Table 2.
Summary of PM1.0 species mass concentrations and other relevant environmental parameters and chemical ratios for different periods of the year (MJ = May–June; JAS = July–September; N = November; DJ = December–January) in Tucson between July 2012 and June 2013. The chemical ratios are on a molar basis.
| MJ (n = 19) | JAS (n = 28) | N (n = 5) | DJ (n = 16) | |
|---|---|---|---|---|
| WVMR (g kg−1) | 6.2 | 12.6 | 4.1 | 3.3 |
| RH (%) | 22 | 51 | 35 | 46 |
| T (°C) | 29.8 | 29.4 | 17.2 | 9.6 |
| NDVI | 0.22 | 0.40 | 0.29 | 0.23 |
| WS (m s−1) | 3.2 | 2.3 | 1.7 | 2.3 |
| WD (°) | 150 | 160 | 158 | 162 |
| DMA (ng m−3) | 15.6 | 20.5 | 12.4 | 9.3 |
| (μg m−3) | 1.26 | 1.35 | 0.93 | 0.48 |
| (μg m−3) | 0.56 | 0.28 | 0.46 | 0.52 |
| (μg m−3) | 0.26 | 0.29 | 0.24 | 0.17 |
| MSA (ng m−3) | 8.83 | 4.86 | 2.66 | 1.94 |
| : | 1.10 | 1.20 | 1.38 | 1.88 |
| DMA: | 0.02 | 0.03 | 0.02 | 0.02 |
3.2. DMA mass size distributions
3.2.1. TACO (Tucson, Arizona)
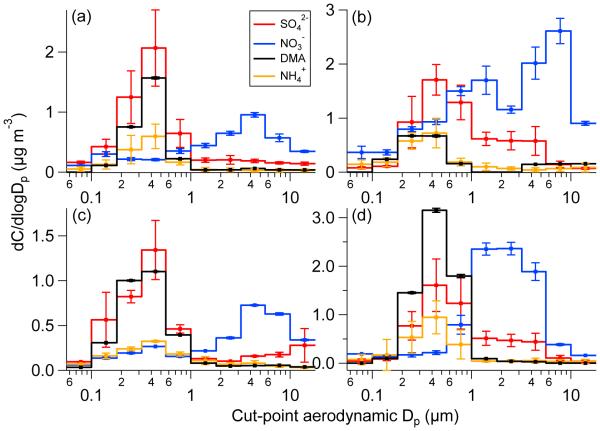
In Tucson, bulk DMA mass concentrations from the MOUDI were highest in February (15.6 ng m−3) followed by August–September (14.6 ng m−3), and May–June (11.7 ng m−3). The mass concentration of DMA in the submicrometer range (0.056–1 μm) accounted for 84% (May–June), 97% (August–September), and 90% (February) of its mass concentration across all sizes measured by the MOUDI. The August–September and February data reveal a unimodal distribution with a peak between 0.32 and 0.56 μm, while between May–June the DMA peak was broader between 0.18 and 0.56 μm (Fig. 1). Sulfate and ammonium consistently exhibited a peak between 0.32 and 0.56 μm suggesting that aminium salt formation with sulfate was likely. Size-resolved amine measurements in other regions (marine, urban, rural) have shown that alkyl amines are most abundant between 0.14 and 0.56 um (Facchini et al., 2008; Muller et al., 2009; VandenBoer et al., 2011, 2012). Amine nitrate salts are not likely since nitrate consistently exhibited its mode above 1 μm due to probable reactions of gas-phase nitric acid with surfaces of coarse particles such as dust (Sorooshian et al., 2013).
Fig. 1.
Speciated aerosol mass size distributions: (a) average of TACO sets 1–5, (b) average of TACO sets 6–11, (c) average of TACO sets 12–13, and (d) average of NiCE sets 1–10. Dimethylamine and nitrate concentrations are multiplied by 50 and 5, respectively. Error bars in panels a, b, and d represent one standard deviation and those in panel c are the range as there were only two sets.
3.2.2. NiCE (California coast)
During NiCE, bulk DMA mass concentrations ranged from 2.3 to 70.3 ng m−3, with an average (33.0 ng m−3) over three times as high as that in TACO. This may be due to the influence of ocean biological emissions as will be discussed subsequently. DMA mass was predominantly in the submicrometer range (average of 98%; range between 97 and 100%). DMA mass size distributions were similar to Tucson with a dominant peak between 0.32 and 0.56 μm. Sulfate and ammonium again exhibit similar distributions as DMA, with nitrate having a peak in the coarse mode owing to reaction of gaseous nitric acid on coarse particle surfaces, mainly sea salt (Prabhakar et al., 2014a).
Two MOUDI sets (NiCE 7/8 in Table 1) were impacted by transported wildfire plumes, with average transport time of the smoke plumes to the study site being 47 h (Fig. S1; Maudlin et al., 2015). The two fire sets exhibited significant concentration enhancements in biomass burning tracer species such as oxalate (>factor of 2) (Prabhakar et al., 2014a). While oxalate exhibits a marked change in its mass size distribution during the fire period, DMA exhibits a comparable average mass concentration (38 ng m−3 vs 32 ng m−3 for fire and non-fire periods, respectively), which is illustrated by the size-dependent mass ratio of oxalate:DMA (Fig. 2). Airborne PM1.0 measurements of DMA were below detection limits (8 ng m−3) above cloud near the source during the fire periods. The data indicate that biomass burning plumes during NiCE were not a source of particulate DMA in the study region.
Fig. 2.
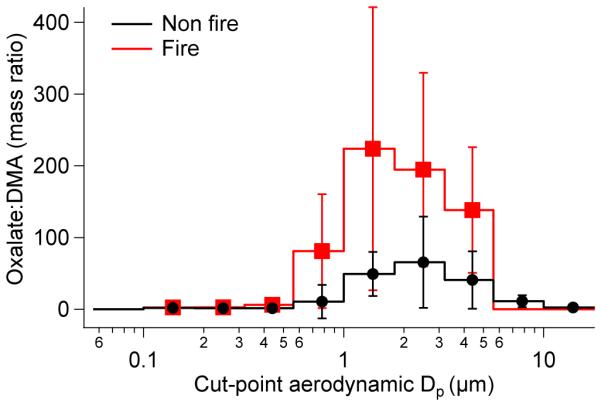
Mass concentration ratio of oxalate:DMA as a function of aerodynamic diameter for fire and non-fire periods during NiCE. Error bars represent one standard deviation for the non-fire sets and the range for the fire sets as there were only two of the latter.
3.3. Factors related to DMA
3.3.1. TACO
As the previous section showed that the majority of DMA mass resides in the submicrometer size range, this section examines year-long PM1.0 measurements obtained at TACO to identify what factors and/or sources may contribute to variability in DMA concentration. Table 2 reports temporal profiles of DMA and relevant parameters, while Table 3 shows how DMA is correlated to numerous parameters in different times of the year (only statistically significant correlations at 95% using a Student's t-test are discussed below).
Table 3.
Correlation coefficients between PM1.0 constituents and meteorological parameters in Tucson for different months between July 2012 and June 2013. Bold values are statistically significant at 95% confidence using a two-tailed Student's t-test.
| All (n = 68) | MJ (n = 19) | JAS (n = 28) | N (n = 5) | DJ (n = 16) | ||
|---|---|---|---|---|---|---|
| Meteorological | Temperature | 0.51 | 0.32 | 0.21 | −0.13 | 0.11 |
| RH | 0.02 | −0.05 | −0.32 | −0.15 | −0.28 | |
| WVMR | 0.45 | 0.27 | −0.37 | −0.47 | −0.08 | |
| PM1.0 | Sulfate | 0.92 | 0.83 | 0.96 | 0.95 | 0.72 |
| Ammonium | 0.91 | 0.91 | 0.91 | 0.98 | 0.82 | |
| Ni | 0.55 | 0.49 | 0.28 | 0.61 | −0.14 | |
| Oxalate | 0.54 | 0.40 | 0.34 | 0.67 | 0.08 | |
| V | 0.52 | 0.68 | 0.69 | 0.96 | 0.47 | |
| Pb | 0.48 | −0.03 | 0.57 | 0.27 | 0.09 | |
| Cu | 0.48 | 0.22 | 0.14 | 0.46 | −0.14 | |
| MSA | 0.42 | 0.69 | 0.60 | 0.29 | 0.12 | |
| Fe | 0.19 | −0.03 | 0.51 | 0.38 | −0.06 | |
| Zn | 0.19 | 0.08 | −0.03 | 0.19 | −0.08 | |
| K | −0.19 | 0.38 | 0.15 | −0.07 | 0.12 | |
| Nitrate | −0.14 | 0.17 | 0.43 | 0.65 | 0.22 | |
| Si | 0.03 | −0.17 | 0.35 | 0.93 | −0.06 |
Annual cumulative statistics show that DMA exhibits its highest mass concentration between July–September (20.5 ± 8.6 ng m−3) followed by May–June (15.6 ± 4.2 ng m−3), November (12.4 ± 3.4 ng m−3), and December–January (9.3 ± 2.7 ng m−3); only the difference of means between November and May–June is statistically insignificant at the 95% confidence level using a two-sample t-test. The molar ratio of DMA to ammonium is similar in the months examined (0.02–0.03) indicating little temporal change in the competitive uptake between DMA and NH3 to the aerosol phase. DMA exhibits positive correlations with both temperature and WVMR for the entire time period, but not in the three individual subsets of months owing likely to the limited range of values. A number of factors coincide with periods of high T and WVMR in Tucson that can promote DMA formation including more available sulfate for salt formation, stronger BVOC emissions (Makela et al., 2001), and more aerosol-phase water to promote equilibrium partitioning (Youn et al., 2013). These factors likely outweigh the volatilization of particulate amines with increasing temperature (You et al., 2014).
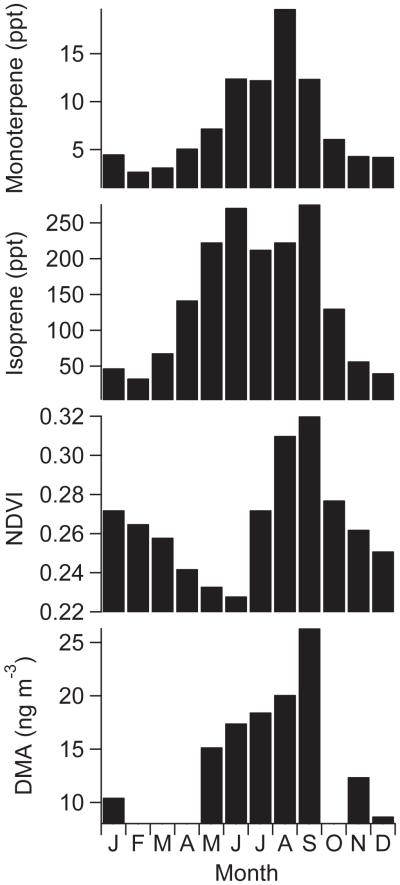
Values of BVOC proxies (NDVI, isoprene, monoterpenes) follow the same general monthly trend of DMA (Fig. 3) with peaks between June–September. The trend of these parameters is in sharp contrast to anthropogenic tracers in the gas (CO, NO2) and aerosol (EC) phases that are highest in winter months and lowest between May and August (Youn et al., 2013; Crosbie et al., 2015). These results suggest that DMA is more influenced by biogenic sources than anthropogenic sources in Tucson during months with higher temperatures, humidity, and plant growth. Reported DMA sources suggest that decay processes (e.g., animal waste, fish processing, landfills) are important (e.g., Ge et al., 2011); however, our data motivates examination as to the relative emissions during growth processes, such as with plant growth, versus decay processes.
Fig. 3.
Monthly averages of PM1.0 DMA and BVOC emission proxies (NDVI, monoterpenes, and isoprene) for Tucson.
Among PM1.0 constituents, the strongest correlations for DMA during the full year are with sulfate (r = 0.92) and ammonium (r = 0.91), with strong correlations in the three subsets of months (r ≥ 0.72). As expected based on the differing MOUDI size distributions, DMA has no significant correlation with nitrate likely because the sulfate is not neutralized (i.e., ammonium-to-sulfate molar ratios < 2; Table 2), so nitrate lacks thermodynamic preference to form salts (Seinfeld and Pandis, 2012). It is very likely that sulfate concentrations are driving DMA formation, and that the high correlation with ammonium is due to their similar pathways to the aerosol phase via partitioning. The positive relationship between sulfate and DMA, irrespective of ammonium concentrations, is reinforced by how DMA exhibits an exponential decline versus the ammonium:sulfate molar ratio with leveling off near ratios of two (Fig. 4). Periods of higher sulfate concentration (and lowest ammonium:sulfate ratios) are in the summer months that coincide with more aerosol-phase water (Youn et al., 2013), which promotes gas-to-aerosol partitioning of DMA.
Fig. 4.
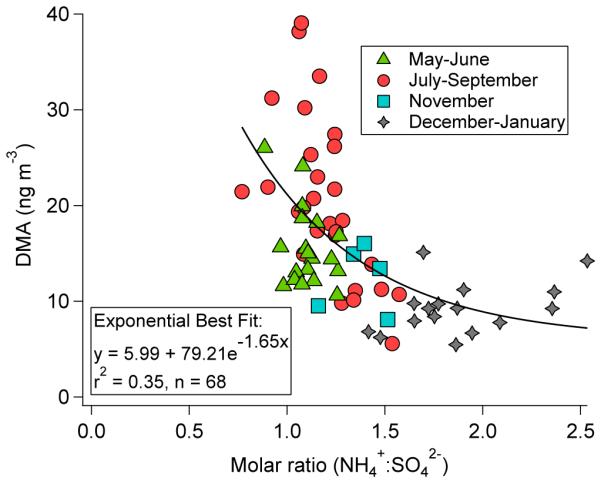
Relationship between DMA mass concentration and the ammonium-to-sulfate molar ratio using Tucson PM1.0 data between July 2012 and June 2013. The curve represents an exponential fit.
DMA is positively correlated with a marine tracer species, MSA, derived predominantly from ocean-emitted dimethylsulfide (DMS), which was highest and lowest in the May–June and December–January periods, respectively. This is due to air mass sources changing in the different seasons, with more influence from the ocean in May–June and the least influence in the wintertime (Sorooshian et al., 2013).
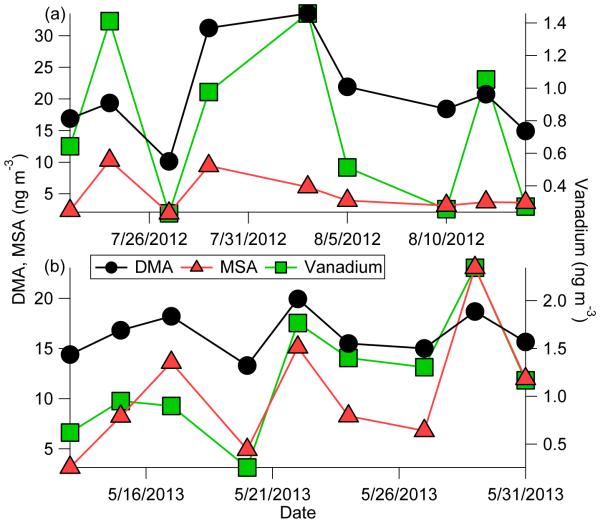
Of the various trace elements examined, those stemming mainly from combustion and smelting in the region (V, Pb, Cu, Ni; Prabhakar et al., 2014b) exhibit positive correlations with DMA (r ≥ 0.48). Vanadium in particular exhibits significant correlations with DMA in the most subset of months of any parameter in Table 3 after sulfate and ammonium. There is no documented correlation between V and DMA to our knowledge. A plausible explanation is that particles coated with sulfate provide a condensation sink for DMA, with sulfate's precursor SO2 being co-emitted with V (Prabhakar et al., 2014b). Two case events in Tucson are profiled in Fig. 5 between May–August when sampled air masses are most influenced by air masses originating over the Pacific Ocean with enhanced MSA levels. During these two multi-week events, there is considerable variability in DMA that is matched remarkably well by both V and MSA. No other species in the IC or ICP-MS dataset followed DMA as well as V and MSA, including both ammonium and sulfate. Correlation coefficients (r) between DMA and other species for Cases 1/2 are as follows (n = 9 for both cases): MSA (0.59/0.82), V (0.69/0.72), sulfate (−0.26/−0.32), nitrate (−0.58/0.68), ammonium (−0.33/−0.32). The observations point to the need for additional examination of the relationship between V and DMA. Such a relationship is especially relevant for coastal regions where DMA is emitted from the ocean (e.g., Facchini et al., 2008) and has great potential to interact with ship emissions that are enriched with V (Coggon et al., 2012; Visschedijk et al., 2013).
Fig. 5.
Mass concentration time series of various species in Tucson PM1.0 during two case studies.
3.3.2. NiCE
Cloud water samples were collected off the coast of California extending west over 200 km from the coastline at different altitudes between (0.1–1 km) in the stratocumulus cloud deck. For the subsequent discussion, cloud water data are filtered into four categories to compare different emissions sources following the method of Prabhakar et al. (2014a): ‘ship’ (fresh ship plume influence), ‘fire’ (biomass burning plumes entrained into clouds), ‘low Cl− marine’ (background conditions with no plume influence), ‘high Cl− marine’ (no plume influence but high sea salt levels based on Cl− exceeding 11 μg m−3).
In decreasing order of air-equivalent concentration, DMA exhibited average levels of 37 ng m−3 (fire), 19 ng m−3 (high Cl− marine), 11 ng m−3 (ship), and 7 ng m−3 (low Cl− marine). A potential explanation as to why DMA is enhanced during biomass burning periods in cloud water and not in the MOUDI samples is that it partitions effectively into cloud water but volatilizes upon droplet evaporation much like nitrate does. For example, nitrate also exhibited similar bulk mass concentrations in the fire (0.49 μg m−3) and non-fire (0.44 μg m−3) MOUDI sets, but exhibited marked enhancements in the cloud water fire samples (4.0 μg m−3) versus other categories (≤2.6 μg m−3). Further support of DMA partitioning back to the gas phase upon drop evaporation is that the PILS did not detect DMA above a LOD of 8 ng m−3 either above or below cloud, or downstream of the CVI inlet in cloud, which heats the sampled air stream to 30–35 °C. A simple back-of-the-envelope calculation of particulate DMA concentrations expected from gas-to-particle partitioning with gaseous DMA concentrations obtained via Henry's Law and aqueous DMA concentrations in cloud water yielded values less than the PILS detection limit.
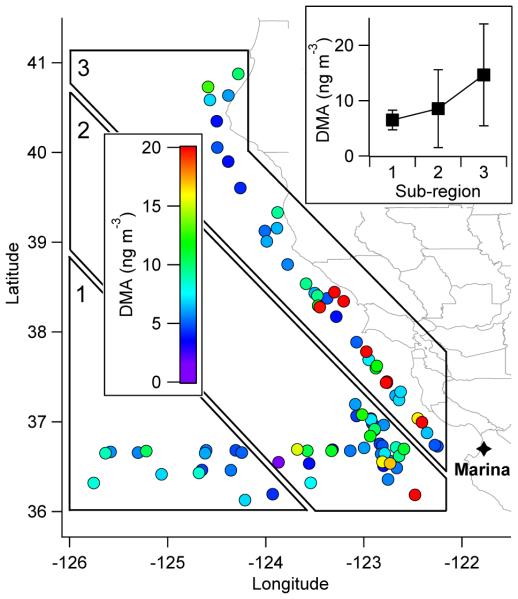
Cloud water data were spatially divided into three sub-regions (Fig. 6) that are meant to be parallel to the coast to identify if longitudinal gradients in emitted species exist due to more up-welling of nutrients closest to the coast. Higher DMA concentrations were observed closest to the coastline (~15 ng m−3) where upwelling is expected to be most vigorous (and thus marine organism emissions), whereas the sub-regions farther away exhibited decreasingly lower levels of about ~9 ng m−3 and ~7 ng m−3. MSA's levels were highest farthest away from the coast (0.24 μg m−3) rather than in the middle (0.17 μg m−3) or closest to the coast (0.22 μg m−3). MSA likely does not follow the same spatial trend as DMA since diatoms, which are weak DMS emitters, are predominant in upwelling regions as has been documented before for the study region (Sorooshian et al., 2009). Ammonium followed the spatial trend of DMA, with the lowest concentrations farthest from the coast (0.08 μg m−3) and increasing as a function of distance to the coastline (0.14 μg m−3 in the middle and 0.18 μg m−3 at the coast); the correlation between ammonium and DMA was r = 0.83, which was the highest with DMA among water-soluble species detected by IC except three organic acids (oxalate, r = 0.83; adipate, r = 0.85; glutarate, r = 0.88) that coincidentally form salts with amines (Williams et al., 2010).
Fig. 6.
Spatial map of cloud water DMA air-equivalent mass concentration in the NiCE study region. The inset plot shows the average (± standard deviation) DMA concentration as a function of the distance to the coast as represented by the three subregions. Sub-regions 1, 2, and 3 have 15, 34, and 36 data points, respectively.
The cloud water data suggest that marine organism emissions are influential in driving higher concentrations closer to the coastline. Recent work has suggested that remotely-sensed chlorophyll-a, a measure of phytoplankton biomass, is not a suitable proxy for organic carbon enrichment in emitted sea spray aerosol (Quinn et al., 2014) and thus marine organic matter. Here we evaluate the relationship between chlorophyll-a and coastal particulate concentrations of MSA and DMA. During NiCE, remotely-sensed chlorophyll-a levels exhibited a gradual build-up until the end of July, after which it decreased (Fig. 7). Both DMA and MSA concentrations, based on submicrometer sizes from the NiCE MOUDI sets, also tended to follow this pattern with the caveat that the time durations of the MOUDI and satellite data are slightly offset. The DMA data exhibit a positive association with chlorophyll-a, albeit with limited datapoints, motivating additional investigation as to whether this remotely-sensed parameter is related to organonitrate components in marine aerosol. Longer-term measurements to examine the time-lag between high chlorophyll-a levels and enhancement of organics in marine aerosol in this and other coastal regions would be helpful (Rinaldi et al., 2013).
Fig. 7.
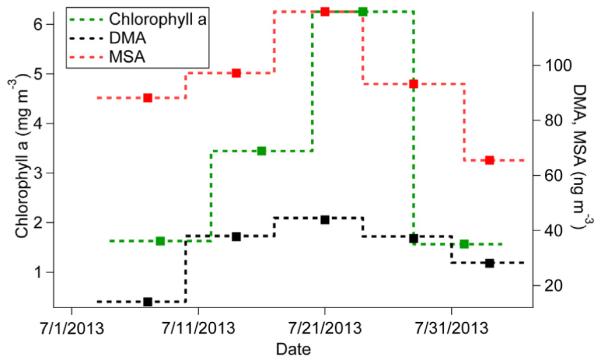
MOUDI submicrometer (0.056–1 μm) DMA and MSA mass concentrations during NiCE (each point is the average of two sets in a particular time period) and 8-day average chlorophyll-a concentrations from MODIS.
3.4. Competition between DMA and ammonium
Previous work has examined the size dependence of amines relative to ammonium as a way to gain insight about formation processes, including the competitive uptake of DMA and NH3, and the relative abundance of amine and ammonia (VandenBoer et al., 2011). The MOUDI datasets from TACO and NiCE exhibit DMA:NH+4 molar ratios between 0 and 0.04, with the exception of two outliers at TACO between 3.2 and 10 mm (0.13–0.16) owing to such small concentrations (Fig. 8). These values are consistent with those reported in the fine mode (0.005–0.2) for urban and rural continental air masses near Toronto (VandenBoer et al., 2011), although the latter study accounted for multiple alkyl amines in the numerator of the ratio. In contrast to that study, the DMA:NH+4 ratio did not peak at the smallest sizes in our data but rather in various stages between 0.18 and 1.0 mm depending on the site and time of year. The molar ratio generally increased again in the coarse sizes (Fig. 8a–d). Amines are thought to outcompete NH3 due to thermodynamics at the smallest sizes, with NH3 outcompeting amines at larger sizes due to higher relative ambient concentrations (VandenBoer et al., 2011). TACO and NiCE results indicate that the ratios are sufficiently low that NH3 is clearly dominant in concentration but the intriguing size-dependent behavior in contrast to previous measurements warrants more examination of factors governing the competition between NH3 and DMA as a function of particle size.
Fig. 8.
Size dependence of the average molar ratio of DMA to ammonium based on MOUDI data from (a) TACO 1–5, (b) TACO 6–11, (c) TACO 12–13, (d) NiCE non-fire sets, and (e) NiCE fire sets. The error bars are standard deviations or the range for panel (c) and the three largest stages of panel (b) due to only two sets of points.
4. Conclusions
This study presents aerosol and cloud water measurements of DMA, the most abundant amine in our dataset, in semi-arid and coastal regions. The main results are as follows in order of the issues listed at the end of Section 1:
(i) DMA exhibits a unimodal mass size distribution with a dominant peak between 0.18 and 0.56 μm, which is nearly identical to sulfate and ammonium and in contrast to nitrate, indicative of aminium salt formation with acidic sulfate.
(ii) Particulate DMA concentrations increase coincident with the enhancements in marine biogenic emissions, sulfate, BVOC emissions, and aerosol-phase water. This supports aminium salt formation and DMA partitioning to condensed phases. DMA concentrations intriguingly exhibit a strong correlation with vanadium, which warrants additional investigation. Cloud water DMA levels are enhanced significantly during wildfire periods, unlike in particles (including droplet residual particles) due to effective dissolution of DMA into cloud water with likely DMA volatilization during drop evaporation.
(iii) DMA:NH+4 molar ratios peak between 0.18 and 1.0 μm depending on the site and time of year, indicating that DMA competes better with NH3 in those sizes in terms of reactive uptake by particles. The molar ratios generally ranged between 0 and 0.04.
Supplementary Material
HIGHLIGHTS.
DMA exhibits peak mass concentrations between 0.18 and 0.56 μm.
DMA:NH+4 molar ratios generally peak between 0.18 and 1.0 μm (up to 0.04).
DMA correlates with BVOCs, sulfate, aerosol water, and marine emissions.
Wildfires enhance DMA levels in cloud water via dissolution in drops.
DMA correlates with vanadium in PM1.0 in a populated semi-arid region.
Acknowledgments
This work was funded by ONR grants N00014-11-1-0783, N00014-10-1-0200, and N00014-10-1-0811, in addition to Grant 2 P42 ES04940–11 from the National Institute of Environmental Health Sciences (NIEHS) Superfund Research Program, NIH.
Footnotes
Appendix A. Supplementary data
Supplementary data related to this article can be found at http://dx.doi.org/10.1016/j.atmosenv.2015.09.061.
References
- Angelino S, Suess DT, Prather KA. Formation of aerosol particles from reactions of secondary and tertiary alkylamines: characterization by aerosol time-of-flight mass spectrometry. Environ. Sci. Technol. 2001;35:3130–3138. doi: 10.1021/es0015444. [DOI] [PubMed] [Google Scholar]
- Barsanti KC, McMurry PH, Smith JN. The potential contribution of organic salts to new particle growth. Atmos. Chem. Phys. 2009;9:2949–2957. [Google Scholar]
- Bzdek BR, Ridge DP, Johnston MV. Amine exchange into ammonium bisulfate and ammonium nitrate nuclei. Atmos. Chem. Phys. 2010;10:3495–3503. [Google Scholar]
- Bzdek BR, Ridge DP, Johnston MV. Reactivity of methanesulfonic acid salt clusters relevant to marine air. J. Geophys. Res. 2011:116. [Google Scholar]
- Chan LP, Chan CK. Role of the aerosol phase state in ammonia/amines exchange reactions. Environ. Sci. Technol. 2013;47:5755–5762. doi: 10.1021/es4004685. [DOI] [PubMed] [Google Scholar]
- Coggon MM, Sorooshian A, Wang Z, Metcalf AR, Frossard AA, Lin JJ, Craven JS, Nenes A, Jonsson HH, Russell LM, Flagan RC, Seinfeld JH. Ship impacts on the marine atmosphere: insights into the contribution of shipping emissions to the properties of marine aerosol and clouds. Atmos. Chem. Phys. 2012;12:8439–8458. [Google Scholar]
- Coggon MM, Sorooshian A, Wang Z, Craven JS, Metcalf AR, Lin JJ, Nenes A, Jonsson HH, Flagan RC, Seinfeld JH. Observations of continental biogenic impacts on marine aerosol and clouds off the coast of California. J. Geophys. Res. 2014;119:6724–6748. [Google Scholar]
- Crosbie E, Youn J-S, Balch B, Wonaschuetz A, Shingler T, Wang Z, Conant WC, Betterton EA, Sorooshian A. On the competition among aerosol number, size and composition in predicting CCN variability: a multiannual field study in an urbanized desert. Atmos. Chem. Phys. 2015;15:6943–6958. doi: 10.5194/acp-15-6943-2015. http://dx.doi.org/10.5194/acp-15-6943-2015. [DOI] [PMC free article] [PubMed] [Google Scholar]
- Facchini MC, Decesari S, Rinaldi M, Carbone C, Finessi E, Mircea M, Fuzzi S, Moretti F, Tagliavini E, Ceburnis D, O'Dowd CD. Important source of marine secondary organic aerosol from biogenic amines. Environ. Sci. Technol. 2008;42:9116–9121. doi: 10.1021/es8018385. [DOI] [PubMed] [Google Scholar]
- Ge XL, Wexler AS, Clegg SL. Atmospheric amines e part I. A review. Atmos. Environ. 2011;45:524–546. [Google Scholar]
- Glasoe WA, Volz K, Panta B, Freshour N, Bachman R, Hanson DR, McMurry PH, Jen C. Sulfuric acid nucleation: an experimental study of the effect of seven bases. J. Geophys. Res. 2015;120:1933–1950. [Google Scholar]
- Greim H, Bury D, Klimisch HJ, Oeben-Negele M, Zeigler-Skylakakis Z. Toxicity of aliphatic amines: structure-activity relationship. Chemosphere. 1998;36:271–295. doi: 10.1016/s0045-6535(97)00365-2. [DOI] [PubMed] [Google Scholar]
- Hegg DA, Hobbs PV. Sulfate and nitrate chemistry in cumuliform clouds. Atmos. Environ. 1986;20:901–909. [Google Scholar]
- Hellen H, Kieloaho AJ, Hakola H. Gas-phase alkyl amines in urban air; comparison with a boreal forest site and importance for local atmospheric chemistry. Atmos. Environ. 2014;94:192–197. [Google Scholar]
- Horel J, Splitt M, Dunn L, Pechmann J, White B, Ciliberti C, Lazarus S, Slemmer J, Zaff D, Burks J. Mesowest: cooperative mesonets in the western United States. B. Am. Meteorol. Soc. 2002;83:211–225. [Google Scholar]
- Kirkby J, Curtius J, Almeida J, Dunne E, Duplissy J, Ehrhart S, Franchin A, Gagne S, Ickes L, Kurten A, Kupc A, Metzger A, Riccobono F, Rondo L, Schobesberger S, Tsagkogeorgas G, Wimmer D, Amorim A, Bianchi F, Breitenlechner M, David A, Dommen J, Downard A, Ehn M, Flagan RC, Haider S, Hansel A, Hauser D, Jud W, Junninen H, Kreissl F, Kvashin A, Laaksonen A, Lehtipalo K, Lima J, Lovejoy ER, Makhmutov V, Mathot S, Mikkila J, Minginette P, Mogo S, Nieminen T, Onnela A, Pereira P, Petaja T, Schnitzhofer R, Seinfeld JH, Sipila M, Stozhkov Y, Stratmann F, Tome A, Vanhanen J, Viisanen Y, Vrtala A, Wagner PE, Walther H, Weingartner E, Wex H, Winkler PM, Carslaw KS, Worsnop DR, Baltensperger U, Kulmala M. Role of sulphuric acid, ammonia and galactic cosmic rays in atmospheric aerosol nucleation. Nature. 2011;476:429–U477. doi: 10.1038/nature10343. [DOI] [PubMed] [Google Scholar]
- Kurten T, Loukonen V, Vehkamaki H, Kulmala M. Amines are likely to enhance neutral and ion-induced sulfuric acid-water nucleation in the atmosphere more effectively than ammonia. Atmos. Chem. Phys. 2008;8:4095–4103. [Google Scholar]
- Lavi A, Bluvshtein N, Segre E, Segev L, Flores M, Rudich Y. Thermochemical, cloud condensation nucleation ability, and optical properties of alkyl aminium sulfate aerosols. J. Phys. Chem. C. 2013;117:22412–22421. [Google Scholar]
- Makela JM, Yli-Koivisto S, Hiltunen V, Seidl W, Swietlicki E, Teinila K, Sillanpaa M, Koponen IK, Paatero J, Rosman K, Hameri K. Chemical composition of aerosol during particle formation events in boreal forest. Tellus B. 2001;53:380–393. [Google Scholar]
- Marple VA, Rubow KL, Behm SM. A microorifice uniform Deposit impactor (MOUDI) e description, calibration, and use. Aerosol Sci. Tech. 1991;14:434–446. [Google Scholar]
- Maudlin LC, Wang Z, Jonsson HH, Sorooshian A. Impact of wildfires on size-resolved aerosol composition at a coastal California site. Atmos. Environ. 2015;119:59e68. http://dx.doi.org/10.1016/j.atmosenv.2015.08.039. [Google Scholar]
- McGregor KG, Anastasio C. Chemistry of fog waters in California's Central Valley: 2. Photochemical transformations of amino acids and alkyl amines. Atmos. Environ. 2001;35:1091–1104. [Google Scholar]
- Moffet RC, de Foy B, Molina LT, Molina MJ, Prather KA. Measurement of ambient aerosols in northern Mexico City by single particle mass spectrometry. Atmos. Chem. Phys. 2008;8:4499–4516. [Google Scholar]
- Muller C, Iinuma Y, Karstensen J, van Pinxteren D, Lehmann S, Gnauk T, Herrmann H. Seasonal variation of aliphatic amines in marine sub-micrometer particles at the Cape Verde islands. Atmos. Chem. Phys. 2009;9:9587–9597. [Google Scholar]
- Murphy SM, Sorooshian A, Kroll JH, Ng NL, Chhabra P, Tong C, Surratt JD, Knipping E, Flagan RC, Seinfeld JH. Secondary aerosol formation from atmospheric reactions of aliphatic amines. Atmos. Chem. Phys. 2007;7:2313–2337. [Google Scholar]
- Prabhakar G, Ervens B, Wang Z, Maudlin LC, Coggon MM, Jonsson HH, Seinfeld JH, Sorooshian A. Sources of nitrate in stratocumulus cloud water: airborne measurements during the 2011 E-PEACE and 2013 NiCE studies. Atmos. Environ. 2014a;97:166–173. [Google Scholar]
- Prabhakar G, Sorooshian A, Toffol E, Arellano AF, Betterton EA. Spatiotemporal distribution of airborne particulate metals and metalloids in a populated arid region. Atmos. Environ. 2014b;92:339–347. doi: 10.1016/j.atmosenv.2014.04.044. [DOI] [PMC free article] [PubMed] [Google Scholar]
- Quinn PK, Bates TS, Schulz KS, Coffman DJ, Frossard AA, Russell LM, Keene WC, Kieber DJ. Contribution of sea surface carbon pool to organic matter enrichment in sea spray aerosol. Nat. Geosci. 2014;7:228–232. [Google Scholar]
- Rinaldi M, Fuzzi S, Decesari S, Marullo S, Santoleri R, Provenzale A, von Hardenberg J, Ceburnis D, Vaishya A, O'Dowd CD, Facchini MC. Is chlorophyll-a the best surrogate for organic matter enrichment in submicron primary marine aerosol? J. Geophys. Res. 2013;118:4964–4973. [Google Scholar]
- Seinfeld JH, Pandis SN. Atmospheric Chemistry and Physics: from Air Pollution to Climate Change. John Wiley & Sons; 2012. [Google Scholar]
- Sellegri K, Hanke M, Umann B, Arnold F, Kulmala M. Measurements of organic gases during aerosol formation events in the boreal forest atmosphere during QUEST. Atmos. Chem. Phys. 2005;5:373–384. [Google Scholar]
- Shingler T, Dey S, Sorooshian A, Brechtel FJ, Wang Z, Metcalf A, Coggon M, Mulmenstadt J, Russell LM, Jonsson HH, Seinfeld JH. Characterisation and airborne deployment of a new counterflow virtual impactor inlet. Atmos. Meas. Tech. 2012;5:1259–1269. [Google Scholar]
- Silva PJ, Prather KA. Interpretation of mass spectra from organic compounds in aerosol time-of-flight mass spectrometry. Anal. Chem. 2000;72:3553–3562. doi: 10.1021/ac9910132. [DOI] [PubMed] [Google Scholar]
- Silva PJ, Erupe ME, Price D, Elias J, Malloy QGJ, Li Q, Warren B, Cocker DR. Trimethylamine as precursor to secondary organic aerosol formation via nitrate radical reaction in the atmosphere. Environ. Sci. Technol. 2008;42:4689–4696. doi: 10.1021/es703016v. [DOI] [PubMed] [Google Scholar]
- Smith JN, Barsanti KC, Friedli HR, Ehn M, Kulmala M, Collins DR, Scheckman JH, Williams BJ, McMurry PH. Observations of aminium salts in atmospheric nanoparticles and possible climatic implications. P. Natl. Acad. Sci. USA. 2010;107:6634–6639. doi: 10.1073/pnas.0912127107. [DOI] [PMC free article] [PubMed] [Google Scholar]
- Sorooshian A, Brechtel FJ, Ma YL, Weber RJ, Corless A, Flagan RC, Seinfeld JH. Modeling and characterization of a particle-into-liquid sampler (PILS) Aerosol Sci. Tech. 2006;40:396–409. [Google Scholar]
- Sorooshian A, Murphy SN, Hersey S, Gates H, Padro LT, Nenes A, Brechtel FJ, Jonsson H, Flagan RC, Seinfeld JH. Comprehensive airborne characterization of aerosol from a major bovine source. Atmos. Chem. Phys. 2008;8:5489–5520. [Google Scholar]
- Sorooshian A, Padro LT, Nenes A, Feingold G, McComiskey A, Hersey SP, Gates H, Jonsson HH, Miller SD, Stephens GL, Flagan RC, Seinfeld JH. On the link between ocean biota emissions, aerosol, and maritime clouds: airborne, ground, and satellite measurements off the coast of California. Glob. Biogeochem. Cy. 2009:23. [Google Scholar]
- Sorooshian A, Shingler T, Harpold A, Feagles CW, Meixner T, Brooks PD. Aerosol and precipitation chemistry in the southwestern United States: spatiotemporal trends and interrelationships. Atmos. Chem. Phys. 2013;13:7361–7379. doi: 10.5194/acp-13-7361-2013. [DOI] [PMC free article] [PubMed] [Google Scholar]
- Tang XC, Price D, Praske E, Lee SA, Shattuck MA, Purvis-Roberts K, Silva PJ, Asa-Awuku A, Cocker DR. NO3 radical, OH radical and O3-initiated secondary aerosol formation from aliphatic amines. Atmos. Environ. 2013;72:105–112. [Google Scholar]
- VandenBoer TC, Petroff A, Markovic MZ, Murphy JG. Size distribution of alkyl amines in continental particulate matter and their online detection in the gas and particle phase. Atmos. Chem. Phys. 2011;11:4319–4332. [Google Scholar]
- VandenBoer TC, Markovic MZ, Petroff A, Czar MF, Borduas N, Murphy JG. Ion chromatographic separation and quantitation of alkyl methylamines and ethylamines in atmospheric gas and particulate matter using preconcentration and suppressed conductivity detection. J. Chromatogr. A. 2012;1252:74–83. doi: 10.1016/j.chroma.2012.06.062. [DOI] [PubMed] [Google Scholar]
- Visschedijk AHJ, van der Gon HACD, Hulskotte JHJ, Quass U. Anthropogenic vanadium emissions to air and ambient air concentrations in North-West Europe. E3S Web Conf. 2013:1. [Google Scholar]
- Wang Z, Sorooshian A, Prabhakar G, Coggon MM, Jonsson HH. Impact of emissions from shipping, land, and the ocean on stratocumulus cloud water elemental composition during the 2011 E-PEACE field campaign. Atmos. Environ. 2014;89:570–580. [Google Scholar]
- Wang YL, Zhang JW, Marcotte AR, Karl M, Dye C, Herckes P. Fog chemistry at three sites in Norway. Atmos. Res. 2015;151:72–81. [Google Scholar]
- Williams BJ, Goldstein AH, Kreisberg NM, Hering SV, Worsnop DR, Ulbrich IM, Docherty KS, Jimenez JL. Major components of atmospheric organic aerosol in southern California as determined by hourly measurements of source marker compounds. Atmos. Chem. Phys. 2010;10:11577e11603. [Google Scholar]
- You Y, Kanawade VP, de Gouw JA, Guenther AB, Madronich S, Sierra-Hernandez MR, Lawler M, Smith JN, Takahama S, Ruggeri G, Koss A, Olson K, Baumann K, Weber RJ, Nenes A, Guo H, Edgerton ES, Porcelli L, Brune WH, Goldstein AH, Lee SH. Atmospheric amines and ammonia measured with a chemical ionization mass spectrometer (CIMS) Atmos. Chem. Phys. 2014;14:12181–12194. [Google Scholar]
- Youn JS, Wang Z, Wonaschutz A, Arellano A, Betterton EA, Sorooshian A. Evidence of aqueous secondary organic aerosol formation from biogenic emissions in the. North Am. Sonoran Desert. Geophys. Res. Lett. 2013;40:3468–3472. doi: 10.1002/grl.50644. [DOI] [PMC free article] [PubMed] [Google Scholar]
Associated Data
This section collects any data citations, data availability statements, or supplementary materials included in this article.


