Abstract
Estuarine water column methylmercury (MeHg) is an important driver of mercury (Hg) bioaccumulation in pelagic organisms and thus it is necessary to understand the sources and processes affecting environmental levels of MeHg. Increases in water column MeHg concentrations can ultimately be transferred to fish consumed by humans, but despite this, the sources of MeHg to the estuarine water column are still poorly understood. Here we evaluate MeHg sources across 4 estuaries and 10 sampling sites and examine the distributions and partitioning of sediment and water column MeHg across a geographic range (Maine to New Jersey). Our study sites present a gradient in the concentrations of sediment, pore water and water column Hg species. Suspended particle MeHg ranged from below detection to 187 pmol g−1, dissolved MeHg from 0.01 to 0.68 pM, and sediment MeHg from 0.01 to 109 pmol g−1. Across multiple estuaries, dissolved MeHg correlated with Hg species in the water column, and sediment MeHg correlated with sediment total Hg (HgT). Water column MeHg did not correlate well with sediment Hg across estuaries, indicating that sediment concentrations were not a good predictor of water MeHg concentrations. This is an unexpected finding since it has been shown that MeHg production from inorganic Hg2+ within sediment is the primary source of MeHg to coastal waters. Additional sources of MeHg regulate water column MeHg levels in some of the shallow estuaries included in this study.
Keywords: mercury, dissolved, suspended particles, sediment, wetlands, tidal
Introduction
Methylmercury (MeHg) is a potent neurotoxin and much of the human exposure to MeHg comes from consumption of coastal and estuarine fish. The sources of MeHg to the base of estuarine food webs are still poorly constrained (Kwon et al., 2014; Hammerschmidt & Fitzgerald, 2006), but water column MeHg has been identified as an important driver of Hg bioaccumulation in estuarine pelagic organisms (Chen et al., 2014). MeHg production in sediment has been measured in many systems (e.g., Schartup et al., 2013; Hollweg et al., 2010, 2009; Hammerschmidt et al., 2008, 2004), and a number of studies have found a strong relationship between Hg in sediments and biota (e.g., Taylor et al., 2012; Gehrke et al., 2011), suggesting the importance of sediment MeHg production in driving bioaccumulation into biota. However, active MeHg production in sediment is not always predictive of water column MeHg concentrations. Chen et al. (2014) found that MeHg concentrations in water column particulate material, but not in sediments, were predictive of MeHg concentrations in fish across estuaries. Even in systems with contaminated sediment, Chen et al. found that transfer of MeHg into estuarine food webs may be driven by the efficiency of processes that determine MeHg input and bioavailability in the water column rather than by the rate of MeHg production in the sediment.
Most studies have focused on MeHg relationships in a single estuarine system such as Chesapeake Bay, New York/New Jersey Harbor (NY/NJ Harbor) or Long Island Sound (LIS) (e.g., Hollweg et al. 2010, 2009; Balcom et al., 2008, 2004; Hammerschmidt et al., 2008, 2004; Mason et al., 1999). These studies examined relationships among Hg species in either the water column or sediment, but studies that report relationships between water column and sediment Hg (e.g., Gosnell et al., 2015-submitted; Sunderland et al., 2010; Heyes et al., 2004) are rare. Only a few studies have taken a multi-estuary approach (e.g., Chen et al., 2014; Schartup et al., 2014, 2013) to look at MeHg sources in estuarine areas. The multi-estuary approach allows for identification of predictive relationships for MeHg that apply across a broad geographic range in both the water column and sediment.
To assess the role of sediment MeHg concentration and production on water column MeHg levels, we sampled intensively at 10 sites in 4 estuaries extending from Maine to New Jersey in July and August of 2009. Potential sources and pathways of MeHg transfer to the water column were examined using the relationships among water column and sediment MeHg concentrations across estuaries.
Methods
Sampling sites
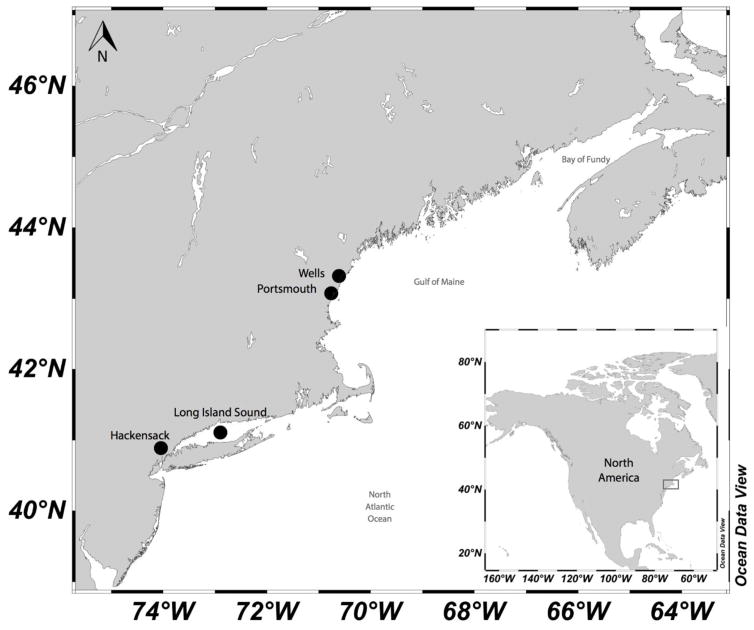
Ten sites in four estuaries with contrasting sediment and water characteristics were sampled on the East Coast of the U.S. (Figure 1). The sites are described by Schartup et al. (2014), and detail maps showing sampling locations are presented in the supporting information (Figure S1). Drakes Rd (WD), Harbor Rd (WH) and Mile Rd (WM) were sampled in July 2009 and are located near the relatively pristine Wells National Estuarine Research Reserve (ME, Webhannet Estuary, Gulf of Maine). Jackson Estuarine Laboratory (JEL), Barberry Rd (BB) and Portsmouth Naval Shipyard (PNS), located in the industrialized Great Bay near Portsmouth (NH), were sampled in August 2009. Eastern (E) and the more anthropogenically impacted western (W) Long Island Sound were sampled in August 2009. Berrys Creek (BC) and Mill Creek (MC) sampled in July 2009 are tidal tributaries of the Hackensack River (Hackensack Meadowlands, NJ), which discharges to NY/NJ Harbor. Sediment in the area of these NJ creeks is known to be contaminated with Hg from many years of heavy industrial and residential development including the operation of an Hg recovery plant.
Figure 1.
Estuarine locations sampled during July and August of 2009.
Sediment sampling
Sediment was collected by hand using acid-cleaned polycarbonate coring tubes, and sediment grab samples were collected directly into zip-lock bags. Coring tubes with overlying water were capped and sealed immediately after sediment collection to preserve ambient oxygen conditions and stored upright (out of direct sunlight) until processed on the day of collection. Subsections (2 cm) from 0 to 10 cm were frozen in acid-washed, screw cap plastic cups. Core sectioning for pore water collection was done inside a nitrogen filled glove bag to maintain low-oxygen conditions. Sediment subsections (2 cm) were centrifuged and pore water was extracted by vacuum filtration using acid-washed Nalgene plastic filter units (0.22-μm filters). At each site, pore water from separate cores was pooled for each 2 cm depth interval. Aliquots of pore water were stored frozen in Teflon bottles. Analyses included HgT and MeHg in sediment and pore water and organic content as loss on ignition (LOI). Sediment grab samples were analyzed for HgT and LOI.
Water column sampling
Water samples for Hg species were collected from an inflatable boat using trace-metal clean techniques. Surface water samples were collected directly into 2L Teflon bottles. Deep water (3–4 m) was collected using a Teflon-lined GO-FLO sampling bottle, transferred to Teflon bottles in the field, and stored in double zip-bags inside iced coolers. Water for mercury speciation analysis and ancillary parameters was filtered within 12 hours after collection using acid-washed Nalgene plastic vacuum filtration units (0.45 μm quartz fiber filters) inside a laminar flow hood. Filtrate was acidified (0.5% trace metal grade HCl) and refrigerated, and particulate filters were frozen inside acid-washed plastic petri dishes. Analyses included dissolved and particulate HgT and MeHg, total suspended solids (TSS) and nitrates (NO2 + NO3).
Mercury analyses
HgT was measured in both filtered and particle fractions using cold vapor atomic fluorescence spectrometry (CVAFS). Analytical methods for Hg analysis in these phases are detailed elsewhere (Bloom & Fitzgerald, 1988; Bloom & Crecelius, 1983; Fitzgerald & Gill, 1979). In brief, 50–100 mL aliquots of filtered (0.45 μm) water were digested chemically with bromine monochloride (BrCl) and subsequently pre-reduced with hydroxylamine hydrochloride (NH2OH·HCl). Sample Hg was reduced to Hg0 with stannous chloride (SnCl2) in a sparging vessel, purged with nitrogen, and trapped using dual-stage gold-amalgamation. The results were calibrated against an Hg0 standard and an aqueous Hg standard traceable to NIST. Particulate HgT was determined by acid leaching material on quartz fiber filters with 4N HNO3 (Hammerschmidt and Fitzgerald, 2001) and analyzed as described above. Sediment samples were freeze-dried and analyzed for HgT using a Milestone DMA80 pyrolytic analyzer (U.S. EPA, 1998). Sample results were corrected for field and preparation blanks as appropriate. The average relative percent difference (RPD) for preparation and analytical duplicates ranged from 9 to 13 for water column samples, and aqueous standard recoveries averaged 101%. The average RPD was 8 for sediment analytical duplicates, and sediment standard reference material recoveries (NRCC PACS-2 & MESS-2) averaged 100%. HgT method detection limits (MDLs) were 0.26 pM for water analyses, 1.4 pM for particulate analyses, and 0.09 nmol g−1 for sediment analyses.
MeHg in 0.45 μm filtered water, particulate matter, and sediment was determined by purge and trap (tenax) gas chromatographic CVAFS following ethylation (Tseng et al., 2004; Hammerschmidt and Fitzgerald, 2001). MeHg was separated from the sample matrix by distillation with dilute sulfuric acid (H2SO4) and potassium chloride (KCl) prior to ethylation. MeHg results were calibrated with an aqueous standard solution traceable to NIST. Sample results were corrected for field and preparation blanks as appropriate. Water column distillation spike recoveries ranged from 83 to 105%, aqueous standard recoveries ranged from 95 to 97%, and distillation duplicates averaged 28 RPD. Sediment sample averages were 114% for distillation spike recoveries, 97% for aqueous standard recoveries, and 7 RPD for distillation duplicates. MDLs were 0.05 pM for water analyses, 0.12 pM for particulate analyses, and 0.02 pmol g−1 for sediment analyses.
Ancillary measurements and data analysis
Ambient water temperature, salinity and dissolved oxygen were measured in situ at each site using a water quality instrument (sonde). Total suspended solids (TSS) and dissolved nitrate + nitrite (NO2 & NO3) were analyzed using standard methods (APHA, 1995; Parsons et al., 1984). Sediment loss-on-ignition (LOI; a proxy for organic matter content) was measured by combustion at 550°C overnight, and partition coefficients (Kd [L kg−1]) were calculated as [solid]/[dissolved]. Data were analyzed with parametric linear regressions using Sigma Stat software (Systat Software, Inc.), and were log transformed as needed to meet the assumptions of the test.
Results and Discussion
Methylmercury concentrations and trends in water across estuaries
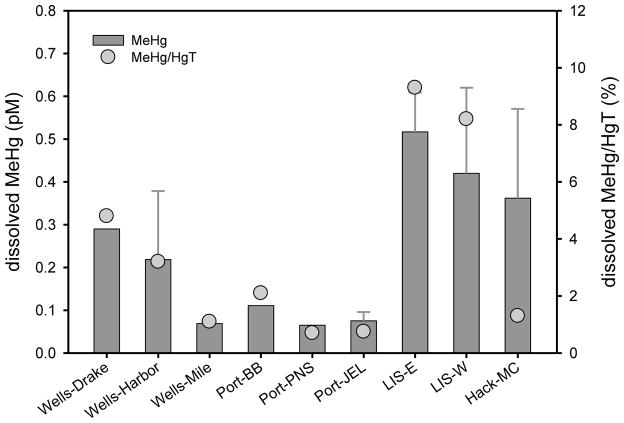
Dissolved MeHg concentrations were relatively high (0.01 to 0.68 pM) among estuaries in the Northeast U.S., somewhat elevated at Wells, and highest in LIS and Hackensack (MC; Figure 2, Table S1). Dissolved MeHg was higher than seasonal levels reported for NY/NJ Harbor (0.04 to 0.22 pM; Balcom et al., 2008), but similar to the elevated MeHg concentrations measured in the Hudson River estuarine turbidity maximum (ETM; 0.05 to 0.8 pM; Heyes et al., 2004), and the Delaware River ETM (0.02 to 1.0 pM; Gosnell et al., 2015-submitted). The ETM is the region near the mouth of rivers where there is enhanced sediment resuspension due to tidal and river action, and where sediment inputs of dissolved and particulate MeHg may be important. The proportion of dissolved HgT as MeHg (%MeHg) was the highest for LIS (3.0 to 18%; Figure 2, Table S1) among sites in the current study (all sampled in July or August), which was higher than values reported for the Hudson ETM (0.4 to 1.4% in June; with some higher values of 31% and 42% in February; Heyes at al., 2004), but less than for the Delaware ETM (10 to 29% in July; Gosnell et al., 2015-submitted). At sites with bottom water measurements, the surface to bottom dissolved MeHg concentration ratio was variable.
Figure 2.
July and August 2009 mean dissolved surface and deep (sites with error bars) water column methylmercury (MeHg; ±SD; n = 1–6; no error bars when n = 1 or 2) and %MeHg (MeHg/HgT) at each sampling site arranged from north to south along the Atlantic coastline (LIS MeHg from Schartup et al., 2015).
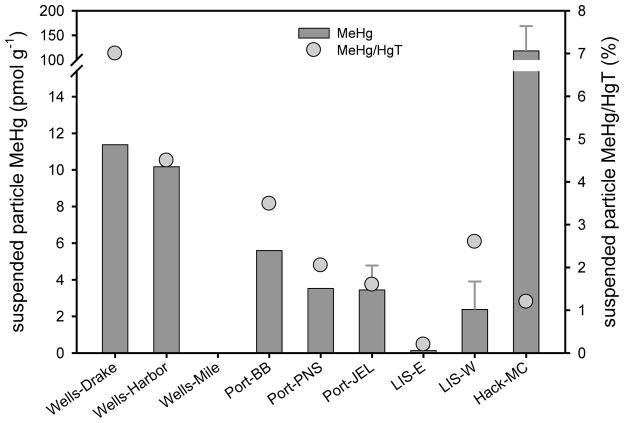
Suspended particle MeHg concentrations vary greatly within systems. In past studies, data from NY/NJ Harbor (2.0 to 48 pmol g−1; Balcom et al., 2008), the Delaware River ETM (1.1 to 23 pmol g−1; Gosnell et al., 2015-submitted) and bottom water in the Hudson River ETM (4.0 to 18 pmol g−1; Heyes et al., 2004) confirm that there is high seasonal variability in particulate MeHg (up to a factor of 20) within a system. In San Francisco Bay, Conaway et al. (2003) also found seasonal variability in particulate MeHg (0.5 to 15 pmol g−1), with the highest concentrations at low TSS (<5 mg L−1) and chlorophyll (Chl) a, and concentrations similar to those in sediment during periods of high TSS (>100 mg L−1). This suggests that the concentrations of MeHg on suspended particles are relatively transient and reflect short-term (e.g., tidal, storm events) changes in sources, production and degradation of MeHg within the system. Overall, suspended particle MeHg concentrations measured in the current study (below detection to 187 pmol g−1; Figure 3, Table S1) overlap the ranges given above for other systems. Average suspended particle MeHg concentrations decreased going from Wells to LIS (north to south) and were elevated (118 ± 50.2 pmol g−1; mean ± SD) at Hackensack (MC). Suspended particle %MeHg was highest at Wells (4.5 to 7%), reflecting a trend of a higher fraction as MeHg at the more pristine locations. Suspended particle MeHg concentrations increased with depth in LIS. Other than LIS, the sites sampled were relatively shallow (Table S1), and suspended particle MeHg was often as high in surface waters as in bottom waters, suggesting that the water column at these locations was well-mixed.
Figure 3.
July and August 2009 mean water column surface and deep (sites with error bars) suspended particle MeHg (±SD; n = 1–6; no error bars when n = 1 or 2) and %MeHg (MeHg/HgT) at each sampling site arranged from north to south along the Atlantic coastline (LIS MeHg from Schartup et al., 2015).
The range in suspended particle MeHg concentrations at the various locations likely reflects the composition and source of the particulate material. If TSS represents mostly resuspended sediment, then suspended particle MeHg concentrations should reflect those of the sediment. However, if the TSS is mostly phytoplankton and other microbial organisms, then the suspended particle MeHg concentration would most likely be different than that of the sediment (i.e., bioconcentration). Mason et al. (2012) compiled seston MeHg concentrations for a number of coastal environments and found that values ranged up to 50 pmol g−1 (converted from wet weight assuming 95% water) for locations without high local Hg contamination. This suggests that the range in water column suspended particle MeHg concentrations found in the current study may be determined by both sediment and water column sources. This idea is discussed further below.
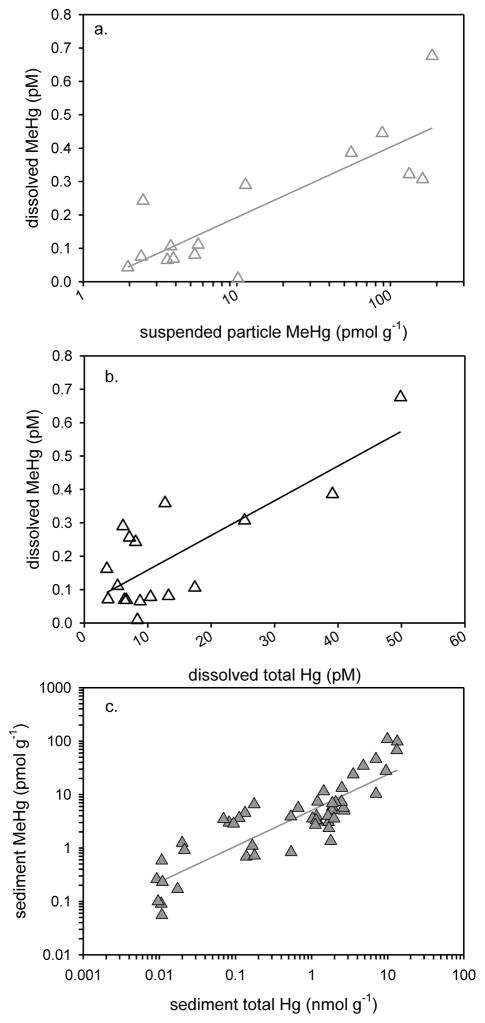
The results of the current study show significant relationships for MeHg with other variables in the water column across multiple estuaries. In 2009, there were significant positive relationships between dissolved and suspended particle MeHg (r2=0.650, P<0.0001, n=20, Figure 4a), between dissolved MeHg and dissolved HgT (r2=0.598, P<0.001, n=22, Figure 4b) and between suspended particle MeHg and HgT (r2=0.793, P<0.0001, n=21) in the water column. These relationships hold up over a broad geographic range, and are useful for predicting in which estuaries dissolved and suspended particle MeHg levels will be elevated based on HgT measurements. Although comparison was made among the shallow water estuaries, we did not include water column parameters from the deeper water LIS system. Controls on water column processes appear to be different in these deeper waters, and water column MeHg data from LIS are not plotted in Figure 4. The dissolved MeHg in LIS (surface and at depth) was nearly as high as in the Hudson River and Delaware River ETM regions studied by others, and did not correlate with other water column Hg concentrations in LIS.
Figure 4.
July and August 2009 water column and sediment samples from Wells (ME), Portsmouth (NH), LIS (CT-NY) and Hackensack R. (NJ) assessed by linear regression: a. water column (surface & deep; 3–4 m) dissolved MeHg plotted against suspended particle MeHg (r2=0.650, P<0.0001, n=20, MeHg pM = 0.104 + (0.0024 * MeHg pmol g−1)), b. water column (surface & deep) dissolved MeHg plotted against dissolved total mercury (HgT) (r2=0.598, P<0.001, n=22, MeHg pM = 0.054 + (0.010 * HgT pM)), and c. sediment MeHg (0–6 cm) plotted against sediment HgT (r2=0.778, P<0.001, n=51, MeHg pmol g−1 = − 2.151 + (6.203 *HgT nmol g−1)). Each point is an individual sample and regression lines are plotted. LIS water column MeHg not included (see text for explanation).
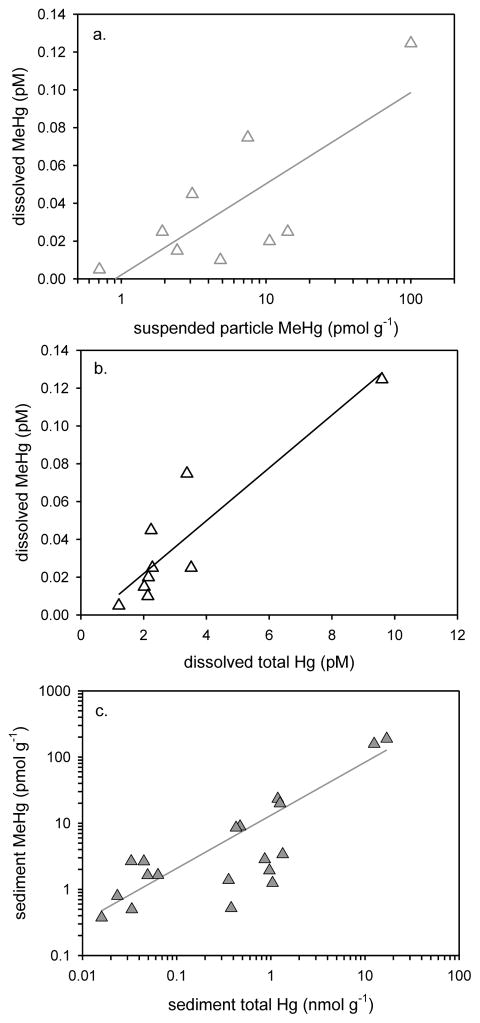
Significant relationships between MeHg and HgT in the water column were also found across East Coast estuaries by Chen et al. (2014). For ten estuaries overlapping the geographic range sampled in 2009, significant water column relationships were found between dissolved and suspended particle MeHg (r2=0.674, P<0.004, n = 9) and between dissolved MeHg and HgT (r2=0.795, P<0.0008, n = 9) for samples collected in 2008 (Figures 5a & 5b; dissolved MeHg data not available for one estuary). For the 2008 study, water column filtered MeHg concentrations ranged over about an order of magnitude (0.005 to 0.13 pM), which was less than in the current study (0.01 to 0.68 pM), and over two orders of magnitude for particulate concentrations (0.71 to 100 pmol g−1), with the highest concentrations near the Hackensack River (Chen et al., 2014). The suspended particle MeHg concentration at Wells in 2008 (0.71 pmol g−1) was much lower than in the current study (10.2 to 11.4 pmol g−1). This may reflect the spatial and temporal variability typical for estuarine MeHg concentrations, or may be the result of the limited number of water samples collected in 2008.
Figure 5.
Water column and sediment samples collected from 10 estuarine sites in July and August 2008 (Chen et al, 2014) assessed by linear regression: a. surface water dissolved MeHg plotted against suspended particle MeHg (r2=0.674, P<0.004, n = 9, MeHg pM = 0.022 + (0.001 * MeHg pmol g−1)), b. surface water dissolved MeHg plotted against dissolved HgT (r2=0.795, P<0.0008, n = 9, MeHg pM = −0.006 + (0.014 * HgT pM)), and c. sediment (0–4 cm) MeHg plotted against sediment HgT (r2 = 0.983, P<0.0001, n = 19, MeHg pmol g−1 = −0.747 + (11.63 * HgT nmol g−1)). Each point is an individual sample and regression lines are plotted.
Many studies have looked at trends in water column and sediment MeHg concentrations within a single ecosystem or over a small spatial scale. Relatively few studies have looked at trends in MeHg concentrations across multiple estuaries, but these studies have contributed new insight into relationships among MeHg and other parameters. Schartup et al. (2013) examined the importance of sediment organic matter on Hg methylation over a broad geographic and Hg contamination range (i.e., the same sampling sites as in the current study), and found some unexpected relationships. Most importantly, the highest MeHg production rates were found in estuaries with more contaminated, organic-rich sediment, which was contrary to the proposed paradigm that high organic content sediment has low methylation rates (i.e., Hammerschmidt & Fitzgerald, 2004). In their multi-estuary study, Chen et al. (2014) measured MeHg concentrations in estuarine sediment, water and biota at 10 sites that covered a broad range of human and land impacts within the Northeast U.S. Across these estuaries there were significant positive relationships between MeHg and HgT in the water column and sediment, as well as between pelagic fish MeHg concentrations and water column particulate MeHg, but sediment MeHg concentrations were only predictive of concentrations of MeHg in infaunal worms.
In summary, dissolved MeHg concentrations and %MeHg were elevated in LIS as compared to the other sites in this study, and exceeded only in East Coast ETM regions studied by others. Suspended particle MeHg levels were variable in the current study, suggesting varying sources of particulate material to the water column, but comparable to those found in other East Coast estuaries, with the exception of elevated concentrations at MC (Hackensack). Among the estuarine sites sampled in the current study, and those sampled by Chen et al. (2014) in 2008, significant positive relationships were found between water column dissolved and suspended particle MeHg, and between water column dissolved MeHg and HgT. These relationships hold up over a broad range of human and land impacts, and are useful for predicting in which estuaries dissolved and suspended particle MeHg levels will be elevated.
Methylmercury concentrations and trends in sediment across estuaries
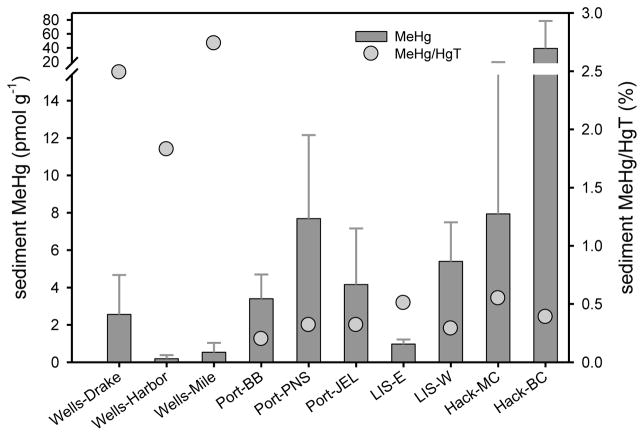
The ranges in sediment (0.01 to 110 pmol g−1; 0–10 cm; Figure 6, Table S2) and pore water (0.11 to 13.0 pM) MeHg concentrations among sites in 2009 were larger than found for other East Coast estuaries. Sediment MeHg concentrations generally showed an increasing trend going from Wells to Hackensack (north to south). The sites in the current study were chosen to range in sediment total Hg from a low, relatively pristine location (Wells; Table S3) to a known highly contaminated location (BC near the Hackensack River). However, if the BC site (1.5 to 110 pmol MeHg g−1) is excluded, the range of MeHg concentrations in the current study overlaps the range of mean MeHg values for the NY/NJ Harbor region (3 to 36 pmol g−1; Hammerschmidt et al., 2008), the Hudson River ETM (3.0 to 15 pmol g−1; Heyes et al., 2004), LIS (1.0 to 16 pmol g−1; Hammerschmidt & Fitzgerald, 2004) and San Francisco Bay (0.5 to 15 pmol g−1; Conaway et al., 2003). Sediment MeHg concentrations were lowest at Wells in the current study (0.01 to 6.5 pmol g−1), although the %MeHg was high (0.2 to 6.2%) relative to other sites sampled (Table S2). The sediment MeHg concentration range at Wells is similar to the range of mean MeHg values for Chesapeake Bay (0.5 to 5.0 pmol g1; Mason et al., 1999; Hollweg et al., 2009) and the Delaware River ETM (0.9 to 6.4 pmol g−1; Gosnell et al., 2015-submitted).
Figure 6.
July and August 2009 mean sediment MeHg (±SD; 0–10 cm; n = 5–10) and %MeHg (MeHg/HgT) at each sampling site arranged from north to south along the Atlantic coastline.
There was a significant positive relationship between sediment MeHg and HgT (r2=0.778, P<0.001, n=51) across the estuaries sampled in 2009 (Figure 4c). This relationship is ubiquitous and has been shown by many others (e.g., Schartup et al., 2013; Hollweg et al., 2009; Hammerscmhidt et al. 2008, 2004). Relationships for sediment organic matter (%LOI) with sediment HgT (r2=0.897, P<0.001, n=17) and MeHg (r2=0.902, P<0.001, n=15) were linear only among the Wells sites in the current study (Figure S3), although organic matter has been shown to largely control the distribution of sediment HgT and MeHg in other East Coast estuaries (e.g., Chen et al., 2014; Hollweg et al., 2010; Hammerschmidt et al., 2008; Hammerschmidt & Fitzgerald, 2004). As was the case for samples collected in 2009, Chen et al. (2014) found that sediment MeHg was significantly related to HgT (r2=0.983, P<0.0001; Figure 5c). Sediment from the ten sites sampled in 2008 ranged over two orders of magnitude in MeHg concentration (0.2 to 190 pmol g−1), which was somewhat larger than the range among sites in 2009 (0.01 to 110 pmol g−1).
In summary, sediment MeHg concentrations and %MeHg fell within the range of values for other East Coast estuaries, but were elevated in the highly contaminated sediment at BC (Hackensack). Significant positive relationships were found between sediment MeHg and HgT in the current study, and by Chen et al (2014) for sites sampled in 2008.
Suspended particle and sediment MeHg across estuaries
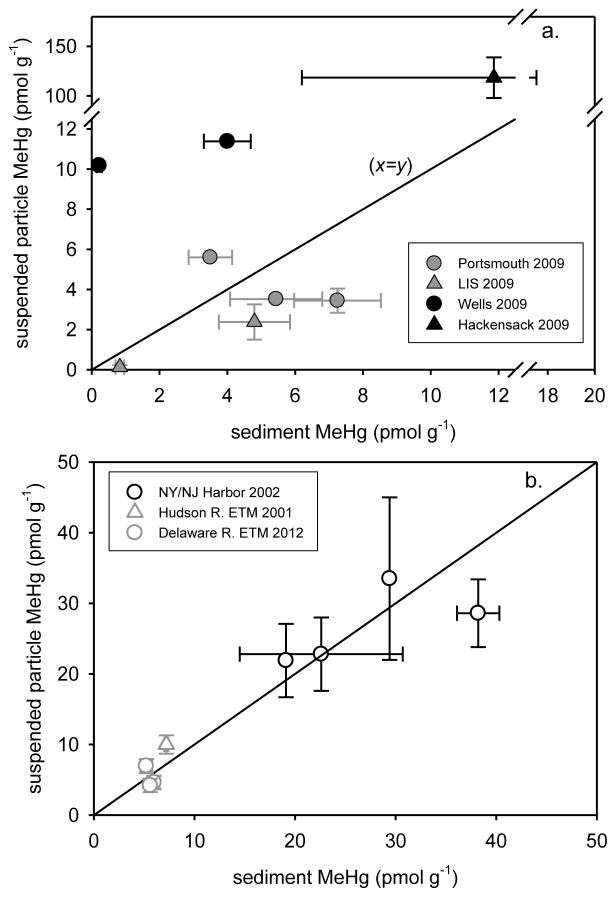
In general, suspended particle MeHg (surface & bottom water; 3–4 m) did not correlate with sediment MeHg (0–6 cm) across estuaries at sites sampled in 2009 (Figure 7a). Similarly, across sites in San Francisco Bay there was no correlation between sediment MeHg and water column particulate or dissolved MeHg, suggesting that sediment was not the major source of MeHg to the water column of the Bay (Conaway et al., 2003), although Gehrke et al. (2011) found that fish isotopes reflected sediment in the Bay. The suspended particle:sediment MeHg ratios for the sites sampled at Portsmouth and in LIS lie close to the 1:1 line (Figure 7a), which suggests that turbulent sediment resuspension dominates at these sites. At the deep water sites in LIS, the similarity of suspended particle and sediment MeHg concentrations may reflect settling particulate material that supplies surface sediment (Balcom et al., 2004) rather than resuspended sediment. In sharp contrast, average suspended particle MeHg for sites WM (Wells) and MC (Hackensack) lie well above the 1:1 line, and suspended particle:sediment MeHg ratios are clearly elevated (2.8 to 46) at these locations (Table 1).
Figure 7.
a. 2009 mean suspended particle MeHg (±SE, surface & deep water; 3–4 m) plotted against mean sediment MeHg (0–6 cm) (LIS MeHg from Schartup et al., 2015), b. mean (±SE, surface & deep water) suspended particle MeHg plotted against NY/NJ Harbor (Hammerschmidt et al., 2008; Balcom et al., 2008), Hudson R. ETM (Heyes et al., 2004) and Delaware R. ETM (Gosnell et al., 2015-submitted) mean sediment MeHg. In each plot, the 1:1 line (x=y) is plotted for reference.
Table 1.
Ratios of water column suspended particle:sediment MeHg and water column dissolved:sediment pore water MeHg for sites sampled in 2009 and data from literature sources. Arranged from higher to lower ratios within each study.
| Site | Suspended particle:sediment MeHg | Site | Dissolved:pore water MeHg | Reference |
|---|---|---|---|---|
| LIS-W | 0.202 | Current study | ||
| WH | 46.3 | LIS-E | 0.103 | |
| MC | 9.95 | MC | 0.096 | |
| WD | 2.85 | BB | 0.066 | |
| BB | 1.62 | WD | 0.051 | |
| JEL | 0.632 | WH | 0.050 | |
| LIS-W1 | 0.496 | PNS | 0.043 | |
| PNS | 0.486 | JEL | 0.023 | |
| LIS-E1 | 0.157 | WM | 0.016 | |
| Buzzards Bay (MA) | 21.7 | Chen et al., 2014 | ||
| Barn Island (CT) | 11.1 | |||
| Waquoit (MA) | 10.7 | |||
| Jamaica Bay (NY) | 4.71 | |||
| Providence (RI) | 1.56 | |||
| Hackensack (NJ) | 0.579 | |||
| Wells (ME) | 0.330 | |||
| Old Saybrook (CT) | 0.241 | |||
| Portsmouth (NH) | 0.185 | |||
| Milford (CT) | 0.113 | |||
| NY/NJ Harbor (2002) | 1.15 | 0.007 | Balcom et al., 2008 | |
| 1.14 | 0.005 | Hammerschmidt et al., 2008 | ||
| 1.01 | 0.004 | |||
| 0.749 | 0.004 | |||
| Hudson R. ETM (2001) | 1.39 | 0.651 | Heyes et al., 2004 | |
| Delaware R. ETM (2012) | 1.33 | 0.603 | Mason et al., 2014 | |
| 0.750 | 0.383 | |||
| 0.773 | 0.327 | |||
| Mesocosm Experiment | 16.22 | Kim et al., 2006 | ||
| 6.22 | ||||
| 2.83 | ||||
| 1.53 |
Notes:
LIS water column MeHg data from Schartup et al. (2015)
no sediment resuspension;
resuspended sediment
Similar to suspended particle MeHg, suspended particle HgT (surface & bottom water; 3–4 m) did not correlate with sediment HgT (0–6 cm) across estuaries at the sites sampled in 2009. Suspended particle HgT was elevated well above sediment HgT at MC (Hackensack; 10.0 ± 1.02 nmol g−1; Table S3). At Wells and LIS-E, however, suspended particle HgT was lower (0.10 to 0.23 nmol g−1) and nearly the same as sediment HgT (0.01 to 0.16 nmol g−1), while suspended particle HgT at Portsmouth and LIS-W (0.13 to 0.35 nmol g−1) were about an order of magnitude lower than sediment HgT (1.20 to 2.36 nmol g−1).
Despite the lack of correlation between suspended particle and sediment MeHg in the current study, correlations between these parameters have been found in some East Coast estuaries. Suspended particle MeHg correlated quite well with sediment MeHg (Figure 7b) in the Delaware River ETM (0–4 cm, July 2012; Gosnell et al., 2015-submitted), the Hudson River ETM (0–15 cm, June & Nov. 2001; Heyes et al., 2004) and in NY/NJ Harbor (0–6 cm, Aug. 2002; Hammerschmidt et al., 2008; Balcom et al., 2008), and suspended particle:sediment MeHg ratios were close to 1.0 (0.75 to 1.4) in each of these regions (Table 1). We have not assessed the statistical correlation among these sites since these data were collected over widely separated years. Sediment resuspension is high in ETM regions, and, therefore, it is expected that suspended particle MeHg in the water and sediment MeHg values would be relatively similar. NY/NJ Harbor had even higher levels of suspended particle and sediment MeHg than the ETM regions of the Delaware and Hudson Rivers. This difference was likely the result of a higher concentration of Hg on the resuspended particles (Paulson, 2005) combined with exacerbated sediment mixing where the Hudson River delivers a large flux of water to NY/NJ Harbor. Additionally, the Harbor is impacted by local point sources such as sewage treatment facilities that may deliver particle bound MeHg or enhance Hg methylation. The higher variance in MeHg concentrations in the Harbor as compared to ETM regions is likely due to streamflow variability in the Hudson River and tidal influence. The correlation between suspended particle and sediment MeHg in NY/NJ Harbor was weaker in May 2003 when average streamflow for the Hudson River was twice as high as compared to Aug. 2002 (MDN, 2010).
It has been demonstrated that MeHg is produced in situ within estuarine sediment (Fitzgerald et al., 2007), and some portion of this MeHg is subsequently transferred to the water column through diffusive and advective fluxes (e.g., Benoit et al., 2009; Hammerschmidt & Fitzgerald, 2008; Gill et al., 1999), both within estuaries and in the watersheds discharging to these estuaries. Dissolved and particle-associated Hg and MeHg exchange between sediment and the water column can be driven by diffusion, sedimentation and resuspension. There is also the potential for dissolved-particulate exchange in the water column, although Heyes et al. (2004) and Kim et al. (2004) measured no desorption of HgT or MeHg from suspended sediment in the field or the lab, respectively, and this mechanism did not appear to increase the dissolved, bioavailable form of MeHg in the water column.
Potential explanations for the higher particulate as compared to sediment MeHg at Wells and MC are external inputs from the watershed and/or dominance of the particulate material by microorganisms that are accumulating MeHg from the water column. Based on Hg isotope analysis of sediment and biota from East Coast US estuaries sampled by Chen et al. (2014), Kwon et al. (2014) concluded that the pool of sediment Hg is strongly reflected in pelagic estuarine species, but local sediment was not the only source of MeHg at some of the sites examined. Locations with elevated suspended particle MeHg concentrations and suspended particle:sediment MeHg ratios may be associated with watersheds with a high percentage of wetlands. Numerous studies have reported elevated watershed MeHg yields for wetland areas (e.g., Watras et al., 2005; Lawson et al., 2001; Driscoll et al., 1998; St Louis et al., 1996; Hurley et al., 1995). Unlike the current study, Chen et al. (2014) found that suspended particle MeHg concentrations and water:sediment MeHg ratios were not elevated at either Wells or MC (Hackensack). However, as water column sampling was limited in that 2008 study, these differences may simply reflect the spatial and temporal variability within these systems. Chen et al. (2014) found elevated suspended particle to bottom sediment MeHg ratios (4.7 to 22; Table 1) at Buzzards Bay (MA), Barn Island (CT), Waquoit (MA; saltmarsh grass systems), and Jamaica Bay (NY; mixed saltmarsh grass and phragmites system), which are watersheds with a high percentage of wetlands similar to Wells and MC (Hackensack). Additionally, elevated suspended particle %MeHg at Wells (4.5 to 7%) suggests that there was a higher fraction of plankton and microbes at these locations. MeHg can comprise up to 20% of the total Hg in phytoplankton, and even more in zooplankton (Mason et al., 2012).
The degree of resuspension and primary production in estuarine systems likely has a strong impact on the ratio of suspended particle to sediment MeHg. For example, in mesocosm studies (1 m deep water column) Kim et al (2004) examined the impact of sediment resuspension on water column HgT and MeHg. In the mesocosms with sediment resuspension, water column particulate HgT was ~80% of the sediment HgT concentration and particulate MeHg was 1.5–3 times higher than that of the surface sediment (<1% MeHg). In contrast, in the mesocosms without resuspension, HgT in the suspended particles was only half that of the surface sediment, but the particulate MeHg was 6–16 times that of the surface sediment (up to 6% MeHg; Table 1). In the resuspended mesocosms, Chl a concentrations (on a mass basis) were 5–10 times lower than in the non-resuspended mesocosms, and resuspended mesocosms had a lower percent particulate organic matter (10–20%) compared to systems without resuspension (40–60%). In San Francisco Bay, the ratio of particulate to bottom sediment MeHg ranged from <1 to 40 (average of 7; Conaway et al., 2003), suggesting that sediment resuspension was not the major source of particulate MeHg to this system. There was no relationship between suspended particle:sediment MeHg ratios and Chl a (mg Chl a g−1) in the Bay, suggesting that the differences were not driven purely by the relative amount of phytoplankton in the water column, but potentially by upstream supply of MeHg. Overall, in estuarine systems with significant resuspension it is likely that the sediment and particulate MeHg concentrations will be relatively similar, while in productive systems with little resuspended sediment, particulate MeHg concentrations may be substantially higher than that of the underlying sediment.
In summary, water column suspended particle MeHg and HgT were not well correlated with sediment concentrations across multiple estuaries. However, positive relationships between suspended particle and sediment MeHg have been found in more turbulent ETM regions and in NY/NJ Harbor (Heyes et al., 2004; Balcom et al., 2008; Gosnell et al., 2015-submitted). Local sediment was not the only source of MeHg at the sites sampled in the current study. Potential explanations for the lack of correlation between suspended particle and sediment MeHg at some of the sites include external inputs from the watershed in wetland dominated systems, or dominance of the particulate material by microorganisms that are accumulating MeHg from the water column.
Dissolved water column and sediment pore water MeHg across estuaries
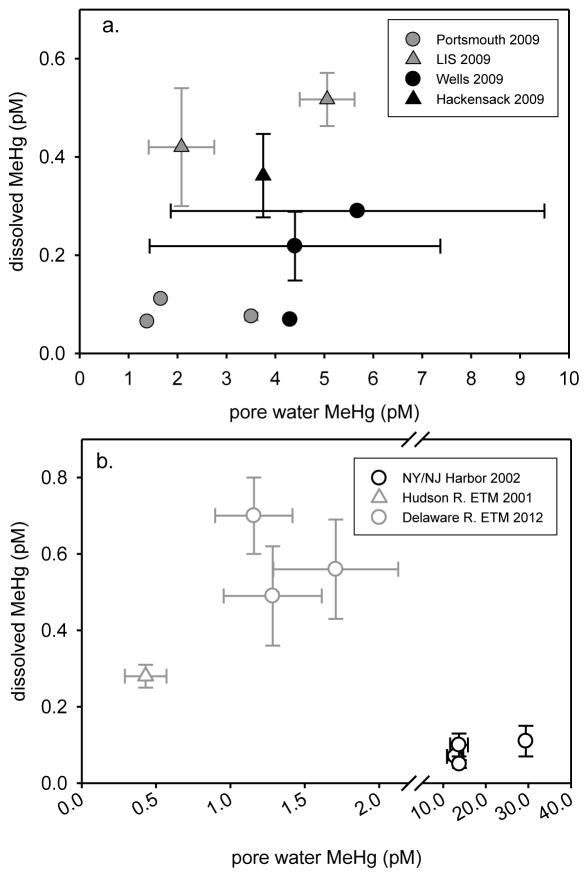
Dissolved MeHg (surface & bottom water; 3–4 m) did not correlate with sediment pore water MeHg (0–6 cm) across estuaries at the sites sampled in 2009 (Figure 8a). Water column concentrations were generally an order of magnitude lower than that found in pore water, with dissolved water column MeHg concentrations ranging from 1.6 to 20% of pore water values (Table 1). Pore water may be an important source of MeHg for organisms living near or in sediment, especially in cases where pore water concentrations are a lot higher than the overlying water. We would not expect a 1:1 relationship between these parameters since pore water MeHg is related to its production in sediment, and the sediment’s binding capacity, while water column dissolved MeHg concentrations are subject to change from factors such as fresh water input and tidal exchange with the ocean. Water column dissolved HgT was not proportional to pore water HgT at the sites sampled in 2009. Dissolved HgT at MC (Hackensack; 76.3 pM) and JEL (Portsmouth; 46.3 pM) were most similar to pore water HgT (118 pM and 67.8 pM, respectively; Table S3). Water column dissolved HgT at the remaining sites (5.2 to 8.2 pM) was generally 1 or 2 orders of magnitude lower than pore water HgT (31.3 to 390 pM).
Figure 8.
a. 2009 mean water column dissolved MeHg (±SE, surface & deep water; 3–4 m) plotted against mean sediment pore water MeHg (0–6 cm) (LIS MeHg from Schartup et al., 2015), b. NY/NJ Harbor (Hammerschmidt et al., 2008; Balcom et al., 2008), Hudson R. ETM (Heyes et al., 2004) and Delaware R. ETM (Gosnell et al., 2015-submitted) mean (±SE, surface & deep water) dissolved MeHg plotted against mean sediment pore water MeHg.
Correlations between water column dissolved and pore water MeHg have been found for some East Coast estuaries. As was the case for suspended particle and sediment MeHg, the correlations were in well-mixed ETM regions where sediment resuspension is enhanced. Although water column MeHg concentrations were still lower than sediment pore water MeHg, they showed a positive relationship (Figure 8b) in the Hudson River ETM (0–15 cm, June & Nov. 2001; Heyes et al., 2004) and the Delaware River ETM (0–6 cm, July 2012; Gosnell et al., 2015-submitted) suggesting that the pore water is an important source. Since there is significant sediment resuspension and water column turbulence in the ETM, enhanced transfer of dissolved MeHg from sediment methylation by diffusive and advective fluxes out of the sediment may occur (e.g., Heyes et al., 2004; Gosnell et al., 2015-submitted). For the Delaware estuary, there is also potential enhancement of MeHg flux due to groundwater inputs (Schwartz, 2003). The ETM water column dissolved:pore water MeHg ratios were elevated (0.3 to 0.7) compared to the estuaries sampled in the current study (Table 1). Water column MeHg concentrations were much lower in November with colder water temperatures than during the other seasons sampled in the Delaware River ETM (Gosnell et al., 2015-submitted).
Although suspended particle and sediment MeHg showed a positive relationship in NY/NJ Harbor (Figure 7b), Balcom et al. (2008) reported that dissolved MeHg was an order of magnitude lower than pore water MeHg (0–6 cm; Hammerschmidt et al., 2008) during Aug. 2002 (Figure 8b), with very low water dissolved:pore water MeHg ratios. This is inconsistent with the positive relationships reported for these parameters in the ETM regions of the Delaware and Hudson Rivers. Hammerschmidt et al. (2008) reported that the diffusional flux of MeHg was quite low for this region, that most of the organic material in Harbor sediment appears to be derived from terrestrial and sewage sources, and that HgII and MeHg species have a greater affinity (elevated Kd values) for allochthonous as compared to planktonic organic material.
In summary, water column dissolved MeHg and HgT did not correlate with sediment pore water concentrations across estuaries at the sites sampled in 2009. However, as was the case for suspended particle and sediment MeHg, positive relationships have been found between water column dissolved and sediment pore water MeHg in ETM regions (Heyes et al., 2004; Gosnell et al., 2015-submitted). These relationships may be produced by enhanced sediment MeHg flux associated with water turbulence and sediment resuspension, or by enhanced ground water flow.
External sources of MeHg to estuaries
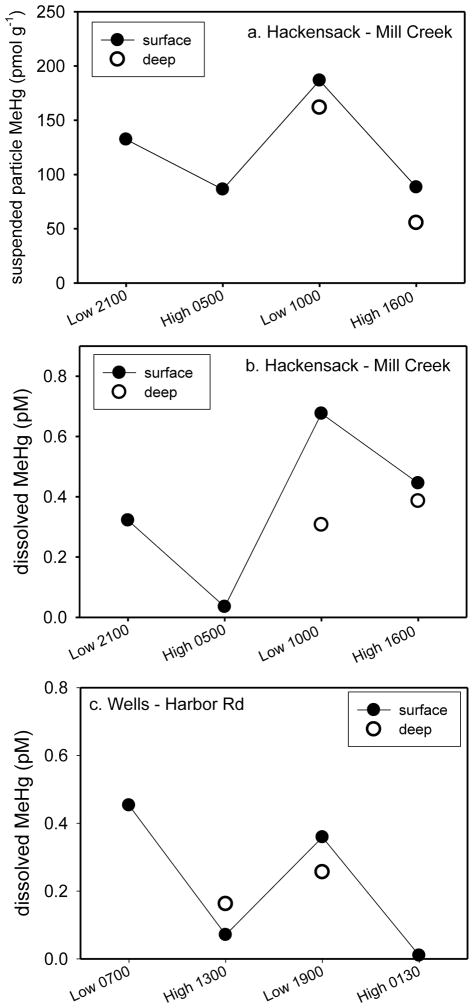
As indicated above, watershed inputs of MeHg to estuaries may be important. Water column tidal sampling results for MC (Hackensack) indicate that average particulate MeHg concentrations in both surface and deep (3–4 m) water were elevated at low tide (160 pmol g−1) as compared to high tide (76.7 pmol g−1; Figure 9a). This suggests that suspended particulate material with elevated MeHg concentrations is being supplied from watersheds as water drains from these wetland areas with the ebbing tide. Enhancement in estuarine surface water MeHg would be expected since the lower salinity water from streams/rivers remains near the surface unless there is sufficient mixing. Cardona-Marek et al. (2007) and Weis et al. (2005) reported average HgT concentrations of 53 to 250 nmol g−1 for suspended particulate material from nearby Berrys Creek. The ratio of MeHg:HgT is approximately 1% for MC particulate material (Table S1), so suspended particle MeHg concentrations of 530 to 2500 pmol g−1 could be supplied from these wetland areas. There was no tidal suspended particle MeHg data for Wells. Portsmouth has less wetland dominated watershed, and suspended particle MeHg did not show a tidal pattern.
Figure 9.
Tidal sampling of surface and deep (3–4 m) waters: a. Suspended particle MeHg concentrations at Mill Creek (Hackensack; 29–30 July 2009), b. dissolved MeHg concentrations at Mill Creek (Hackensack; 29–30 July 2009) and c. dissolved MeHg concentrations at Harbor Rd. (Wells; 9–10 July 2009). Approximate stage of tide (low/high) and sampling times are indicated. Each point is an individual sample.
The range in water column dissolved MeHg concentrations was similar at WH (0.01 to 0.45 pM) and MC (0.04 to 0.68pM), and both sites showed tidal trends (Figures 9b & 9c). Average dissolved surface MeHg concentrations were higher at low tide for both WH (0.41 pM) and MC (0.50 pM) as compared to high tide (0.04 & 0.24 pM, respectively), and deep water MeHg concentrations changed little with tide at both sites. As was the case for suspended particle MeHg at MC, this implies that water with elevated MeHg concentrations is being supplied from watersheds as water drains from these wetland areas with the ebbing tide. We have found average dissolved MeHg concentrations of 4.3 pM in Maine and 1.6 pM in Connecticut for small estuaries with wetland dominated watersheds (R. Mason, unpublished data), and these concentrations are sufficient to produce the tidal changes in dissolved MeHg observed at WH and MC. Dissolved MeHg concentrations were lower at the Portsmouth sites where there is less wetland dominated watershed, and they did not show the tidal variability seen at the other sites.
Conclusions
The lack of a relationship between sediment compartment MeHg and water column MeHg indicates that sediment is not the only source of MeHg to the water column in the four estuaries studied. Moreover, increased concentrations of MeHg during low as compared to high tides further suggests that upstream sources may be important, particularly in wetland dominated systems. However, the highly variable water column to sediment MeHg ratios suggest that the contribution of external sources may vary greatly across systems. Our findings also suggest that while in some systems sediment does not appear to be the dominant source of MeHg to the water column, this may differ in ETM and other high energy regions where resuspension is prevalent, or those with substantial groundwater inputs or sediment MeHg flux. Future field studies should include better characterization of particle size and composition, both organic (e.g. Chl a/pigments, carbon) and inorganic (e.g. Fe, Al), source indicator measurements such as carbon and nitrogen isotope ratios (13C & 15N), measurement of advective and diffusive fluxes of MeHg from sediment, and seasonal measurements of MeHg concentrations in river water and watershed discharges. These parameters, when combined with Hg and MeHg data, should facilitate a better understanding and prediction of the importance of internal versus external sources of MeHg to estuarine systems. Our study indicates that identifying MeHg sources to food webs in estuaries requires consideration of both upstream and local sediment sources of MeHg, and that bioaccumulation in pelagic organisms may be determined by whether particulates are in the form of resusupended sediments or algae. These differences will have important implications for management of Hg contaminated sites where much of the Hg contamination is in the suspended particulate fraction. The bioaccumulation of MeHg from the particulate fraction depends on the composition (i.e. whether it is inorganic, detrital organic, or living organic) and the degree of flux of MeHg from the sediment to the water column. All of these factors will determine whether MeHg transfer from abiotic compartments to the food web is linked to internal sediment sources or upstream sources.
Supplementary Material
Highlights.
Multi-estuary approach adds insight to studies of MeHg cycling
Variable relationship between sediment and water column MeHg compartments
Upstream sources of MeHg are important in wetland dominated systems
MeHg contributed to estuarine food webs from both local and external sources
Acknowledgments
This study was funded by the National Institute of Environmental Health Sciences (NIH Grant Number P42 ES007373). For assistance in the lab and the field, our thanks to Genevieve Bernier, Brian DiMento, Susan Gichuki, Kati Gosnell, Terill Hollweg, Allan Hutchins, Veronica Ortiz and Udonna Ndu (Dept. of Marine Sciences, University of Connecticut); Deenie Bugge and Darren Ward (Dept. of Biological Sciences, Dartmouth College); Luis Carrasco (Institute of Environmental Assessment and Water Research, Spanish National Research Council). Thanks to Dr. Richard Greene (Delaware Dept. of Natural Resources and Environmental Control) for helpful discussions during preparation of the manuscript, and to Dr. Vivien Taylor (Dartmouth College) and two anonymous reviewers for comments that improved the manuscript.
Footnotes
Publisher's Disclaimer: This is a PDF file of an unedited manuscript that has been accepted for publication. As a service to our customers we are providing this early version of the manuscript. The manuscript will undergo copyediting, typesetting, and review of the resulting proof before it is published in its final citable form. Please note that during the production process errors may be discovered which could affect the content, and all legal disclaimers that apply to the journal pertain.
Contributor Information
Robert P. Mason, Email: robert.mason@uconn.edu.
Celia Y. Chen, Email: Celia.Y.Chen@Dartmouth.edu.
References
- APHA (American Public Health Association, American Water Works Association, and Water Environment Federation) Standard Methods for the Examination of Water and Wastewater. 19. American Public Health Association; Washington, DC: 1995. [Google Scholar]
- Balcom PH, Hammerschmidt CH, Fitzgerald WF, Lamborg CH, O’Connor JS. Seasonal distributions and cycling of mercury and methylmercury in the waters of New York/New Jersey Harbor Estuary. Mar Chem. 2008;109:1–17. [Google Scholar]
- Balcom PH, Fitzgerald WF, Vandal GM, Lamborg CH, Rolfhus KR, Langer CS, Hammerschmidt CH. Mercury sources and cycling in the Connecticut River and Long Island Sound. Mar Chem. 2004;90:53–74. [Google Scholar]
- Benoit JM, Shull DH, Harvey RM, Beal SA. Effect of bioirrigation on sediment-water exchange of methylmercury in Boston Harbor, Massachusetts. Environ Sci Technol. 2009;43:3669–3674. doi: 10.1021/es803552q. [DOI] [PubMed] [Google Scholar]
- Bloom NS, Fitzgerald WF. Determination of volatile mercury at the picogram level by low-temperature gas chromatography with cold-vapor atomic fluorescence. Anal Chim Acta. 1988;208:151–161. [Google Scholar]
- Bloom NS, Crecelius EA. Determination of mercury in seawater at sub-nanogram per liter levels. Mar Chem. 1983;14:49–59. [Google Scholar]
- Cardona-Marek T, Schaefer J, Ellickson K, Barkay T, Reinfelder JR. Mercury speciation, reactivity, and bioavailability in a highly contaminated estuary, Berry’s Creek, New Jersey Meadowlands. Environ Sci Technol. 2007;41:8268–8274. doi: 10.1021/es070945h. [DOI] [PubMed] [Google Scholar]
- Chen CY, Borsuk ME, Bugge DM, Hollweg T, Balcom PH, Ward DM, Williams J, Mason RP. Benthic and pelagic pathways of methylmercury bioaccumulation in estuarine food webs. Plos One. 2014;9:1–11. doi: 10.1371/journal.pone.0089305. [DOI] [PMC free article] [PubMed] [Google Scholar]
- Conaway CH, Squire S, Mason RP, Flegal AR. Mercury speciation in the San Francisco Bay estuary. Mar Chem. 2003;80:199–225. [Google Scholar]
- Driscoll CT, Holsapple J, Schofield CL, Munson R. The chemistry and transport of mercury in a small wetland in the Adirondack region of New York, USA. Biogeochemistry. 1998;40:137–146. [Google Scholar]
- Fitzgerald WF, Lamborg CH, Hammerschmidt CR. Marine biogeochemical cycling of mercury. Chem Rev. 2007;107:641–662. doi: 10.1021/cr050353m. [DOI] [PubMed] [Google Scholar]
- Fitzgerald WF, Gill GA. Sub-nanogram determination of mercury by two-stage gold amalgamation applied to atmospheric analysis. Anal Chem. 1979;51:1714–1720. [Google Scholar]
- Gehrke GE, Blum JD, Slotton DG, Greenfield BK. Mercury isotopes link mercury in San Francisco Bay forage fish to surface sediments. Environ Sci Technol. 2011;45:1264–1270. doi: 10.1021/es103053y. [DOI] [PubMed] [Google Scholar]
- Gill GA, Bloom NS, Cappellino S, Driscoll CT, Dobbs C, McShea L, Mason R, Rudd JWM. Sediment-water fluxes of mercury in Lavaca Bay, Texas. Environ Sci Technol. 1999;33:63–669. [Google Scholar]
- Gosnell K, Balcom P, Ortiz V, DiMento B, Schartup A, Greene R, Mason R. Seasonal cycling and transport of mercury and methylmercury in the estuarine turbidity maximum of the Delaware Estuary. Aquatic Geochemistry 2015 submitted. [Google Scholar]
- Hammerschmidt CR, Fitzgerald WF. Sediment–water exchange of methylmercury determined from shipboard benthic flux chambers. Mar Chem. 2008;109:86–97. [Google Scholar]
- Hammerschmidt CR, Fitzgerald WF. Bioaccumulation and trophic transfer of methylmercury in Long Island Sound. Arch Environ Contam Toxicol. 2006;51:416–424. doi: 10.1007/s00244-005-0265-7. [DOI] [PubMed] [Google Scholar]
- Hammerschmidt CR, Fitzgerald WF. Geochemical controls on the production and distribution of methylmercury in near shore marine sediments. Environ Sci Technol. 2004;38:1487–1495. doi: 10.1021/es034528q. [DOI] [PubMed] [Google Scholar]
- Hammerschmidt CR, Fitzgerald WF. Formation of artifact methylmercury during extraction from a sediment reference material. Anal Chem. 2001;73:5930–5936. doi: 10.1021/ac010721w. [DOI] [PubMed] [Google Scholar]
- Hammerschmidt CR, Fitzgerald WF, Balcom PH, Visscher PT. Organic matter and sulfide inhibit methylmercury production in sediments of New York/New Jersey Harbor. Mar Chem. 2008;109:165–182. [Google Scholar]
- Hammerschmidt CR, Fitzgerald WF, Lamborg CH, Balcom PH, Visscher PT. Biogeochemistry of methylmercury in sediments of Long Island Sound. Mar Chem. 2004;90:31–52. [Google Scholar]
- Heyes A, Miller C, Mason RP. Mercury and methylmercury in the Hudson River sediment: Impact of resuspension on partitioning and methylation. Mar Chem. 2004;90:75–89. [Google Scholar]
- Hollweg TA, Gilmour CC, Mason RP. Mercury and methylmercury cycling in sediments of the mid-Atlantic continental shelf and slope. Limnol Oceanogr. 2010;55(6):2703–2722. [Google Scholar]
- Hollweg TA, Gilmour CC, Mason RP. Methylmercury production in sediments of Chesapeake Bay and the mid-Atlantic continental margin. Mar Chem. 2009;114:86–101. [Google Scholar]
- Hurley JP, Benoit JM, Barbiarz CL, Shafer MM, Andren AW, Sullivan JR, Hammond R, Webb DA. Influences of watershed characteristics on mercury levels in Wisconsin rivers. Environ Sci Technol. 1995;29:1867–1875. doi: 10.1021/es00007a026. [DOI] [PubMed] [Google Scholar]
- Kim EH, Mason RP, Porter ET, Soulen HL. The effect of resuspension on the fate of total mercury and methylmercury in a shallow estuarine ecosystem: a mesocosm study. Mar Chem. 2004;86:121–137. [Google Scholar]
- Kwon SY, Blum JD, Chen CY, Meattey DE, Mason RP. Mercury isotope study of sources and exposure pathways of methylmercury in estuarine food webs in the Northeastern U.S. Environ Sci Technol. 2014;48:10089–10097. doi: 10.1021/es5020554. [DOI] [PMC free article] [PubMed] [Google Scholar]
- Lawson NM, Mason RP, Laporte JM. The fate and transport of mercury, methylmercury, and other trace metals in Chesapeake Bay tributaries. Wat Res. 2001;35(2):501–515. doi: 10.1016/s0043-1354(00)00267-0. [DOI] [PubMed] [Google Scholar]
- MDN (Mercury Deposition Network) National Atmospheric Deposition Program. 2010 http://nadp.sws.uiuc.edu.
- Mason RP, Choi AL, Fitzgerald WF, Hammerschmidt CR, Lamborg CH, Soerensen AL, Sunderland EM. Mercury biogeochemical cycling in the ocean and policy implications. Environ Res. 2012;119:101–117. doi: 10.1016/j.envres.2012.03.013. [DOI] [PMC free article] [PubMed] [Google Scholar]
- Mason RP, Lawson NM, Lawrence AL, Leaner JJ, Lee JG, Sheu GR. Mercury in Chesapeake Bay. Mar Chem. 1999;65:77–96. [Google Scholar]
- Parsons TR, Yoshiaki M, Lalli CM. A manual of chemical and biological methods for seawater analysis. Pergamon Press; New York: 1984. [Google Scholar]
- Paulson AJ. Tracing water and suspended matter in Raritan and Lower New York Bays using dissolved and particulate elemental concentrations. Mar Chem. 2005;97:60–77. [Google Scholar]
- St Louis VL, Rudd JWM, Kelley CA, Beaty KG, Flett RJ, Roulet NT. Production and loss of methylmercury and loss of total mercury from boreal forest catchments containing different types of wetlands. Environ Sci Technol. 1996;30:2719–2729. [Google Scholar]
- Schartup AT, Ndu UC, Balcom PH, Mason RP, Sunderland EM. Contrasting effects of marine and terrestrially derived dissolved organic matter on mercury speciation and bioavailability in seawater. Environ Sci Technol. 2015 doi: 10.1021/es506274x. doi:dx.doi.org/10.1021/es506274x. [DOI] [PubMed] [Google Scholar]
- Schartup AT, Balcom PH, Mason RP. Sediment-Porewater Partitioning, Total Sulfur, and Methylmercury Production in Estuaries. Environ Sci Technol. 2014;48(2):954–960. doi: 10.1021/es403030d. [DOI] [PMC free article] [PubMed] [Google Scholar]
- Schartup AT, Mason RP, Balcom PH, Hollweg TA, Chen CY. Methylmercury production in estuarine sediments: role of organic matter. Environ Sci Technol. 2013;47(2):695–700. doi: 10.1021/es302566w. [DOI] [PMC free article] [PubMed] [Google Scholar]
- Schwartz MC. Significant groundwater input to a coastal plain estuary: assessment from excess radon. Estuarine, Coastal and Shelf Science. 2003;56:31–42. [Google Scholar]
- Sunderland EM, Dalziel J, Heyes A, Branfireun BA, Krabbenhoft DP, Gobas FAPC. Response of a macrotidal estuary to changes in anthropogenic mercury loading between 1850 and 2000. Environ Sci Technol. 2010;44:1698–1704. doi: 10.1021/es9032524. [DOI] [PubMed] [Google Scholar]
- Taylor DL, Linehan JC, Murray DW, Prell WL. Indicators of sediment and biotic mercury contamination in a southern New England estuary. Mar Poll Bull. 2012;64:807–819. doi: 10.1016/j.marpolbul.2012.01.013. [DOI] [PMC free article] [PubMed] [Google Scholar]
- Tseng CM, Hammerschmidt CR, Fitzgerald WF. Determination of methylmercury in environmental matrixes by on-line flow injection and atomic fluorescence spectrometry. Anal Chem. 2004;76:7131–7136. doi: 10.1021/ac049118e. [DOI] [PubMed] [Google Scholar]
- U.S. EPA (Environmental Protection Agency) Method 7473: Mercury in solids and solutions by thermal decomposition, amalgamation, and atomic absorption spectrophotometry. U.S. Environmental Protection Agency; Washington, D.C: 1998. [Google Scholar]
- Watras CJ, Morrison KA, Kent A, Price N, Regnell O, Eckley C, Hintelmann H, Hubacher T. Sources of methylmercury to a wetland-dominated lake in northern Wisconsin. Environ Sci Technol. 2005;39:4747–4758. doi: 10.1021/es040561g. [DOI] [PubMed] [Google Scholar]
- Weis P, Barrett KR, Proctor T, Bopp RF. Studies of a contaminated brackish marsh in the Hackensack Meadowlands of northeastern New Jersey: An assessment of natural recovery. Mar Poll Bull. 2005;50:1405–1415. doi: 10.1016/j.marpolbul.2005.06.013. [DOI] [PubMed] [Google Scholar]
Associated Data
This section collects any data citations, data availability statements, or supplementary materials included in this article.


