Abstract
During eukaryotic translation initiation, 43S complexes, comprising a 40S ribosomal subunit, initiator tRNA and initiation factors (eIF) 2, 3, 1 and 1A, attach to the 5’-terminal region of mRNA and scan along it to the initiation codon. Scanning on structured mRNAs additionally requires the DExH-box protein DHX29. Mammalian eIF3 contains 13 subunits and participates in nearly all steps of initiation. Eight subunits having PCI (proteasome, COP9/signalosome, eIF3) or MPN (Mpr1-Pad1-N-terminal) domains constitute eIF3's structural core, to which five peripheral subunits are flexibly linked. Here we present a cryo-EM structure of eIF3 in the context of the DHX29-bound 43S complex, showing the PCI/MPN core at ~6Å resolution. It reveals the organization of the individual subunits and their interactions with components of the 43S complex. We were able to build near-complete polyalanine-level models of eIF3's PCI/MPN core and of two peripheral subunits. The implications for understanding ribosomal attachment and scanning are discussed.
Translation initiation in eukaryotes begins with binding of eIF3, eIF1, eIF1A and the eIF2•GTP/Met-tRNAiMet ternary complex (TC) to the 40S subunit, forming a 43S preinitiation complex1. The 43S complex attaches to the cap-proximal region of mRNA after unwinding of its secondary structure by eIF4A, eIF4B and eIF4F, and scans downstream to the initiation codon, where it forms a 48S initiation complex by codon-anticodon base-pairing. Scanning on structured mammalian mRNAs additionally requires DHX29, which binds directly to the 40S subunit. Finally, eIF5 and eIF5B promote joining of the 60S subunit to the 48S complex, yielding an elongation-competent 80S ribosome.
eIF3 is the largest, most complex initiation factor, which interacts with several eIFs, including eIF1 and the eIF4G subunit of eIF4F1-3. eIF3 is involved in almost all steps of initiation, including ribosomal recruitment of the TC, attachment of 43S complexes to mRNA via interaction with eIF4G, and scanning. The ~800 kDa mammalian eIF3 comprises 13 subunits (a-m) (Extended Data Fig. 1a). Six subunits (a, c, e, k, l, and m) contain PCI domains, which consist of N-terminal helical repeats followed by a winged helix domain (WHD) that mediates PCI polymerization4, and two (f and h) contain MPN domains, which consist of a β-barrel surrounded by α-helices and β-strands that function to promote assembly of multiprotein complexes5,6. The PCI/MPN subunits form the octameric structural core of eIF3. Cryo-EM studies7-10 revealed the organization of the 5-lobed PCI/MPN core of mammalian eIF3 and confirmed the similarity of its topology with those of the proteasome lid and the COP9 signalosome6,11-13. However, the resolution of eIF3 in these studies (12-20Å) was insufficient to reveal molecular details of the PCI/MPN core organization.
Four of the remaining subunits (b, d, g and i) are stably linked to the PCI/MPN core, likely in a flexible manner7,8,10. Domains in these subunits include RNA recognition motif (RRM) domains (eIF3b and eIF3g)14 and WD40 β-propeller domains (eIF3b and eIF3i)15-17. eIF3b, eIF3i and eIF3g form a separate module, which attaches to the PCI/MPN core through its interaction with eIF3a's C-terminal domain (CTD)15-21. The last subunit, eIF3j, is substoichiometric and loosely attached to the rest of eIF322. Whereas the majority of eukaryotes encode a complete set of eIF3 subunits, S. cerevisiae and related yeasts retain only six: two PCI (a, c), and four non-core (b, i, g, j) subunits, with eIF3j being nonessential23.
We recently determined the structure of mammalian eIF3 and its position on the 40S subunit by cryo-EM reconstruction of the DHX29-bound 43S complex at 11.6 Å resolution7. The PCI/MPN core resides on the back of the 40S subunit, making two contact points via its left arm and head with ribosomal proteins (rp) eS1/eS26 and uS15/eS27, respectively. Two additional densities, on the solvent side underneath h16 and on the head behind RACK1, were attributed to eIF3's peripheral domains belonging to non-core subunits. However, the resolution of this complex was insufficient for modeling of eIF3. Thus, although recent crystallographic studies revealed some important structural aspects of yeast eIF317, molecular details of mammalian eIF3 organization remained obscure.
Here we present a high-resolution cryo-EM reconstruction of mammalian eIF3 (lacking eIF3j) in the context of the DHX29-bound 43S complex. The reconstructed density map allowed us to derive a near-complete polyalanine-level model of eIF3's PCI/MPN octamer core and two peripheral subunits, using homology and ab initio modeling.
Sample Preparation and Electron Microscopy
To obtain the structure of 40S-associated eIF3, DHX29-bound 43S complexes were prepared as described7 (Supplementary Information). eIF3 was purified from rabbit reticulocyte lysate and contained C-terminally truncated eIF3a (2-1061; see Supplementary Information “Sample Composition and Image Processing”, Extended Data Figs. 2a and 3a).
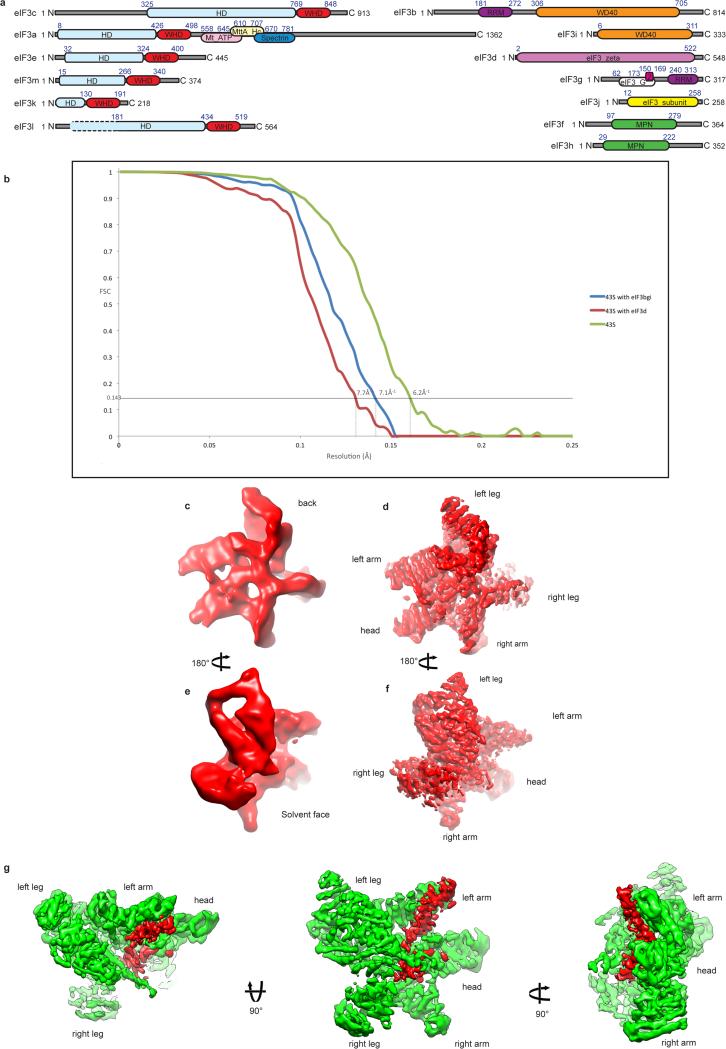
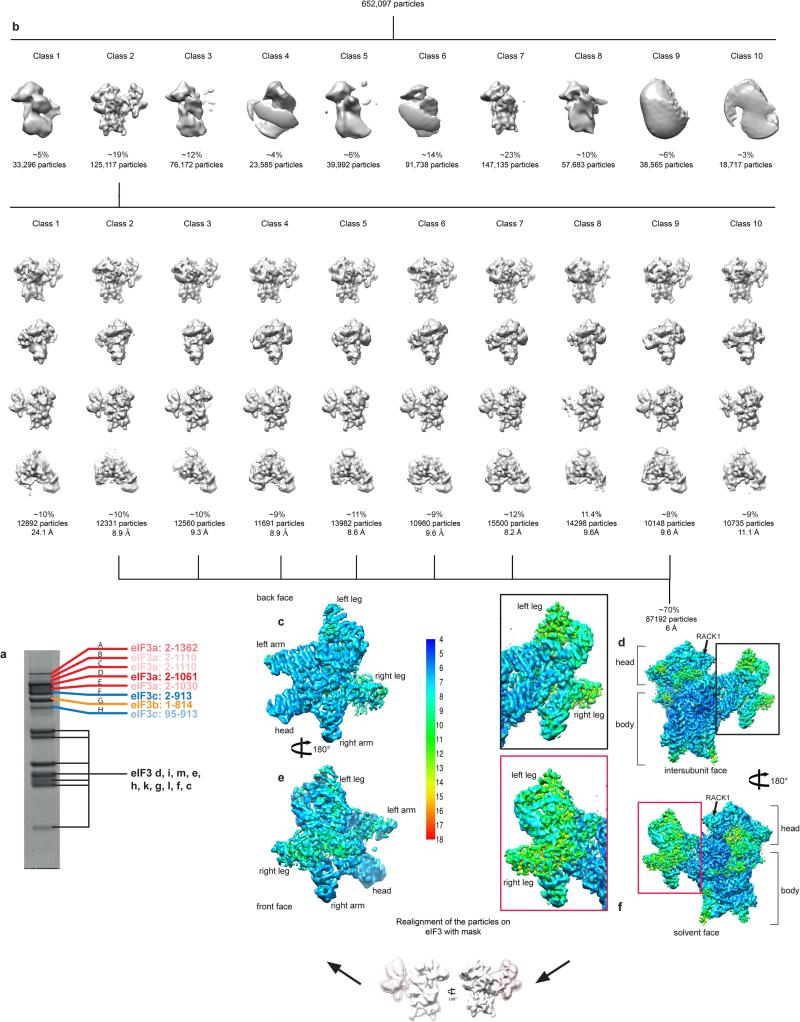
The processed imaged particles yielded an ~6 Å cryo-EM reconstruction on average (Extended Data Figs. 1b, 2d and f). Local refinement of the orientations of the images was applied to improve the resolution of eIF3 (Extended Data Fig. 2c and e) leading to a resolution of ~6 Å for most regions of the eIF3 core. Compared to our previous study7, secondary structure elements are now clearly resolved in most regions of the core (Extended Data Fig. 1 c to f).
Structure and atomic model of the PCI/MPN core of eIF3
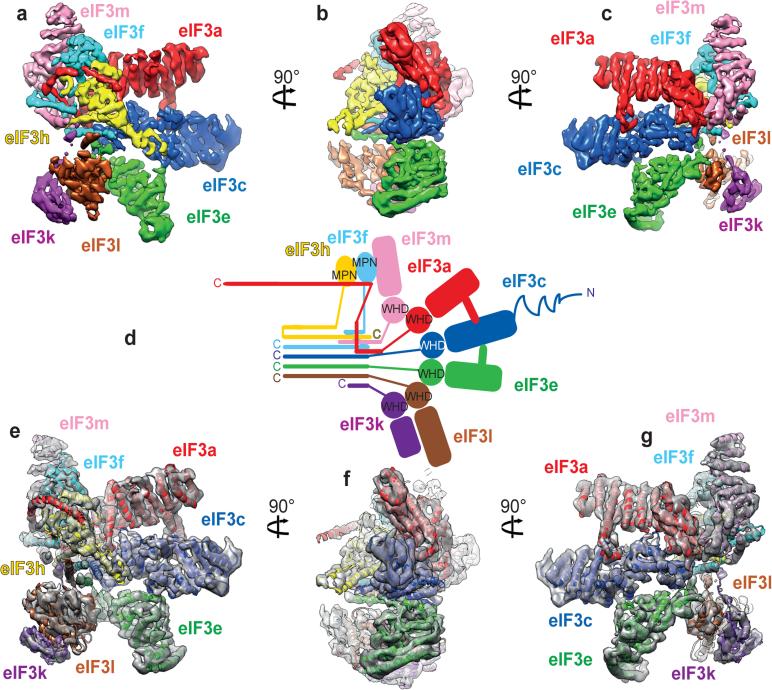
The PCI/MPN octamer core adopts the classic 5-lobed shape. Density segmentation (Fig. 1a-c) was performed on the basis of topological similarity with the proteasome lid and the COP9 signalosome11,13, and rigid-body fitting of crystal structures of yeast eIF3a and eIF3c17. This analysis revealed the general organization of the eIF3 core (Fig. 1d). The PCI subunits (a, c, e, l, k and m) are arranged sequentially, forming an arc. The MPN subunits (f and h) bind to each other and attach to the rest of the octamer mainly through the association of eIF3f with eIF3m. In addition to the PCI arc, at least one α-helix of each subunit (except for eIF3a and eIF3m) is involved in the formation of a 7-helix-bundle.
Fig. 1. Structure of eIF3 core.
a-c, Segmented eIF3 core, colored variably by subunit, seen from different orientations.d, Two-dimensional representation of the three-dimensional structure of the eIF3 octamer core. The helical bundle is represented by colored bars. Zigzagged line on eIF3c indicates possibly unstructured N-terminal tail. The eIF3a C-terminal region (not present in the structure reported here) is not shown in this schematic representation. e-g, Fitting of the eIF3 core model in its cryo-EM segmented density.
Each subunit of the eIF3 core was modeled in its density segment using ab initio and homology modeling. When there was no homology to rely on, the secondary structure elements (principally α-helices) of the concerned parts were predicted and built into the map. The resulting model fits the eIF3 core density (Figs. 1e-g and 2) with a cross-correlation coefficient of 0.94. Despite the good resolution of the eIF3 core in the cryo-EM map, one region of density could not be assigned (Extended Data Fig. 1g).
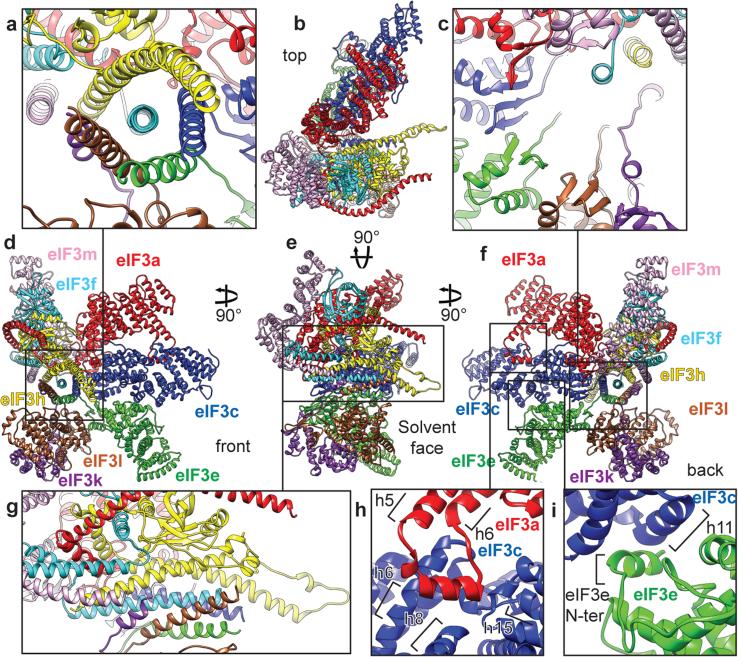
Fig. 2. Model of the eIF3 core.
a and g, Close-up view of the 7-helix bundle formed by subunits h, c, e, l and k, seen in two orientations. b-f, Polyalanine-level model of the eIF3 octamer core seen from different orientations. c, Close-up view of β-sheet arc of the PCI domains of subunits m, a, c, e, k and l. The 7-helix bundle was cut out by fading it to highlight the arched β-sheet. h and i, Close-up views of additional quaternary contacts between eIF3a and eIF3c (panel h) and eIF3c and eIF3e (panel i).
The model of the eIF3 core reveals that the PCI arc, the major interaction hub, consists of a large arched β-sheet assembled from the WHD β-sheets of the individual PCI domains of subunits a, c, e, l, k and m (Fig. 2c). This first interaction hub wraps around the second, which comprises a 7-helix bundle formed by packing of the C-terminal helices of subunits c, e, f, h, k and l (Fig. 2a, c and g). To assign helices to individual subunits, we used the conserved helical bundle structure in the proteasome lid and COP9 signalosome13,24, as the organization of the 7-helix bundle is conserved in eIF3 (Extended Data Fig. 4a-c).
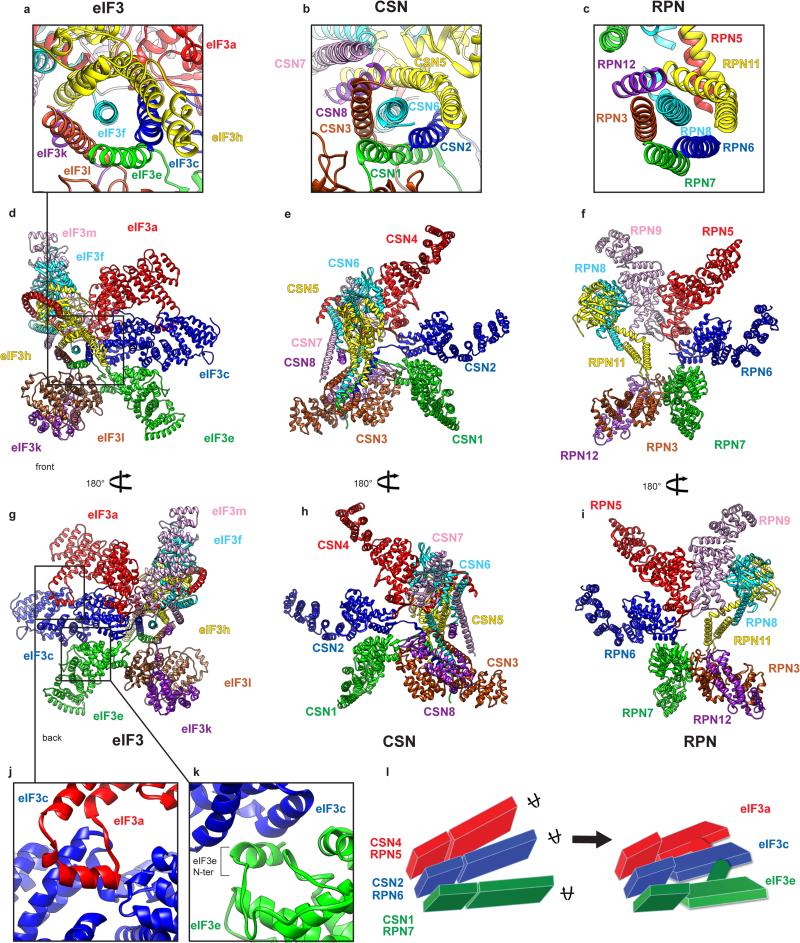
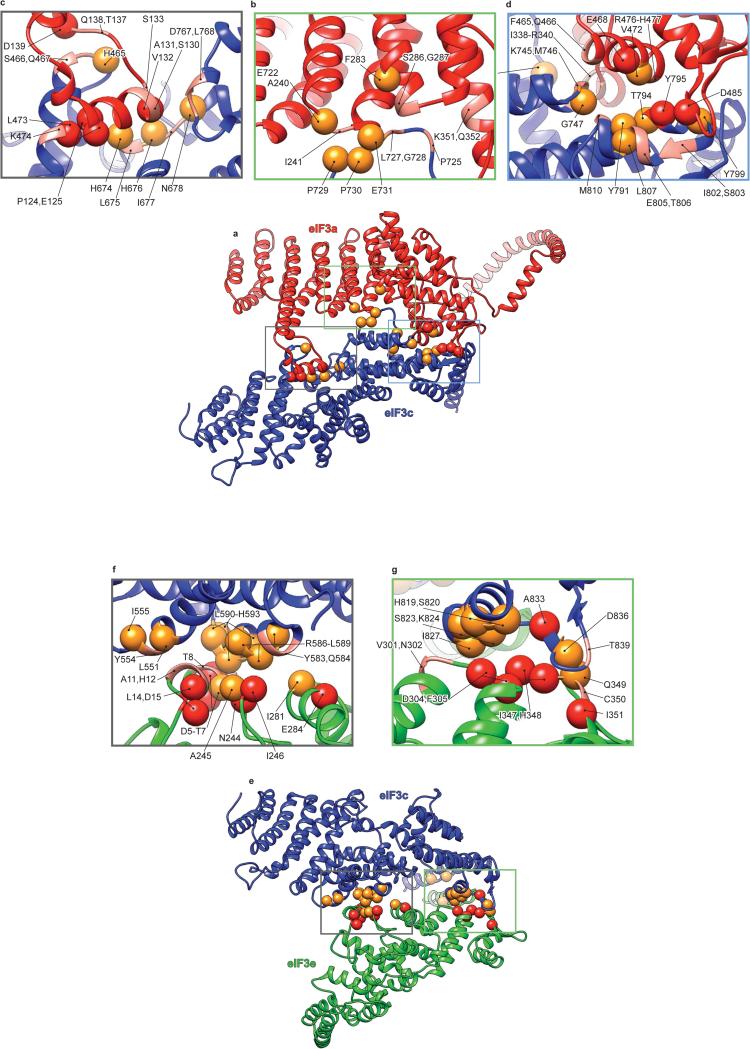
A comparison of our model of the PCI/MPN core of eIF3 with those of the proteasome lid and the COP9 signalosome (Extended Data Fig. 4d-i) revealed the existence of additional quaternary interactions between eIF3a and eIF3c, and between eIF3c and eIF3e (Fig. 2h-i, Extended Data Fig. 4j-k). eIF3a interacts through an insert between helices 5 and 6 with eIF3c in a cavity formed by helix 6, the coil between helices 7 and 8 and the coil between helices 14 and 15. The eIF3c-eIF3e interaction involves helix 11 of eIF3c and the N-terminal tail of eIF3e. These interactions rigidify the assembly of eIF3a, eIF3c, and eIF3e, and the rotation of their helical-repeat domains with respect to their WHDs (Extended Data Fig. 4l). Notably, the insert in mammalian eIF3a, which participates in the quaternary interaction, is lacking in yeast eIF3a. Mammalian eIF3a also possesses a more complex C-terminal helix following the PCI domain, which is involved in additional interactions with other core subunits (Figs. 1d, 2).
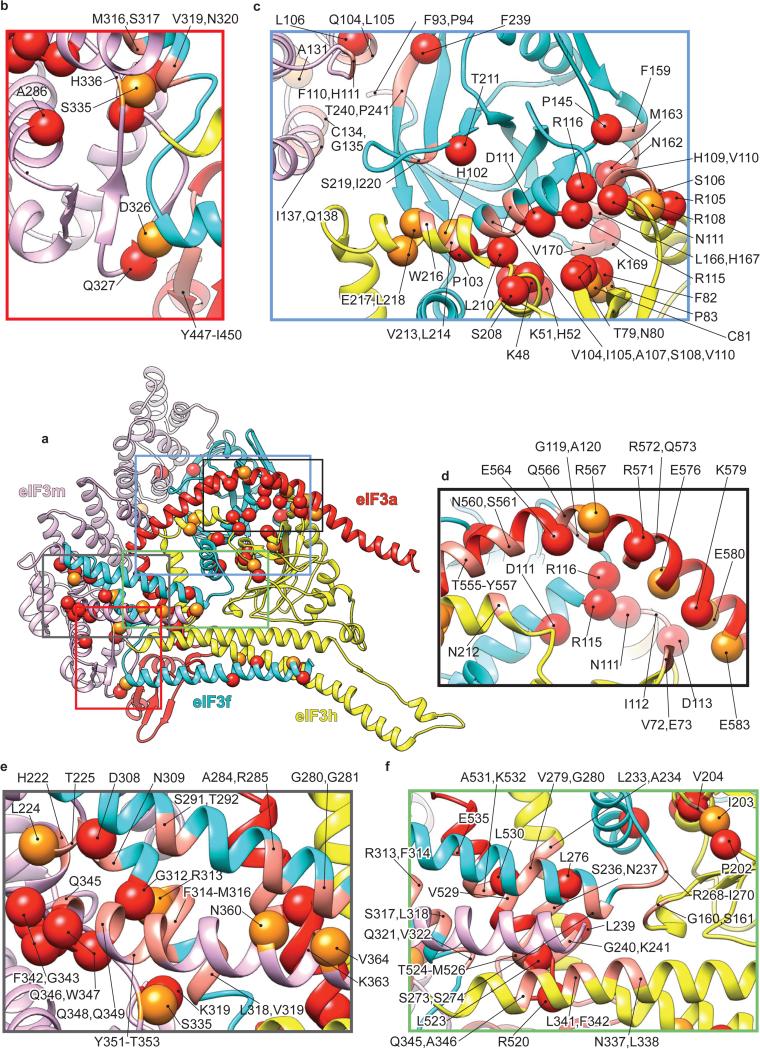
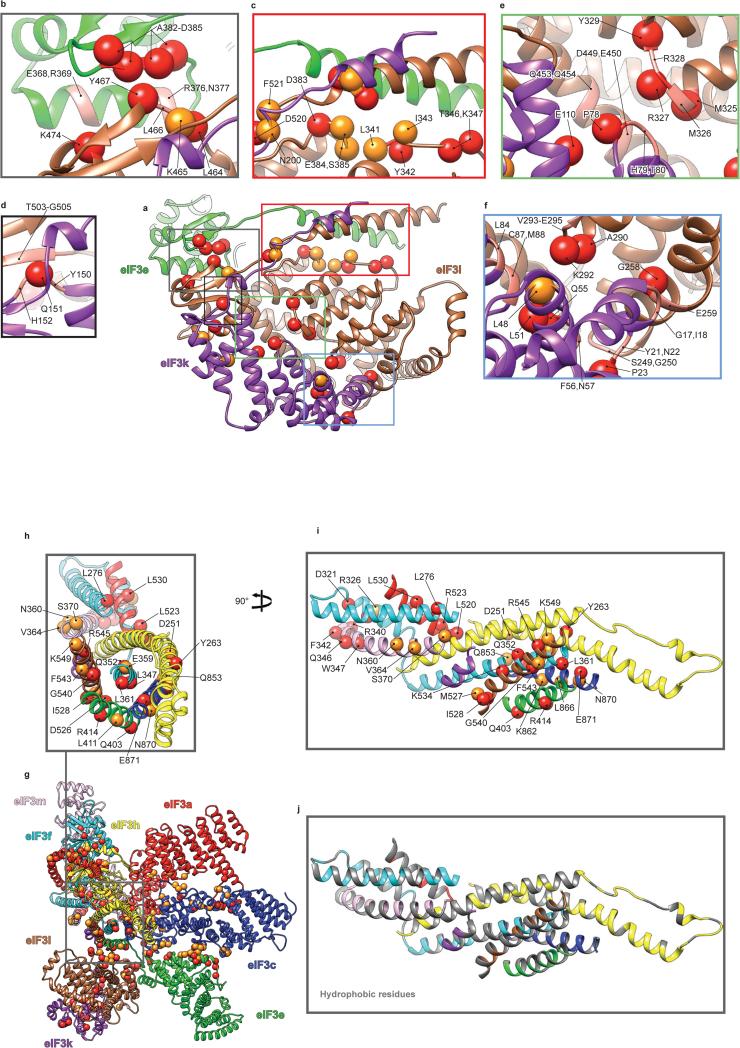
To validate our model, amino-acid conservation at the interfaces of core subunits was assessed among five multi-cellular (H. sapiens, C. elegans, X. tropicalis, A. thaliana and D. melanogaster) and one unicellular (N. crassa) organisms containing eIF3 with similar subunit composition (Supplementary Information, “Validation of eIF3 core model” and Extended Data Figs. 5-7). Importantly, the a-c and c-e interfaces involving the WHDs are conserved in multi-cellular organisms analyzed, but not in N. crassa. However, the additional quaternary interactions between these subunits are conserved even in N. crassa, suggesting their importance in lower eukaryotes that retain the octameric composition of the eIF3 core. The interfaces between the remaining subunits are conserved among all analyzed organisms with few exceptions in N. crassa.
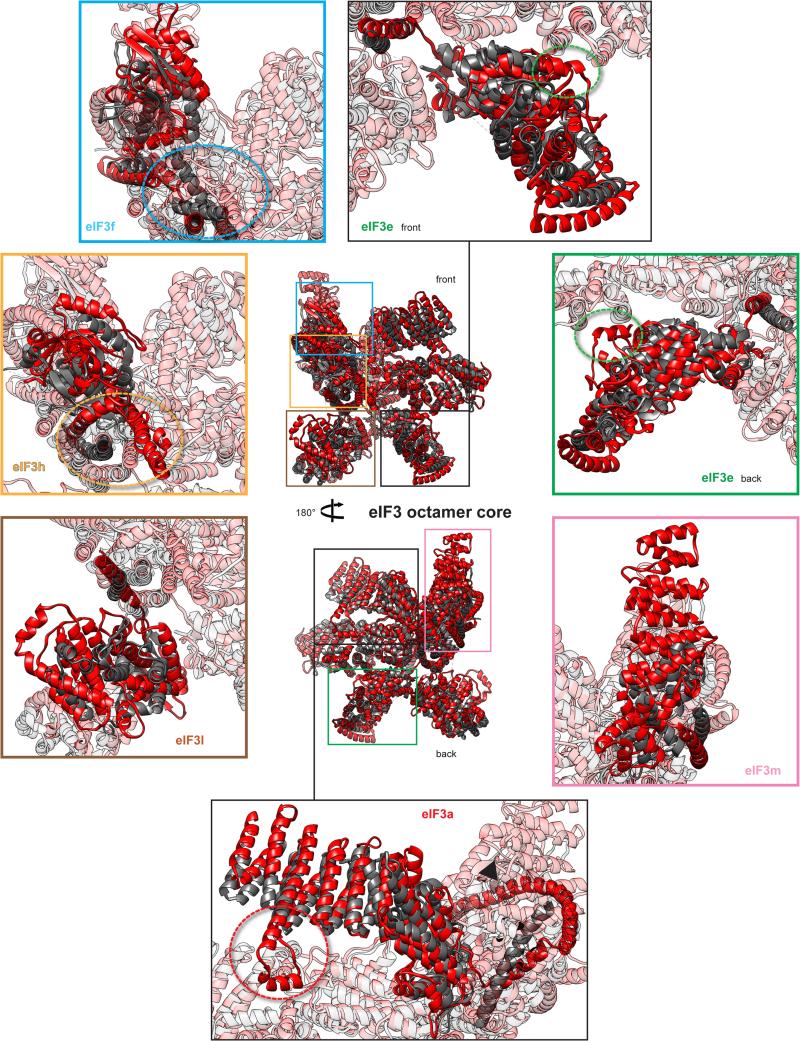
Our current model exhibits large discrepancies with a recent model17 based on low-resolution data concerning the structure and conformation of various core subunits (i.e. differences in the conformations of eIF3f, eIF3h and eIF3e, as well as in the structures of the C-terminal α-helices of eIF3f and eIF3h, the assignment of which was inverted in that model, thereby altering the structure of the 7-helix bundle) (Extended Data Fig. 8).
Ribosomal contacts of the PCI/MPN core
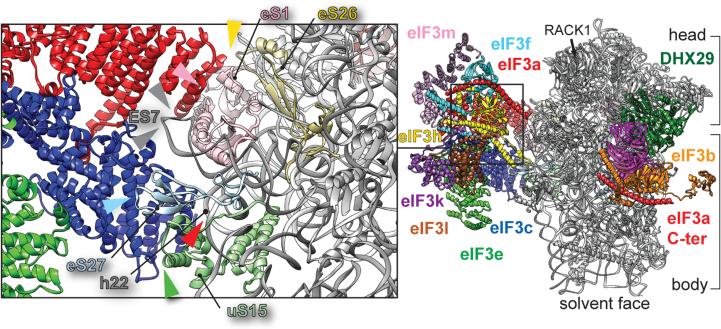
To identify residues in eIF3 core that directly contact components of the 43S complex, the atomic model of the human 40S subunit25, the crystal structure of the archaeal eIF2-TC26, and the homology model of the C-terminal two-thirds of DHX2927 were fitted into the density (Methods). Direct interactions of eIF3a and eIF3c with the 40S subunit were observed. eIF3a contacts rpeS1 and, marginally, rpeS26 (Fig. 4a, pink and yellow arrows), but also the apical loop of ES7S (Fig. 3, upper gray arrow). eIF3c interacts with rpeS27 and, marginally, with rpuS15 (Fig. 3, green and cyan arrows), but also with the apical loop of ES7S (Fig. 3, lower gray arrow) and h22 (Fig. 3, red arrow). A detailed list of interactions is presented in Extended Data Fig. 3b. They are consistent with those observed for S.cerevisiae eIF3a and eIF3c17, with the exception of the interaction between the C-terminus of yeast eIF3a and rpuS228-30, which is absent in the mammalian complex. Additionally, yeast eIF3a-eIF3c core is rotated by ~24° away from the platform and towards the solvent side in contrast to mammalian eIF328.
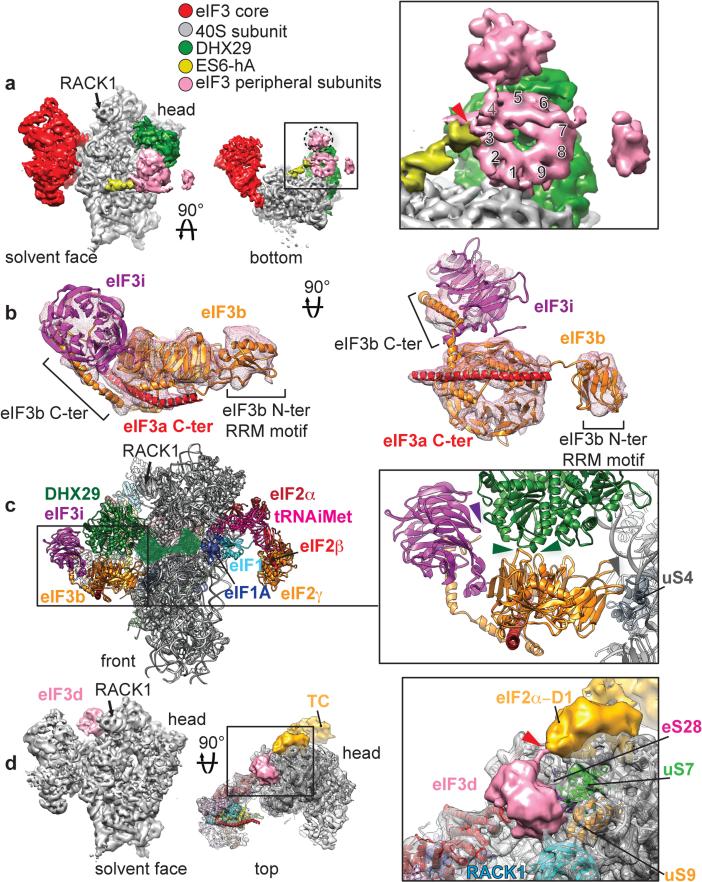
Fig. 4. Peripheral subunits of eIF3.
a, Segmented cryo-EM reconstruction focused on eIF3 peripheral subunits localized near the mRNA channel entry, below DHX29, seen from the solvent face (left) and from below (middle). Close-up view of eIF3 peripheral subunits seen from below (right), with a red arrowhead indicating the connection with ES6S-hA and numbers indicating the blades of the β-propeller structure. b Atomic model of rabbit eIF3b (orange), yeast eIF3i (purple) and a long α-helix (red) corresponding to a fragment of the C-terminal helical region (‘eIF3a C-ter’). c, Left, front view of eIF3b and eIF3i subunits bound to the 40S subunit and DHX29 in the context of the 43S complex. The remaining, unmodeled third of DHX29 is denoted as a transparent green surface, based on its cryo-EM density. Right, close-up view of the contact points between eIF3b and DHX29. The panel also shows eIF3i's interaction with DHX29. d, Left, segmented cryo-EM reconstruction focused on an eIF3 peripheral subunit tentatively identified as eIF3d, localized on the 40S head behind ribosomal protein RACK1. Middle, the same reconstruction seen from above, rendered in transparent with the atomic model of the human 40S subunit fitted in. Right, close-up view of the putative eIF3d subunit. Red arrow indicates a density bridging the globular domain of eIF3d to a density corresponding to the eIF2α-D1 domain, part of the eIF2-TC (density colored in gold). Colored arrowheads indicate the interaction of eIF3 peripheral subunits with various ribosomal proteins.
Fig. 3. Contacts of the eIF3 core with the 40S subunit in the 43S complex.
Solvent-side view of eIF3 bound to the DXH29-bound 43S complex. In black rectangle, close-up view of 40S/eIF3 core contacts. Colored arrowheads indicate the interaction of eIF3 core with ribosomal proteins and RNA.
Peripheral subunits of eIF3
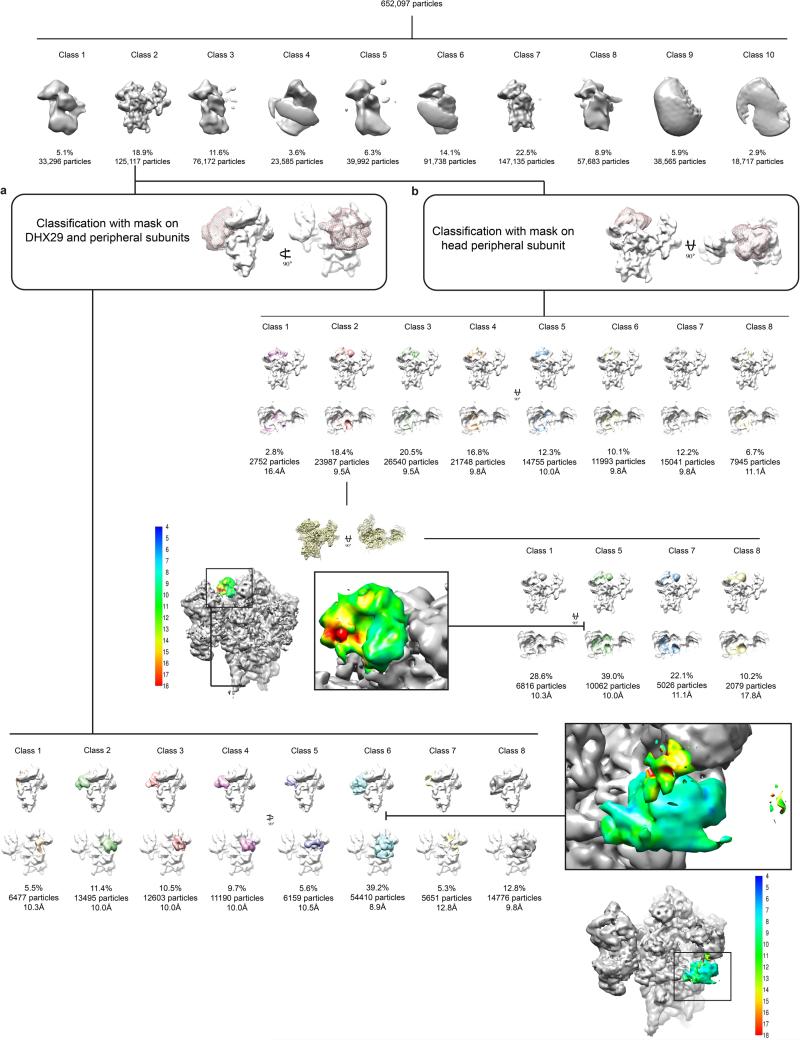
To improve the resolution in peripheral domains of eIF3, focused classification was applied to the regions where peripheral subunits are located (Extended Data Fig9. a and b), yielding reconstructions with local resolutions of ~9 Å and ~10 Å for regions of eIF3 near h16 and on the head next to RACK1, respectively.
Segmentation of density corresponding to eIF3's peripheral domains near h16 revealed a 9-bladed β-propeller structure (Fig. 4a), unambiguously attributed to the WD40 domain of eIF3b16,17. Density projecting from the WD40 domain towards the beak of the 40S subunit, in front of h16, corresponds to eIF3b's RRM domain. We have derived a homology model of residues 73-685 of rabbit eIF3b (~85%) (Fig. 4b). In the 43S complex, eIF3b binds through its C-terminal tail, after the WD40 domain (residues 626-631) to the 40S subunit at the tip of hA of ES6S (Fig. 4a, right panel, red arrow), and interacts with rpuS4 and DHX29 over a large surface (Fig. 4c, slate gray and green arrows) (Extended Data Fig.3b). The position of eIF3b in mammalian DHX29-bound 43S complexes7 is similar to that in yeast 40S/eIF3/eIF1/eIF1A complexes17, despite the absence of DHX29 in the latter.
The low-resolution density extending from the eIF3b WD40 domain away from the 40S subunit (Fig. 4a, dashed oval) was attributed to eIF3i, based on crystal structures of the latter with the C-terminal helix of yeast eIF3b15 and of the yeast eIF3b-CTD/eIF3i/eIF3g-NTD complex17, and the size and shape compatibility with our segmented density. In the 43S complex, eIF3i is seen to interact only with DHX29 (Fig. 4c, purple arrow). No density could be attributed to the eIF3g component of the eIF3g/eIF3b/eIF3i module because of the low local resolution in that region, likely due to the flexibility of this assembly.
The residues forming the long curved helix that interacts with eIF3b at its N- and C-termini (Fig. 4b, red helix) could not be determined with certainty because of its discontinuity with the eIF3 core. However, based on its curvature and the angle it forms with the core, it seems to extend from the C-terminal helix of eIF3a. This attribution is consistent with observations that eIF3a, eIF3b, eIF3i and eIF3g form a stable complex15,17-21, and with the existence of a Spectrin domain at eIF3a's C-terminal end, which mediates interactions with eIF3b and eIF3i19.
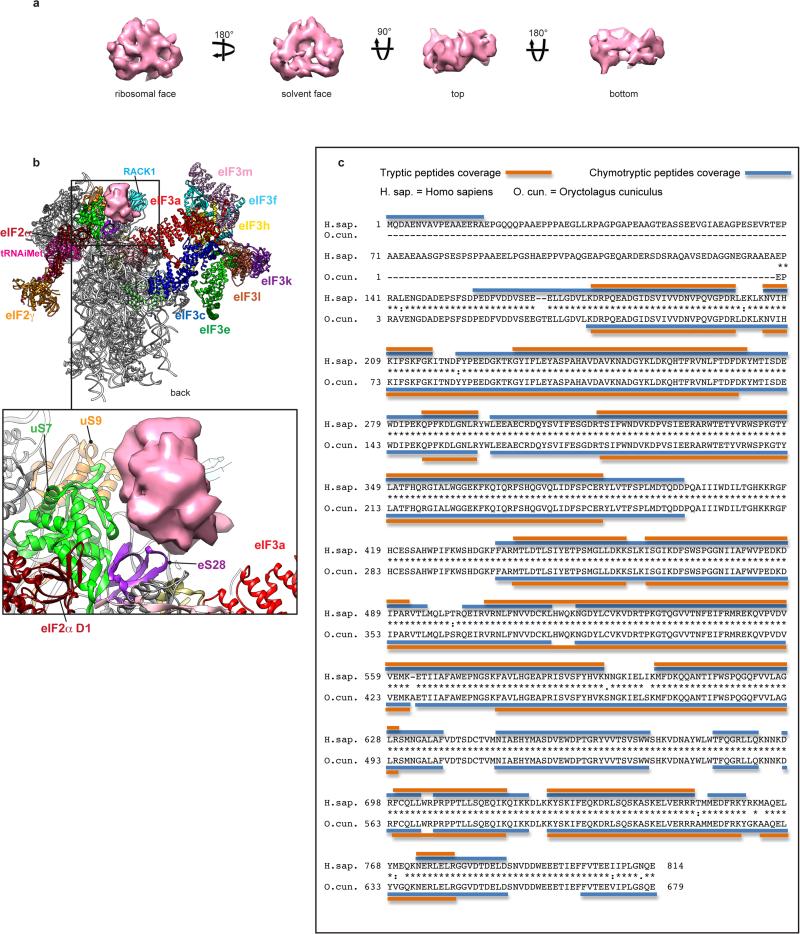
The second peripheral subunit-binding site, behind RACK1, displays a globular mass with a local resolution of ~10 Å and no resolved secondary structure features (Fig. 4d and Extended Data Fig. 10a), which adopts a flat triangular shape at an elevated density threshold. This mass was attributed to eIF3d, consistent with the latter's cross-linking with positions −8 to −17 on mRNA31 and because the only other unassigned subunit, eIF3g, constitutes part of the eIF3b/eIF3i/eIF3g module. According to our structure, eIF3d directly contacts RACK1, rpeS28, rpuS7 and rpuS9 (Fig. 4d, right panel, Extended Data Fig. 10b). Interestingly, it also appears to interact with the D1 domain of eIF2α, as seen at a lower density threshold (Fig. 4d, right panel, red arrow).
Discussion
Our reconstruction of mammalian eIF3 in the context of the DHX29-bound 43S complex enabled us to build a near-complete polyalanine-level model of eIF3's octameric PCI/MPN core and to determine the ribosomal positions of eleven of its twelve stoichiometrically-associated subunits (Fig. 5). eIF3 forms three regions of density corresponding to the PCI/MPN core, the eIF3b/eIF3i/eIF3g module, and eIF3d. The PCI/MPN core binds at the solvent side of the 40S subunit opposite to the platform, with eIF3a and eIF3c establishing two contact points. The eIF3b/eIF3i/eIF3g module resides at the mRNA entrance (with eIF3b interacting directly with the 40S subunit), and is connected to the core by the eIF3a-CTD. eIF3d is located near the mRNA exit, behind RACK1.
Fig. 5. Schematic representation of the arrangement of initiation factors and their subunits in the DHX29-bound 43S complex.
Figure includes only eIFs and subunits whose structures are known. The 40S subunit is depicted in gray surface; all other factors and subunits are labeled and colored variably. eIF3 helical bundles fortifying the intersubunit interactions are represented as cylinders. The 43S complex shown from a, the back, b, solvent side and c, front.
The model of the PCI/MPN core reveals its assembly and intersubunit interactions in mammalian eIF3 (Figs. 1, 2), which are likely conserved in other organisms possessing eIF3 with a similar octameric core. This model is consistent with reports concerning the interactions of individual subunits and the existence of their stable sub-complexes2,9,10,15,17-21, and with the finding that the functional core of mammalian eIF3 comprises one non-PCI/MPN subunit (b) and five PCI/MPN subunits (a, c, e, f, and h)21. Thus, whereas eIF3a, eIF3c and eIF3e are the central constituents of the PCI arc, the PCI subunits k, l and m reside at its extremities (Fig. 1b and d). Consistently, eIF3k and eIF3l are easily displaced from eIF318 and have been lost from the genome of some species32. eIF3m, which is not encoded in T. brucei and Leishmania33, can also be absent without major perturbation to the PCI arc. Importantly, the structure and arrangement of the “essential” PCI subunits (a, c and e) are further rigidified by the quaternary a-c and c-e interactions, inexistent between their counterparts in the proteasome lid and COP9 signalosome.
The large distance separating individual parts of eIF3 on the 40S subunit points to specialization of their functions. The main role of the PCI/MPN subunits seems to be scaffolding. It involves direct interaction with the 40S subunit, eIF128 and eIF4G34,35, and configuration of the non-core subunits within the same complex, while allowing them to interact with distant ribosomal regions. Interaction with eIF4G is essential and is thought to bridge the cap-binding complex, coupling its helicase activity with 43S complexes during attachment to mRNA and scanning. Initially, eIF4G was shown to interact with eIF3e34, but recent analysis revealed a second, adjacent site on eIF4G that binds to eIF3c and eIF3d35. This suggests that the binding site for eIF4G is located in a region of eIF3 where the c, d, and e subunits come into proximity. Although in our density map eIF3d is separated from the PCI/MPN core, at least part of the unassigned density at the core (Extended Data Fig. 1g, red density) could belong to eIF3d. Importantly, regarding the position of eIF3e in 43S complexes, its interaction with eIF4G is also consistent with hydroxyl radical cleavage in ES6S from the eIF4G middle domain36. Taken together, the structure of the eIF3 core and biochemical data on the eIF3-eIF4G interaction allow us to cautiously suggest that eIF4F could reside on the solvent side of the 43S complex, perhaps between the PCI/MPN core and the eIF3b/eIF3i/eIF3g module.
Regarding the function of the eIF3b/eIF3i/eIF3g module, various studies implicated its subunits in scanning. Thus, eIF3b was suggested to be involved in start-codon selection37,38, eIF3g in reinitiation by recycled 40S subunits39, while eIF3i and eIF3g were suggested to stimulate scanning39. The eIF3b/eIF3i/eIF3g module is situated at the mRNA channel entrance such that the mRNA would likely interact directly with module before entering its binding channel. Thus, these factors could form an extension of the entrance portion of the mRNA channel, facilitating mRNA entry and maintaining its position during scanning. eIF3b could also influence the conformation of h16, as it binds at its base. It is thus possible that one role of the eIF3b/eIF3i/eIF3g module is to maintain the mRNA entrance in a specific conformation. eIF3b also has a large interacting surface with DHX29. DHX29 most likely stimulates scanning indirectly, by inducing conformational changes in 43S complexes27,40. Interaction with eIF3b could therefore establish proper ribosomal positioning of DHX29 and possibly also transmit to the 40S subunit conformational changes that are induced in DHX29 upon NTP hydrolysis.
As for eIF3d, in addition to interaction with eIF4G35, its location near the mRNA exit and cross-linking to mRNA31 suggest that it might also participate in extending the exit portion of the mRNA channel.
In conclusion, our model provides a detailed view of the structure of mammalian eIF3 and of its interactions with components of the DHX29-bound 43S complex. It will serve as a framework for further elucidation of individual steps in eukaryotic translation initiation, which is crucial to a better understanding of translational control.
METHODS
Purification of 40S ribosomal subunits, initiation factors, DHX29 and aminoacylation of tRNAiMet
The exact protocols have been described previously7.
Assembly and purification of 43S-DHX29 preinitiation complexes
The exact protocols have been described previously7.
Electron microscopy
Three μL of each sample was applied to holey carbon grids (carbon-coated Quantifoil 2/4 grid, Quantifoil Micro Tools GmbH, Großlöbichau, Germany) containing an additional continuous thin layer of carbon41 without prior plasma cleaning. Grids were blotted and vitrified by rapidly plunging into liquid ethane at −180°C with a Vitrobot Mark IV (FEI, Portland, OR)42. Data acquisition was done under low-dose conditions (25 e−/Å2)43 on a FEI Tecnai F30 Polara (FEI) operating at 300 kV. The dataset was collected with the automated data collection system Leginon44 at a calibrated magnification of 30,120x on a Gatan K2 Summit direct electron detection camera with a pixel size of 1.66 Å on the object scale. 11,274 micrographs were recorded in electron-counting, dose-fractionation mode as a series of 20 frames, with an accumulation time of 0.4 s per frame. The dose rate was set to 8 counts per physical pixel per second (~10e− pixel−1 s−1). The total exposure time was 8 s, leading to a total accumulated dose of approximately 25 e− Å−2 on the specimen.
Image processing
Dose-fractionated image stacks were aligned using dosefgpu_driftcorr45 and the sum of frames 3 to 20 in each image stack was used for further processing. The first two frames were omitted as they contained motions greater than 4 Å per frame on average. The data were then preprocessed using pySPIDER and Arachnid (http://www.arachnid.us)7. Arachnid is a Python-encapsulated version of SPIDER46 replacing SPIDER batch files with Python scripts. It also contains novel procedures such as Autopicker47, which was used for fully automated particle selection. ~652,000 particles were extracted from the dataset. These particles were classified with RELION48, yielding two high-quality classes containing 272,252 particles, or ~42% of the dataset. The remaining particles were rejected (Extended Data Fig. 2). One class (19% of the particles) displays a 40S ribosomal subunit with eIF3 and the eIF2-Met-tRNAiMet ternary complex bound, while the other (23% of the particles) displays a bare 40S ribosomal subunit. The class containing eIF3 was further classified, and all classes showing eIF3 with a density of good quality were pooled together (84,850 particles) and refined to a resolution of 6.2 Å (Extended Data Fig. 1b). Reported resolutions were calculated with the FSC = 0.143 criterion49 using the “gold-standard” protocol, ensuring independence of half-set reconstructions. The reported resolution measurements were corrected for the effects of a soft mask on the FSC curve using high-resolution noise substitution50. Before visualization, all density maps were sharpened by applying a negative B-factor that was estimated using automated procedures49. The local resolution, as measured using the program ResMap51, varies between 5-12 Å across most of the map (Extended Data Fig. 2d and f). Particles were then realigned to the eIF3 core as a reference using a soft mask around eIF3 core subunits. This procedure improved the resolution of the more distal regions of eIF3 and resulted in a map of eIF3 core subunits at local resolutions estimated by ResMap to be between 6 Å for most of eIF3 core and up to 8 Å (Extended Data Fig. 2c and e.). These two maps were used for modeling the eIF3 core subunits. Next, focused classification was performed to isolate eIF3 peripheral subunits in two locations: in the vicinity of DHX29 and at the back of the ribosome head, close to RACK1. In the focused classification, we used masks with smooth edges created by UCSF Chimera52 and SEGGER53, and encompassing large regions around the regions of interest (Extended Data Fig. 9). To avoid diverging orientation assignments during the Relion classification, due to the small volume encompassed by the mask compared to the total volume, particle orientation assignments were kept fixed. The classification with a mask in the region of DHX29 gave one major class (51% of the particles) with well-defined eIF3 peripheral subunits in the vicinity of DHX29 (Extended Data Fig. 9a), which was subsequently refined to a resolution of 7.1Å (Extended Data Fig. 1b). The classification with a mask around the back of the 40S head gave one class (18% of the particles) with a strong density in this region, in contact with RACK1 (Extended Data Fig. 9b). Further classification of particles in this class reduced the conformational variability of the density and isolated one major conformer (39% of the remaining particles). This class of particles, a total of 10,062 particles, yielded a reconstruction at 7.7 Å (Extended Data Fig. 1b).
Identification and annotation of eIF3 domains
The different domains of eIF3's constituent subunits were annotated (Extended Data Fig. 1a) based on our eIF3 polyalanine-level model where possible. Thus, the coordinates of the WD40, RRM and PCI domains were annotated based on our model. Alternatively, eIF3 domains were detected mainly using the conserved domain detector (CDD) tool54, which produces a graphical display of conserved domains identified in the protein using RPS-BLAST, and the InterPro, protein sequence analysis and classification online tool55. The annotation relies on the top-scoring hits by default and represents a good approximation of the domain coordinates. The sequences of rabbit eIF3 subunits used for domain detection had the following accession numbers: gi|655868267 for eIF3a, gi|291390868 for eIF3c, gi|655763812 for eIF3d, gi|291388413 for eIF3e, gi|655602713 for eIF3f, gi|655743367 for eIF3g, gi|291388434 for eIF3h, gi|75070231 for eIF3i, gi|655862979 for eIF3j, gi|291390078 for eIF3k, gi|291414663 for eIF3l and gi|291384781 for eIF3m. Note that the human eIF3b sequence (gi|83367072) was used rather than the rabbit sequence, because our nanoLC-MS/MS analysis (Extended Data Fig.10c) raised doubts concerning the length of the N-terminal region of the latter shown in currently available database entries. In addition to domains identified using CDD (Extended Data Fig. 1a), a Spectrin domain was added to eIF3a19 and a Zinc-binding domain was added to eIF3g56.
In-gel protein digestion for nanoLC-MS/MS analysis
The protocol has been described previously57. Briefly, SDS-PAGE bands were excised from the gel and transferred into 96-well microtitration plates. The bands were then destained and dehydrated. Gel pieces were washed again with the destaining solutions and then incubated with trypsin (Promega, Madison, WI) and chymotrypsin (Promega) for digestion overnight at room temperature. The resulting peptides were extracted from the gel pieces. The initial digestion and extraction supernatants were pooled together and vacuum-dried in a SpeedVac concentrator.
Nano-liquid chromatography – electrospray ionization tripleTOF MS/MS analysis
Dried tryptic digests were resuspended in 12 μL of water containing 0.1% formic acid (FA) (solvent A) before analysis on a NanoLC-2DPlus system (with nanoFlex ChiP module; Eksigent, Sciex Separations, Concord, Ontario, Canada) coupled to a TripleTOF 5600 mass spectrometer (AB Sciex) operating in positive mode. 5μL of each sample were loaded on a ChIP C-18 precolumn (300 μm ID × 5 mm ChromXP; Eksigent) at 2 μL/min in solvent A. After 10 min of desalting and concentration in the trap, the system was switched online with the analytical ChIP C-18 analytical column (75 μm ID × 15 cm ChromXP; Eksigent) equilibrated in 95% solvent A and 5% solvent B (0.1% formic acid in acetonitrile (ACN). Peptides were eluted by using a 5%-40% gradient of solvent B for 60 min at a 300 nL/min flow rate. The TripleTOF 5600 was operated in data-dependant acquisition mode with Analyst software (version 1.5, ABSciex). Survey MS scans were acquired during 250 msec in the 400-1250 m/z range. Up to 20 of the most intense multiply charged ions (2+ to 5+) were selected for CID (Collision-Induced Dissociation) fragmentation, if they exceeded the 150 counts per second intensity threshold. Ions were fragmented using a rolling collision energy within a 60 ms accumulation time and an exclusion time of 15 s. This so-called “Top20” method, with a constant cycle time of 1.5 s, was set in high-sensitivity mode.
To obtain optimal mass accuracy, a β-galactosidase digest (AB Sciex) was injected before each sample using the “Autocal” feature from Analyst software: calibration was performed using the 10 more abundant peptides in MS mode and with the 729.3652 m/z precursor in MS/MS mode. Moreover, to prevent carry-over due to stationary phase memory, two consecutive washing runs were performed after each sample injection, as well as a blank injection (solvent A) to verify that no peptides were identified due to a carry-over phenomenon.
Database search and data analysis
The protocol has been described previously57. Data were searched against the complete human and rabbit proteomes set from the SwissProt database. The algorithm used for database search was Mascot58 (version 2.2, Matrix Science, London, UK) through the ProteinScape package59 (v3.1, Bruker). Peptide modifications allowed during the search were: N-acetyl (protein), carbamidomethylation (C) and oxidation (M). Mass tolerances in MS and MS/MS were set to 30 ppm and 0.5 Da, respectively, and the instrument setting was specified as ESI-QUAD-TOF. Three trypsin or chymotrypsin missed cleavages were allowed. A decoy database strategy60 was employed to validate Mascot identifications at FDR <1% (individual identity scores varied between 30 and 34 for each data search) using the ProteinScape Protein Assessment tool. Data were further validated by manually inspecting the quality of the MS/MS fragmentation spectra: a minimum of five consecutive amino acids was requested to validate the spectrum, as well as other rules (proline specific fragmentation pattern, major peaks assigned to fragments, and so on). To compare the position of the validated peptides on the full-length sequences of the different proteins, the Protein Sequence viewer from ProteinScape package was used. Moreover, to obtain maximal sequence coverage on the identified proteins, a second round of database search was set up without defining enzyme specificity: semi-tryptic or non-tryptic peptides were thus highlighted in the trypsin digest analysis, as for the SDS-PAGE bands digested by chymotrypsin.
Segmentation and display of density maps
Cryo-EM reconstructions were segmented using the SEGGER module53 implemented in UCSF Chimera52. Segments counting less than 10,000 voxels were discarded. Segments were refined manually using the VOLUME ERASER module implemented in UCSF Chimera. Finally, the segments obtained were smoothed using a Gaussian filter in the VOLUME FILTER module also implemented in Chimera. The final maps were displayed and rendered with Chimera.
Atomic modeling of eIF3
We were able to model residues 7-605 of eIF3a (~43%), 320-876 of eIF3c (~61%), 4-422 of eIF3e (~94%), 93-364 of eIF3f (~75%), 29-352 of eIF3h (~92%), 2-216 of eIF3k (~98%), 181-552 of eIF3l (~66%) and 7-370 of eIF3m (~97%). To generate an atomic model of eIF3, each subunit was separately modeled into its corresponding density segment. We should stress that our cryo-EM map does not allow atomic modeling of side-chains and exact residue registration, and therefore our model of eIF3 should be considered as a polyalanine-level model. eIF3a was modeled by homology to crystal structures of S. cerevisiae eIF3a17,61. The additional long helix in the C-terminal tail was modeled ab initio by first predicting its secondary structure using the SYMPRED web service tool (http://www.ibi.vu.nl/programs/sympredwww/), and then generating the predicted long helix in SWISS-MODEL62. The 3D structure generated was then fitted into its cryo-EM density in UCSF Chimera52 by manually modifying the backbone torsion angles using the ADJUST TORSION module implemented in Chimera. The structure of the whole subunit was then refitted using molecular dynamics flexible fitting as described in the next section.
Similarly, eIF3c was modeled by homology to the crystal structure of its S. cerevisiae counterpart17. The variant parts of its structure along with the helix in the C-terminus tail were modeled as described above for eIF3a. Rabbit eIF3k was modeled entirely by homology to the crystal structure of human eIF3k63. The X-ray structures of the human COP9 subunits CSN1, CSN5 and CSN613 were used as templates for modeling rabbit eIF3e, eIF3h and eIF3f; the variant parts of the latter subunits, compared to their modeling templates, were modeled according to the method described above for eIF3a, regarding the modeling of the C-terminal helical tails. Modeling of the remaining eIF3m and eIF3l subunits was based mainly on the atomic model of the proteasome lid subunits RPN9 and RPN311 owing to their closely related topology, as indicated by our cryo-EM reconstruction, and variant parts were modeled ab initio according to the method described for eIF3a. For most parts that were modeled ab initio, the secondary structure elements predicted and validated by the cryo-EM reconstruction map were helical.
As for eIF3 peripheral subunits, based on our density map, the crystal structures of the eIF3b WD40 domain from Chaetomium thermophilum16, the C-terminal helical domain of S. cerevisiae eIF3b in complex with eIF3i (7-bladed β-propeller)15 and the solution NMR structure of the RNA recognition motif (RRM) domain of the N-terminal end of human eIF3b14, were used to derive a homology model of nearly the full eIF3b from rabbit (residues 73-685, ~85%, using the rabbit eIF3b sequence16, gi|291415469). This fragment corresponds to residues 170-782 of human eIF3b: for further discussion of the eIF3b sequence see Extended Data Fig. 10c. Yeast eIF3i crystal structure15 was rigid-body fitted using the FIT IN MAP module implemented in Chimera52. We did not attempt to generate a homology model of rabbit eIF3i due to the low local resolution of the cryo-EM reconstruction in that region and simply fitted the crystal structure of yeast eIF3i as a rigid body.
Fitting of atomic structures into EM maps
After the construction of the eIF3 polyalanine-level model, it was placed into its cryo-EM density map along with the atomic model of the 40S subunit of the human ribosome25 by rigid-body fitting using Chimera as described above. Remaining parts of the 43S cryo-EM density map corresponding to the eIF2-ternary complex, eIF3b, eIF3i and DHX29 were simply segmented out using the VOLUME ERASER module implemented in UCSF Chimera. Starting from this system, everything was flexibly fitted into the map using MDFF (molecular dynamics flexible fitting)64 as described in previous work65. Briefly, the initial system was prepared for MDFF using VMD66 and the trajectories run in NAMD66,67. In order to achieve a better representation of the inter- and intra-molecular interactions, the system was embedded in a solvent box of TIP3P water molecules, with an extra 12 Å padding in each direction, and neutralized by potassium ions, and an excess of ~0.2 M KCl was added. The simulated system was prepared using CHARMM force field parameters (Combined CHARMM All-Hydrogen Topology File for CHARMM22 Proteins and CHARMM27 Lipids)67,68. The trajectories were run in explicit solvent. The run was stopped at 600 ps of simulation time.
Extended Data
Extended Data Fig. 1. Domain organization of the eIF3 subunits and resolution of eIF3 core.
a, Schematic representation of the domain organization of the rabbit eIF3 subunits (see Methods). Domain boundaries are indicated, and based where possible on our polyalanine-level model of eIF3. Z = Zinc-recognition motif, HD = helical domain. Dashed line in eIF3l subunit diagram indicates that the HD might extend further in the N-terminus but it was not possible to be conclusive based on our density map. b, Fourier shell correlation (FSC) of the different 43S complex reconstructions used during analysis. The resolution estimation followed the “gold standard” protocol ensuring independence of the half-set reconstructions. x-axis, resolution in Å; y-axis, FSC. 43S complexes including particles that present the eIF3 core subunits (green line). 43S complexes including all particles presenting DHX29 and the eIF3 peripheral subunits b, g and i (blue line). 43S complexes including all particles presenting the density attributed to eIF3d (red line). For each reconstruction, a dashed line marks the resolution at which the FSC reaches the value of 0.143. c to f, Qualitative comparison of eIF3 core resolution in the present and in previous structures. c and d, eIF3 core cryo-EM structure from our previous study at 11.6 Å (ref. 7). e and f, eIF3 core cryo-EM structure from the present study at 6 Å after focused refinement. eIF3 core is labeled according to the anthropomorphic nomenclature. g, Unassigned density region of the eIF3 core cryo-EM structure, colored in red, seen from three different orientations. The green surface represents most of the core region that was modeled.
Extended Data Fig. 2. Sorting of particle images and focused refinement of the 5-lobed core of eIF3.
a, Composition of eIF3 purified from RRL for assembly of 43S complexes, resolved by SDS-PAGE and analyzed by nanoLC-MS/MS to characterize truncation of eIF3a and eIF3c due to endoproteolytic cleavage. The intensity of labels in this panel reflects the intensity of bands corresponding to the truncated forms of eIF3a and eIF3c. The sequence of rabbit eIF3b has not been conclusively established (see Extended Data Fig. 16) and numbering therefore refers to human eIF3b. b, Overview of the process of sorting particle images. The population of each class is indicated by the number of particles and the percentage of the total number of particles at the beginning of each of the two classification rounds. The DHX29-bound 43S complex was processed from a total of ~650,000 particle images, which were first sorted into ten different classes. Class 2 (~125,000 particles) was sorted into ten subclasses, which are displayed in four different orientations, showing the intersubunit face, front, solvent side and bottom, respectively. Classes 2-7 and 9 from the second classification round were pooled and refined yielding a reconstruction presenting a variable resolution ranging from 4.5-15 Å (bottom right). d and f, Cryo-EM reconstruction of the 43S complex, colored according to the local resolution as measured using ResMap (see Methods). The red and black boxes correspond to close-up views of the eIF3 core viewed from (d) the intersubunit face and (f) the solvent face of the 40S subunit. c and e, CryoEM reconstruction of the eIF3 core after focused refinement, colored according to the local resolution as measured using ResMap. Maps in c-f are filtered to 6 Å.
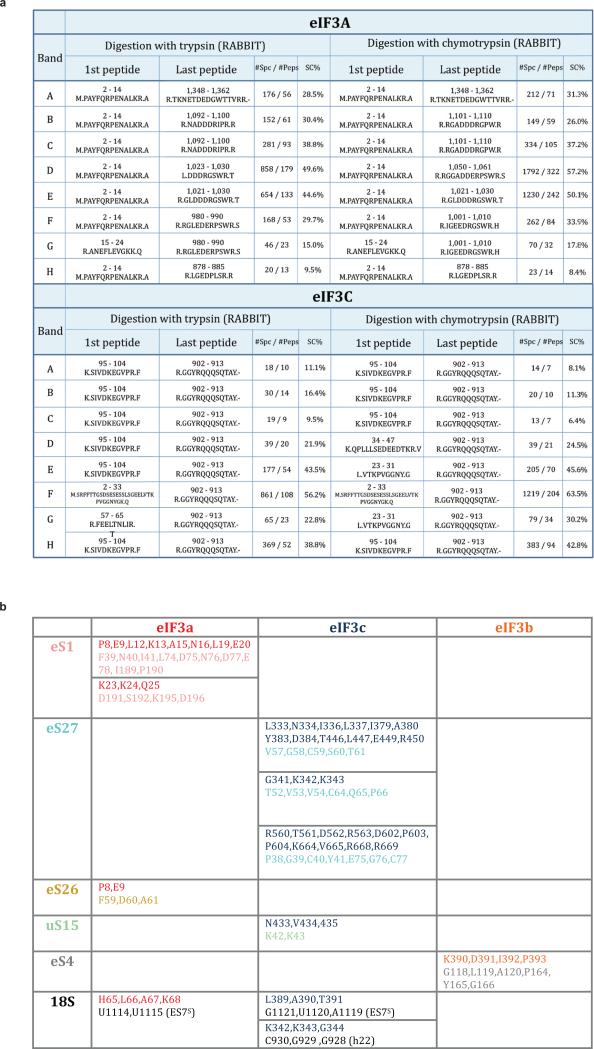
Extended Data Fig. 3. Peptide analysis of eIF3 a and c subunits after digestion and details of interactions between eIF3 and the 40S small ribosomal subunit.
a, Peptide analysis of eIF3 a and c subunits, for each band of the gel the first and last identified peptides from eIF3 a and c subunits are indicated, after both types of digestions, in trypsin and chymotrypsin. The NanoLC-MS/MS analysis reveals the different forms of eIF3 a and c subunits in our in vitro reconstituted 43S preinitiation complex. #Spc = number of specters, #Peps = number of peptides. b, details of interactions between eIF3 and the 40S small ribosomal subunit. The name and sequential number of interacting residues on each side, eIF3 and the 40S, is given in the table. Residue names are colored variably to distinguish them according to their origin.
Extended Data Fig. 4. Comparison of the structure of the mammalian eIF3 core with the structures of the COP9 signalosome and 26S proteasome lid molecules.
a-c, close-up views of the helical bundles of eIF3, COP9 and 26S lid molecules. d-i, All three molecules shown in two different orientations. Different constitutive subunits are labeled and colored variably. Homologous subunits among all three molecules are shaded using the same color in all panels. j and k, Additional quaternary interactions between eIF3a and eIF3c, and between eIF3c and eIF3e, which occur neither in COP9 nor in 26S lid molecules. l, Consequence of these additional quaternary interactions on the structure of eIF3 subunits a, c and e, schematized as rectangles. Black arrows around axes describe the rotation of the helical domains of subunits a, c and e relatively to their respective PCI domains, due to the existence of these additional quaternary interactions, compared to COP9 and 26S lid molecules.
Extended Data Fig. 5. Conservation of quaternary interactions between eIF3a and eIF3c subunits, and between eIF3c and eIF3e subunits.
a, ribbon representation of eIF3a and eIF3c subunits. b-d, Close-up views of contact regions between eIF3a and eIF3c. e, ribbon representation of eIF3 c and e subunits. f and g, Close-up views of contact regions between subunits c and e of eIF3. Red spheres represent residues at the interfaces that are conserved in eIF3 from six representative eukaryotic organisms; H. sapiens, C. elegans, A. thaliana, D. melanogaster, X. tropicalis, which are very different multicellular eukaryotic organisms, and N. crassa, a unicellular organism. These organisms all have a full complement of 13 eIF3 subunits. Orange spheres represent residues at the interfaces that are conserved only in the five multicellular eukaryotic organisms. The remaining residues that are suggested by the model and the density map to be involved in quaternary interactions are represented as ribbons in salmon color. Many of these other residues are conserved in three or four of the compared organisms, but almost all of them have conserved chemical properties.
Extended Data Fig. 6. Conservation of quaternary interactions between eIF3 subunits a, m, f and h.
a, In center, eIF3 a, m, f and h subunits. b-f, Close-up views of contact regions between subunits a, m, f and h of eIF3. Red spheres represent residues at the interfaces that are conserved in six representative eukaryotic organisms; H. sapiens, C. elegans, A. thaliana, D. melanogaster, X. tropicalis and the unicellular N. crassa. Orange spheres represent residues at the interfaces that are conserved only in the five multi-cellular eukaryotic organisms. The remaining residues that are suggested by the model and the density map to be involved in quaternary interactions are represented as ribbons in salmon color. Many of these other residues are conserved in three or four of the compared organisms, but almost all of them have conserved chemical properties.
Extended Data Fig. 7. Conservation of quaternary interactions between eIF3 subunits e, k and l, and between eIF3 subunits in the region of the helical bundle.
a, ribbon representation of eIF3 e, k and l subunits. b-f, Close-up views of contact regions between subunits e, k and l of eIF3. g, ribbon representation of eIF3 octamer core. h, Close-up views of contact regions between subunits a, c, e, m, f, h, k and l of eIF3 in the helical bundle region, seen from the direction of the axis of the latter. i, Region displayed in b rotated by 90° Red spheres represent residues at the interfaces that are conserved in six representative eukaryotic organisms; H. sapiens, C. elegans, A. thaliana, D. melanogaster, X. tropicalis and the unicellular N. crassa. Orange spheres represent residues at the interfaces that are conserved only in the five multi-cellular eukaryotic organisms. The remaining residues that are suggested by the model and the density map to be involved in quaternary interactions are represented as ribbons in Salmon color. Many of these other residues are conserved in three or four of the compared organisms, but almost all of them have conserved chemical properties. j, Same view as in i displaying all the hydrophobic residues of the helical bundle region in silver ribbons. The abundance of hydrophobic residues in the helical bundle at the interfaces of different helices suggests the stabilization of the bundle though hydrophobic interactions, hence the low identity conservation of residues at the interfaces.
Extended Data Fig. 8. Comparison of the mammalian eIF3 core model built from the 6 Å cryo-EM reconstruction with a model based on low-resolution cryo-EM studies.
In center, our polyalanine-level model of the mammalian eIF3 octamer core (represented in red ribbons) fitted on the atomic model proposed by Erzberger et al.18 (represented in dark gray ribbons), shown in two different orientations. The surrounding panels are close-up views of different constitutive subunits, highlighting significant structural differences between the previously proposed model18 and the model proposed in this study. Gold- and cyan-dashed ovals highlight the misassignment of several helices of the helical bundle belonging to the C-termini of subunits h and f, respectively, in the previously proposed model. Red-, green-dashed circles and black arrow highlight the absence in the previously proposed model of important structural features involved in quaternary interactions. In each panel, the remaining subunits of the eIF3 core octamer are faded out as transparent ribbons.
Extended Data Fig. 9. Sorting of particle images and focused classification of eIF3 peripheral subunits near the mRNA channel entrance and exit.
a, Overview of the process of sorting particle images. The population of each class is indicated by the number of particles and the percentage of the total number of particles at the beginning of each of the classification rounds. After the first round of classification, class 2 stands out as the class displaying eIF3. Focused classification of eIF3 peripheral subunits, near the mRNA channel entrance, was performed by applying a smooth-edge mask corresponding to the shape of the concerned subunits of eIF3 and to a region of the 43S complex encompassing DHX29 and h16 of the 40S subunit. The mask is displayed as pink mesh. The resulting classes from the focused sorting of class 2 of the first classification round are displayed in two different orientations, front and solvent side, respectively. Class 6 from the second classification round presents the most solid and complete density of the peripheral subunits of eIF3 at this region of the complex, and it was therefore refined yielding a reconstruction presenting an average resolution of 7.1 Å. Cryo-EM reconstruction of eIF3b and eIF3i along with DHX29, colored by local resolution.
b, After the first round of classification, on class 2, focused classification of an eIF3 peripheral subunit, identified as eIF3d, near the mRNA channel exit behind ribosomal protein RACK1, was performed by applying a smooth-edge mask corresponding to the shape of the concerned subunit of eIF3 and to a region of the head of the 40S subunit encompassing RACK1. The mask is displayed as pink mesh. The resulting classes from the focused sorting of class 2 of the first classification round are displayed in two different orientations, intersubunit face and top, respectively. Class 2 from the second round of classification presents the most solid and complete density of the peripheral subunit of eIF3 at this region of the complex, but due to some apparent heterogeneity in eIF3d, a third classification round was required, yielding four classes displaying a solid eIF3d subunit in slightly different conformations (other classes obtained in this third round of classification were completely empty and therefore not shown). The major class (39% of the particles in this round) yielded a reconstruction presenting an average resolution of 7.7 Å. Cryo-EM reconstruction of eIF3d, colored by local resolution.
Extended Data Fig. 10. Shape and ribosomal binding site of eIF3d, and eIF3b sequence.
a, Segmented cryo-EM reconstruction of the peripheral eIF3d subunit localized on the head of the 40S subunit, behind ribosomal protein RACK1, displayed at a high density threshold in order to show its most solid features, in four different orientations. b, eIF3d subunit in the context of the 43S preinitiation complex, seen from the back, showing the ribosomal proteins that contact it directly. This figure is complementary to Fig. 4c as it displays the same complex in a different orientation. This panel shows contacts between eIF3d subunit and ribosomal proteins eS28, uS7 and uS9. Contacts with RACK1 cannot be seen from this orientation. c, eIF3b sequence. The amino acid sequences of human eIF3b (GenBank NP_003742.2) and rabbit eIF3b (UniProt G1SZ03_RABIT) aligned using T_COFFEE (http://www.ebi.ac.uk/Tools/msa/tcoffee/) and annotated to show identity with tryptic and chymotryptic peptides derived from purified rabbit eIF3 and identified by nanoLC-MS/MS analysis. The complete sequence of rabbit eIF3b has not been determined, but clearly extends beyond the N-terminus of G1SZ03_RABIT, and we therefore used the numbering of residues in human eIF3b when referring in the text to elements of rabbit eIF3b.
Supplementary Material
Acknowledgements
We thank R.A. Grassucci for helping in collecting the EM images, H. Kao for help with computations, and the proteomic platform Strasbourg-Esplanade for conducting the nanoLS-MS/MS analysis. This work was supported by both HHMI and NIH R01 GM29169 (to J.F.) and NIH R01 GM59660 (to T.V.P.). This work has been published under the framework of the LABEX : ANR-10-LABX-0036_NETRNA and benefits from funding from the state managed by the French National Research Agency as part of the Investments for the future program (to Y.H.).
Footnotes
Author Contributions A.d.G., V.D., L.K., C.U.T.H., T.V.P., J.F. and Y.H. interpreted the data and wrote the manuscript. V.D. and T.V.P. prepared the sample. Y.H. and A.d.G. performed the cryo-electron microscopy experiments. Y.H. and A.d.G. performed the cryo-electron microscopy experiments, data processing and the atomic modeling. L.K. performed the mass-spectrometry experiment. T.V.P., J.F. and Y.H. directed research.
Author Information Cryo-EM maps and atomic coordinates for the reported structures have been deposited in the Electron Microscopy Data Bank under the accession numbers EMD-3056, EMD-3057 and EMD-3058, and in the Protein Data Bank under the accession numbers 5a5t and 5a5u. The authors declare no competing financial interests.
Supplementary Information is linked to online version of the paper at WWW.nature.com/nature
REFERENCES
- 1.Jackson RJ, Hellen CU, Pestova TV. The mechanism of eukaryotic translation initiation and principles of its regulation. Nat. Rev. Mol. Cell. Biol. 2010;11:113–127. doi: 10.1038/nrm2838. [DOI] [PMC free article] [PubMed] [Google Scholar]
- 2.Hinnebusch AG. eIF3: a versatile scaffold for translation initiation complexes. Trends Biochem Sci. 2006;23:553–562. doi: 10.1016/j.tibs.2006.08.005. [DOI] [PubMed] [Google Scholar]
- 3.Valásek LS. ‘Ribozoomin’--translation initiation from the perspective of the ribosome-bound eukaryotic initiation factors (eIFs). Curr. Protein Pept. Sci. 2012;13:305–330. doi: 10.2174/138920312801619385. [DOI] [PMC free article] [PubMed] [Google Scholar]
- 4.Ellisdon AM, Stewart M. Structural biology of the PCI-protein fold. Bioarchitecture. 2012;2:118–123. doi: 10.4161/bioa.21131. [DOI] [PMC free article] [PubMed] [Google Scholar]
- 5.Pena V, Liu S, Bujnicki JM, Lührmann R, Wahl MC. Structure of a multipartite protein-protein interaction domain in splicing factor prp8 and its link to retinitis pigmentosa. Mol Cell. 2007;25:615–624. doi: 10.1016/j.molcel.2007.01.023. [DOI] [PubMed] [Google Scholar]
- 6.Enchev RI, Schreiber A, Beuron F, Morris EP. Structural insights into the COP9 signalosome and its common architecture with the 26S proteasome lid and eIF3. Structure. 2010;18:518–527. doi: 10.1016/j.str.2010.02.008. [DOI] [PubMed] [Google Scholar]
- 7.Hashem Y, et al. Structure of the mammalian ribosomal 43S preinitiation complex bound to the scanning factor DHX29. Cell. 2013;153:1108–1119. doi: 10.1016/j.cell.2013.04.036. [DOI] [PMC free article] [PubMed] [Google Scholar]
- 8.Hashem Y, et al. Hepatitis-C-virus-like internal ribosome entry sites displace eIF3 to gain access to the 40S subunit. Nature. 2013;503:539–543. doi: 10.1038/nature12658. [DOI] [PMC free article] [PubMed] [Google Scholar]
- 9.Querol-Audi J, et al. Architecture of human translation initiation factor 3. Structure. 2013;21:920–928. doi: 10.1016/j.str.2013.04.002. [DOI] [PMC free article] [PubMed] [Google Scholar]
- 10.Sun C, et al. Functional reconstitution of human eukaryotic translation initiation factor 3 (eIF3). Proc. Natl. Acad. Sci. U.S.A. 2011;108:20473–20478. doi: 10.1073/pnas.1116821108. [DOI] [PMC free article] [PubMed] [Google Scholar]
- 11.Beck F, et al. Near-atomic resolution structural model of the yeast 26S proteasome. Proc. Natl. Acad. Sci. U.S.A. 2012;109:14870–14875. doi: 10.1073/pnas.1213333109. [DOI] [PMC free article] [PubMed] [Google Scholar]
- 12.Lander GC, et al. Complete subunit architecture of the proteasome regulatory particle. Nature. 2012;482:186–191. doi: 10.1038/nature10774. [DOI] [PMC free article] [PubMed] [Google Scholar]
- 13.Lingaraju GM, et al. Crystal structure of the human COP9 signalosome. Nature. 2014;512:161–165. doi: 10.1038/nature13566. [DOI] [PubMed] [Google Scholar]
- 14.ElAntak L, Tzakos AG, Locker N, Lukavsky PJ. Structure of eIF3b RNA recognition motif and its interaction with eIF3j: structural insights into the recruitment of eIF3b to the 40 S ribosomal subunit. J Biol Chem. 2007;282:8165–8174. doi: 10.1074/jbc.M610860200. [DOI] [PubMed] [Google Scholar]
- 15.Herrmannová A, et al. Structural analysis of an eIF3 subcomplex reveals conserved interactions required for a stable and proper translation pre-initiation complex assembly. Nucleic Acids Res. 2012;40:2294–2311. doi: 10.1093/nar/gkr765. [DOI] [PMC free article] [PubMed] [Google Scholar]
- 16.Liu Y, et al. Translation initiation factor eIF3b contains a nine-bladed β-propeller and interacts with the 40S ribosomal subunit. Structure. 2014;22:923–930. doi: 10.1016/j.str.2014.03.010. [DOI] [PubMed] [Google Scholar]
- 17.Erzberger J, et al. Molecular Architecture of the 40S·eIF1·eIF3 Translation Initiation Complex. Cell. 2014;158:1123–1135. doi: 10.1016/j.cell.2014.07.044. [DOI] [PMC free article] [PubMed] [Google Scholar]
- 18.Zhou M, et al. Mass spectrometry reveals modularity and a complete subunit interaction map of the eukaryotic translation factor eIF3. Proc Natl Acad Sci U S A. 2008;105:18139–18144. doi: 10.1073/pnas.0801313105. [DOI] [PMC free article] [PubMed] [Google Scholar]
- 19.Dong Z, Qi J, Peng H, Liu J, Zhang JT. Spectrin domain of eukaryotic initiation factor 3a is the docking site for formation of the a:b:i:g subcomplex. J Biol Chem. 2013;288:27951–27959. doi: 10.1074/jbc.M113.483164. [DOI] [PMC free article] [PubMed] [Google Scholar]
- 20.Wagner S, Herrmannová A, Malík R, Peclinovská L, Valášek LS. Functional and biochemical characterization of human eukaryotic translation initiation factor 3 in living cells. Mol Cell Biol. 2014;34:3041–3052. doi: 10.1128/MCB.00663-14. [DOI] [PMC free article] [PubMed] [Google Scholar]
- 21.Masutani M, Sonenberg N, Yokoyama S, Imataka H. Reconstitution reveals the functional core of mammalian eIF3. EMBO J. 2007;26:3373–3383. doi: 10.1038/sj.emboj.7601765. [DOI] [PMC free article] [PubMed] [Google Scholar]
- 22.Fraser CS, et al. The j-Subunit of Human Translation Initiation Factor eIF3 Is Required for the Stable Binding of eIF3 and Its Subcomplexes to 40 S Ribosomal Subunits in Vitro. J Biol Chem. 2004;10:8946–8956. doi: 10.1074/jbc.M312745200. [DOI] [PubMed] [Google Scholar]
- 23.Valásek L, Hasek J, Trachsel H, Imre EM, Ruis H. The Saccharomyces cerevisiae HCR1 gene encoding a homologue of the p35 subunit of human translation initiation factor 3 (eIF3) is a high copy suppressor of a temperature-sensitive mutation in the Rpg1p subunit of yeast eIF3. J Biol Chem. 1999;274:27567–27572. doi: 10.1074/jbc.274.39.27567. [DOI] [PubMed] [Google Scholar]
- 24.Estrin E, Lopez-Blanco JR, Chacon P, Martin A. Formation of an intricate helical bundle dictates the assembly of the 26S proteasome lid. Structure. 2013;21:1624–1635. doi: 10.1016/j.str.2013.06.023. [DOI] [PubMed] [Google Scholar]
- 25.Anger AM, et al. Structures of the human and Drosophila 80S ribosome. Nature. 2013;497:80–85. doi: 10.1038/nature12104. [DOI] [PubMed] [Google Scholar]
- 26.Schmitt E, et al. Structure of the ternary initiation complex aIF2-GDPNP-methionylated initiator tRNA. Nat. Struct. Mol. Biol. 2012;19:450–454. doi: 10.1038/nsmb.2259. [DOI] [PubMed] [Google Scholar]
- 27.Dhote V, Sweeney TR, Kim N, Hellen CU, Pestova TV. Roles of individual domains in the function of DHX29, an essential factor required for translation of structured mammalian mRNAs. Proc. Natl. Acad. Sci. U.S.A. 2012;109:E3150–E3159. doi: 10.1073/pnas.1208014109. [DOI] [PMC free article] [PubMed] [Google Scholar]
- 28.Aylett CH, Boehringer D, Erzberger JP, Schaefer T, Ban N. Structure of a Yeast 40S-eIF1-eIF1A-eIF3-eIF3j initiation complex. Nat Struct Mol Biol. 2015;22:269–271. doi: 10.1038/nsmb.2963. [DOI] [PubMed] [Google Scholar]
- 29.Kouba T, et al. Small ribosomal protein RPS0 stimulates translation initiation by mediating 40S-binding of eIF3 via its direct contact with the eIF3a/TIF32 subunit. PLoS One. 2012;7:e40464. doi: 10.1371/journal.pone.0040464. [DOI] [PMC free article] [PubMed] [Google Scholar]
- 30.Valásek L, Mathew AA, Shin BS, Nielsen KH, Szamecz B, Hinnebusch AG. The yeast eIF3 subunits TIF32/a, NIP1/c, and eIF5 make critical connections with the 40S ribosome in vivo. Genes Dev. 2003;17:786–799. doi: 10.1101/gad.1065403. [DOI] [PMC free article] [PubMed] [Google Scholar]
- 31.Pisarev AV, Kolupaeva VG, Yusupov MM, Hellen CU, Pestova TV. Ribosomal position and contacts of mRNA in eukaryotic translation initiation complexes. EMBO J. 2008;27:1609–1621. doi: 10.1038/emboj.2008.90. [DOI] [PMC free article] [PubMed] [Google Scholar]
- 32.Zhou C, et al. PCI proteins eIF3e and eIF3m define distinct translation initiation factor 3 complexes. BMC Biol. 2005;3:14. doi: 10.1186/1741-7007-3-14. [DOI] [PMC free article] [PubMed] [Google Scholar]
- 33.Rezende AM, et al. The translation initiation complex eIF3 in trypanosomatids and other pathogenic excavates-identification of conserved and divergent features based on orthologue analysis. BMC Genomics. 2014;15:1175. doi: 10.1186/1471-2164-15-1175. [DOI] [PMC free article] [PubMed] [Google Scholar]
- 34.LeFebvre AK, et al. Translation Initiation Factor eIF4G-1 Binds to eIF3 through the eIF3e Subunit. J. Biol. Chem. 2006;281:22917–22932. doi: 10.1074/jbc.M605418200. [DOI] [PMC free article] [PubMed] [Google Scholar]
- 35.Villa N, Do A, Hershey JWB, Fraser CS. Human eukaryotic initiation factor 4G (eIF4G) binds to eIF3c, -d, and -e to promote mRNA recruitment to the ribosome. J. Biol. Chem. 2013;288:32932–32940. doi: 10.1074/jbc.M113.517011. [DOI] [PMC free article] [PubMed] [Google Scholar]
- 36.Yu Y, Abaeva IS, Marintchev A, Pestova TV, Hellen CU. Common conformational changes induced in type 2 picornavirus IRESs by cognate trans-acting factors. Nucleic Acids Res. 2011;39:4851–4865. doi: 10.1093/nar/gkr045. [DOI] [PMC free article] [PubMed] [Google Scholar]
- 37.Chiu WL, et al. The C-terminal region of eukaryotic translation initiation factor 3a (eIF3a) promotes mRNA recruitment, scanning, and, together with eIF3j and the eIF3b RNA recognition motif, selection of AUG start codons. Mol. Cell. Biol. 2010;30:4415–4434. doi: 10.1128/MCB.00280-10. [DOI] [PMC free article] [PubMed] [Google Scholar]
- 38.ElAntak L, et al. The indispensable N-terminal half of eIF3j/HCR1 cooperates with its structurally conserved binding partner eIF3b/PRT1-RRM and with eIF1A in stringent AUG selection. J. Mol. Biol. 2010;396:1097–1116. doi: 10.1016/j.jmb.2009.12.047. [DOI] [PMC free article] [PubMed] [Google Scholar]
- 39.Cuchalova L, et al. The RNA recognition motif of eukaryotic translation initiation factor 3g (eIF3g) is required for resumption of scanning of posttermination ribosomes for reinitiation on GCN4 and together with eIF3i stimulates linear scanning. Mol. Cell. Biol. 2010;30:4671–4686. doi: 10.1128/MCB.00430-10. [DOI] [PMC free article] [PubMed] [Google Scholar]
- 40.Pisareva VP, Pisarev AV, Komar AA, Hellen CU, Pestova TV. Translation initiation on mammalian mRNAs with structured 5'UTRs requires DExH-box protein DHX29. Cell. 2008;135:1237–1250. doi: 10.1016/j.cell.2008.10.037. [DOI] [PMC free article] [PubMed] [Google Scholar]
- 41.Grassucci RA, Taylor DJ, Frank J. Preparation of macromolecular complexes for cryo-electron microscopy. Nat. Protoc. 2007;2:3239–3246. doi: 10.1038/nprot.2007.452. [DOI] [PMC free article] [PubMed] [Google Scholar]
- 42.Dubochet J, et al. Cryo-electron microscopy of vitrified specimens. Quarterly reviews of biophysics. 1988;21:129–228. doi: 10.1017/s0033583500004297. [DOI] [PubMed] [Google Scholar]
- 43.Wagenknecht T, Frank J, Boublik M, Nurse K, Ofengand J. Direct localization of the tRNA--anticodon interaction site on the Escherichia coli 30 S ribosomal subunit by electron microscopy and computerized image averaging. Journal of molecular biology. 1988;203:753–760. doi: 10.1016/0022-2836(88)90207-0. [DOI] [PubMed] [Google Scholar]
- 44.Suloway C, et al. Automated molecular microscopy: the new Leginon system. Journal of structural biology. 2005;151:41–60. doi: 10.1016/j.jsb.2005.03.010. [DOI] [PubMed] [Google Scholar]
- 45.Li X, et al. Electron counting and beam-induced motion correction enable near-atomic-resolution single-particle cryo-EM. Nature methods. 2013;10:584–590. doi: 10.1038/nmeth.2472. [DOI] [PMC free article] [PubMed] [Google Scholar]
- 46.Frank J, et al. SPIDER and WEB: processing and visualization of images in 3D electron microscopy and related fields. J Struct Biol. 1996;116:190–199. doi: 10.1006/jsbi.1996.0030. [DOI] [PubMed] [Google Scholar]
- 47.Langlois R, et al. Automated particle picking for low-contrast macromolecules in cryo-electron microscopy. J Struct Biol. 2014;186:1–7. doi: 10.1016/j.jsb.2014.03.001. [DOI] [PMC free article] [PubMed] [Google Scholar]
- 48.Scheres SH. RELION: implementation of a Bayesian approach to cryo-EM structure determination. J Struct Biol. 2012;180:519–530. doi: 10.1016/j.jsb.2012.09.006. [DOI] [PMC free article] [PubMed] [Google Scholar]
- 49.Rosenthal PB, Henderson R. Optimal determination of particle orientation, absolute hand, and contrast loss in single-particle electron cryomicroscopy. J. Mol. Biol. 2003;333:721–745. doi: 10.1016/j.jmb.2003.07.013. [DOI] [PubMed] [Google Scholar]
- 50.Chen S, et al. High-resolution noise substitution to measure overfitting and validate resolution in 3D structure determination by single particle electron cryomicroscopy. Ultramicroscopy. 2013;135:24–35. doi: 10.1016/j.ultramic.2013.06.004. [DOI] [PMC free article] [PubMed] [Google Scholar]
- 51.Kucukelbir A, Sigworth SJ, Tagare D. Quantifying the Local Resolution of Cryo-EM Density Maps. Nature Methods. 2014;11:63–65. doi: 10.1038/nmeth.2727. [DOI] [PMC free article] [PubMed] [Google Scholar]
- 52.Pettersen EF, et al. UCSF Chimera--a visualization system for exploratory research and analysis. J. Comput. Chem. 2004;25:1605–1612. doi: 10.1002/jcc.20084. [DOI] [PubMed] [Google Scholar]
- 53.Pintilie GD, Zhang J, Goddard TD, Chiu W, Gossard DC. Quantitative analysis of cryo-EM density map segmentation by watershed and scale-space filtering, and fitting of structures by alignment to regions. J Struct Biol. 2010;170:427–438. doi: 10.1016/j.jsb.2010.03.007. [DOI] [PMC free article] [PubMed] [Google Scholar]
- 54.Marchler-Bauer A, et al. CDD: NCBI's conserved domain database. Nucleic Acids Res. 2015;43:D222–226. doi: 10.1093/nar/gku1221. [DOI] [PMC free article] [PubMed] [Google Scholar]
- 55.Mitchell A, et al. The InterPro protein families database: the classification resource after 15 years. Nucleic Acids Res. 2015;43:D213–221. doi: 10.1093/nar/gku1243. [DOI] [PMC free article] [PubMed] [Google Scholar]
- 56.Marintchev A, Wagner G. Translation initiation: structures, mechanisms and evolution. Q Rev Biophys. 2004;37:197–284. doi: 10.1017/S0033583505004026. [DOI] [PubMed] [Google Scholar]
- 57.Lange H, et al. The RNA helicases AtMTR4 and HEN2 target specific subsets of nuclear transcripts for degradation by the nuclear exosome in Arabidopsis thaliana. PLoS Genet. 2014;10:e1004564. doi: 10.1371/journal.pgen.1004564. [DOI] [PMC free article] [PubMed] [Google Scholar]
- 58.Perkins DN, Pappin DJ, Creasy DM, Cottrell JS. Probability-based protein identification by searching sequence databases using mass spectrometry data. Electrophoresis. 1999;20:3551–3567. doi: 10.1002/(SICI)1522-2683(19991201)20:18<3551::AID-ELPS3551>3.0.CO;2-2. [DOI] [PubMed] [Google Scholar]
- 59.Thiele H, Glandorf J, Hufnagel P. Bioinformatics strategies in life sciences: from data processing and data warehousing to biological knowledge extraction. J Integr Bioinform. 2010;7:141. doi: 10.2390/biecoll-jib-2010-141. [DOI] [PubMed] [Google Scholar]
- 60.Elias JE, Gygi SP. Target-decoy search strategy for mass spectrometry-based proteomics. Methods Mol Biol. 2010;604:55–71. doi: 10.1007/978-1-60761-444-9_5. [DOI] [PMC free article] [PubMed] [Google Scholar]
- 61.Khoshnevis S, et al. Structural integrity of the PCI domain of eIF3a/TIF32 is required for mRNA recruitment to the 43S pre-initiation complexes. Nucleic Acids Res. 2014;42:4123–4139. doi: 10.1093/nar/gkt1369. [DOI] [PMC free article] [PubMed] [Google Scholar]
- 62.Guex N, Peitsch MC. SWISS-MODEL and the Swiss-PdbViewer: An environment for comparative protein modeling. Electrophoresis. 1997;18:2714–2723. doi: 10.1002/elps.1150181505. [DOI] [PubMed] [Google Scholar]
- 63.Wei Z, et al. Crystal structure of human eIF3k, the first structure of eIF3 subunits. J Biol Chem. 2004;279:34983–34990. doi: 10.1074/jbc.M405158200. [DOI] [PubMed] [Google Scholar]
- 64.Trabuco LG, Villa E, Mitra K, Frank J, Schulten K. Flexible fitting of atomic structures into electron microscopy maps using molecular dynamics. Structure. 2008;16:673–683. doi: 10.1016/j.str.2008.03.005. [DOI] [PMC free article] [PubMed] [Google Scholar]
- 65.Hashem Y, et al. High-resolution cryo-electron microscopy structure of the Trypanosoma brucei ribosome. Nature. 2013;494:385–389. doi: 10.1038/nature11872. [DOI] [PMC free article] [PubMed] [Google Scholar]
- 66.Humphrey W, Dalke A, Schulten K. VMD: visual molecular dynamics. J. Mol. Graph. 1996;1:33–8. 27–8. doi: 10.1016/0263-7855(96)00018-5. [DOI] [PubMed] [Google Scholar]
- 67.Brooks BR, et al. CHARMM: A Program for Macromolecular Energy, Minimization, and Dynamics Calculations. J. Comp. Chem. 1983;4:187–217. [Google Scholar]
- 68.MacKerell, et al. CHARMM: The Energy Function and Its Parameterization with an Overview of the Program. In: Schleyer P.v.R., et al., editors. The Encyclopedia of Computational Chemistry. Vol. 1. John Wiley & Sons; Chichester: 1998. pp. 271–277. [Google Scholar]
- 69.Ana TS, et al. Biophysical and Structural Characterization of the Recombinant Human eIF3L. Protein & Peptide Letters. 2014;21:56–62. doi: 10.2174/09298665113209990084. [DOI] [PubMed] [Google Scholar]
Associated Data
This section collects any data citations, data availability statements, or supplementary materials included in this article.


