

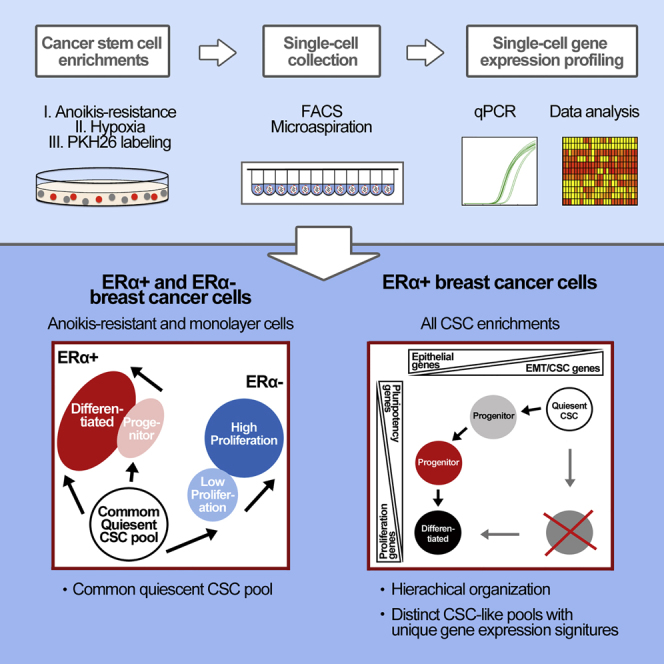
Summary
The identification of breast cancer cell subpopulations featuring truly malignant stem cell qualities is a challenge due to the complexity of the disease and lack of general markers. By combining extensive single-cell gene expression profiling with three functional strategies for cancer stem cell enrichment including anchorage-independent culture, hypoxia, and analyses of low-proliferative, label-retaining cells derived from mammospheres, we identified distinct stem cell clusters in breast cancer. Estrogen receptor (ER)α+ tumors featured a clear hierarchical organization with switch-like and gradual transitions between different clusters, illustrating how breast cancer cells transfer between discrete differentiation states in a sequential manner. ERα− breast cancer showed less prominent clustering but shared a quiescent cancer stem cell pool with ERα+ cancer. The cellular organization model was supported by single-cell data from primary tumors. The findings allow us to understand the organization of breast cancers at the single-cell level, thereby permitting better identification and targeting of cancer stem cells.
Graphical Abstract
Highlights
-
•
ERα+ and ERα− breast cancer stem cells share a quiescent cancer stem cell pool
-
•
Single-cell analysis identified distinct cancer stem cell populations in breast cancer
-
•
Identified ERα+ breast cancer cell populations were hierarchically organized
-
•
Switch-like and gradual transitions exist between ERα+ stem and progenitor pools
By combining functional cancer stem cell enrichment strategies and single-cell gene expression analyses of key regulatory genes, Landberg, Ståhlberg, and colleagues identify distinct breast cancer stem cell clusters and hierarchical organization in breast cancer. Defining tumor cell states and their transitions allows for better identification and targeting of cancer stem cells.
Introduction
Breast cancer is one of the world's leading causes of cancer-related death among women, characterized by a high degree of heterogeneity in terms of histological, molecular, and clinical features, affecting disease progression and treatment response (Bertos and Park, 2011). This has led to the classification of breast cancer into several subtypes including classical histological and immunohistochemical definitions of breast cancer types as well as molecularly defined subgroups (Perou et al., 2000, Sørlie et al., 2001). The seminal studies by Perou et al. and Sørlie et al. identified luminal, HER2-enriched, basal, and normal-breast-like intrinsic breast cancers. At the transcriptomic level, this classification was shown to be mainly driven by estrogen receptor α (ERα), and ERα-related and proliferation-related genes (Reis-Filho and Pusztai, 2011). ERα-positive (ERα+) and -negative (ERα−) breast cancers are well recognized as molecularly and clinically distinct diseases. Several hypotheses have been proposed to explain intertumoral heterogeneity; including different genetic and epigenetic aberrations as well as distinct subtype-specific tumor cells of origin (Polyak, 2011).
Functional and phenotypic diversity has also been described at the single-cell level within individual tumors. Cells of various cancer types have been shown to differ greatly in their tumorigenic, angiogenic, invasive, and metastatic potential (Polyak, 2011). To account for intratumoral heterogeneity the cancer stem cell (CSC) model suggests that tumors are driven by a cellular subpopulation with stem cell properties, giving rise to hierarchically structured tumors. Attributes of CSCs comprise self-renewal, tumorigenicity, multilineage differentiation, and increased resistance to radiotherapy- and chemotherapy-induced cell death (Badve and Nakshatri, 2012), making CSCs critical targets in cancer therapy.
CSCs of breast tumors are commonly enriched by combinations of several cell-surface antigens, such as CD44/CD24/EPCAM (Al-Hajj et al., 2003), or by high ALDH (aldehyde dehydrogenase) activity (Ginestier et al., 2007). However, existing markers lack specificity, also reflective of a substantial proportion of non-CSCs. Furthermore, the applicability of existing markers is often limited to specific breast cancer subtypes (Nakshatri et al., 2009) in addition to interindividual intrinsic differences (Visvader and Lindeman, 2012). Previous studies have investigated the CSC content in different breast cancer subtypes (Harrison et al., 2013, Kim et al., 2012, Ricardo et al., 2011); however, thus far it is not exactly known whether distinct subtypes harbor the same or dissimilar CSCs. The large multitude of assays currently employed indicates either a lack of universal markers or reflects the heterogenic and dynamic nature of CSCs. The exact characterization of putative CSC pools is a pivotal requirement for clinical identification, monitoring, and targeting of these cells.
To elucidate the heterogeneity of the CSC pool and to study the CSC compartment in ERα+ and ERα− breast cancer subtypes, we set up a single-cell quantitative real-time PCR (qPCR) approach, profiling the expression of well-established key regulators involved in differentiation, stemness, epithelial-to-mesenchymal transition (EMT), and cell-cycle regulation. Three functional assays for CSC enrichment were applied: (1) growth in anchorage-independent culture; (2) growth in hypoxia; and (3) cell selection based on label retention in mammosphere culture. All methods have previously been shown to enrich for cells that exhibit increased cancer-initiating potential in mouse model systems (Harrison et al., 2010, Harrison et al., 2013, Ponti et al., 2005, Richichi et al., 2013). By extensive single-cell analyses of breast cancer cells, we now define hierarchically organized CSC pools and modes of cell state transitions.
Results
To study CSC heterogeneity and cellular composition in breast cancer, we applied three established techniques to modulate the CSC pool; growth in anchorage-independent culture (Harrison et al., 2010), hypoxia (Harrison et al., 2013), and a combination of the lipophilic PKH26 dye and the mammosphere assay to select for lowly proliferative, mammosphere-initiating cells (Ponti et al., 2005, Richichi et al., 2013) (Figures 1A–1C). All CSC enrichment methods have previously been demonstrated to enrich for cells displaying various CSC features, such as increased in vivo tumor-initiating capacity. Although in vivo data are not reported in this study, for simplicity we refer to enriched cell fractions as CSCs. The expression of key markers associated with differentiation (CDH1, CD24, EPCAM, ESR1, PGR), breast cancer stemness (CD44, ITGA6, DNER, ALDH1A3, ABCG2), pluripotency (POU5F1, NANOG, SOX2), EMT/metastasis (SNAI1, SNAI2, FOSL1, VIM, CDH2, ID1), and proliferation (CCNA2, MKI67, ERBB2) was quantitatively assessed at the single-cell level (Figures 1D and 1E). Detailed gene and qPCR assay information is provided in Table S1.
Figure 1.

Workflow of CSC Enrichment Methods and Single-Cell Gene Expression Profiling
(A–C) Breast cancer cell lines were cultured as regular monolayers, and cancer stem-like cells were enriched using three established techniques: (A) Growth in anchorage-independent culture (ERα+ and ERα− cell lines); (B) hypoxia (1% O2 for 48 hr) (MCF7 cells); (C) non-dividing, PKH26Bright cells cultured as mammospheres (MCF7 cells).
(D) Single-cell gene expression profiling. Individual cells were collected by either FACS or microaspiration, lysed, and immediately frozen on dry ice. Single-cell RNA was reverse transcribed, followed by targeted cDNA pre-amplification and quantitative real-time PCR. Single-cell data were analyzed using various uni- and multivariate statistical tools.
(E) Analyzed genes grouped by known expression patterns based on pre-existing literature. Full-length references are provided in the Supplemental Information.
Distinct Subpopulations with CSC and Differentiated Phenotypes Define ERα+ Cell Lines
In the first approach to study CSC and progenitor pools, we detailed anchorage-independent cultures, in which most differentiated cells undergo anoikis whereas anoikis-resistant (AR) cells with CSC properties will survive (Dontu et al., 2003, Harrison et al., 2010). Regular monolayer (ML) and AR cultures were grown in parallel (Figure 1A) and subsequently profiled at the single-cell level.
Principal-component analysis (PCA) of 157 individual MCF7 cells (ML: n = 80; AR: n = 77) showed three distinct cell clusters termed ERα+ I–III (Figure 2A). ERα+ I cells displayed high expression of the pluripotency-associated genes NANOG and POU5F1, low transcript levels of differentiation- and proliferation-related genes, and low overall transcript levels, indicating that these cells may reside in a quiescent state (Figures 2B, 2C, and S1A–S1E). ERα+ II cells exhibited high expression of breast CSC-associated genes (CD44, ALDH1A3, and ABCG2) and proliferation-related genes (CCNA2, MKI67, and ERBB2) (Figures 2B, 2C, and S1A–S1E). ERα+ III cells were characterized by high expression of differentiation-associated genes and proliferation markers (Figures 2B, 2C, and S1A–S1E). AR cells were enriched in clusters ERα+ I and II, while cluster ERα+ III mainly included ML cells (Figure 2C). Hence, the ERα+ I cluster corresponded to cells with CSC characteristics, while clusters ERα+ II and ERα+ III comprised cells that exhibited properties of progenitor and more differentiated cells, respectively.
Figure 2.

Single-Cell Gene Expression Analysis of ERα+ Breast Cancer Cells Reveals Two Modes of Differentiation
Single-cell gene expression profiling of ERα+ MCF7 and T47D cells grown in monolayer (ML) and anchorage-independent (anoikis-resistant, AR) cultures.
(A and E) PCA scores of individual MCF7 and T47D cells. Identified ERα+ I–III groups are indicated by different colors. In the PCA scores plot each cell is represented by a dot. The position of a cell is defined by its gene expression profile.
(B and F) PCA gene loadings, illustrating the contribution to the PCA scores in (A) and (E).
(C and G) Mean expression levels of the classified ERα+ I–III groups. The percentages of ML and AR cells per identified group are indicated at the bottom of the table. Statistical significance of groups was determined by Fisher's exact test, ∗∗∗p ≤ 0.001.
(D and H) Differentially expressed genes between ML and AR cells. Mean expression ± SEM are shown as dots (scale indicated at left y axis) and percentage of cells expressing a given gene are represented as bars (scale indicated at right y axis). The Mann-Whitney U test was used to identify significantly regulated genes, and p values were Bonferroni adjusted to correct for multiple testing. ∗p ≤ 0.05, ∗∗p ≤ 0.01, ∗∗∗p ≤ 0.001. Number of analyzed cells: MCF7, ML: n = 80; AR: n = 77; T47D, ML: n = 78; AR: n = 80.
See also Figures S1 and S3; Tables S2 and S4.
Similarly, PCA of 158 T47D cells (ML: n = 78; AR: n = 80) identified two discrete clusters, designated ERα+ I and III, in accordance with the definition used for MCF7 cells (Figure 2E). ERα+ I cells were distinguished by high expression of SOX2, POU5F1, and NANOG and low overall RNA expression levels (Figures 2F, 2G, and S1F–S1J). ERα+ III cells exhibited high transcript levels of differentiation- and proliferation-associated genes (Figures 2F, 2G, and S1F–S1J). Cluster ERα+ I primarily included AR cells, whereas cluster ERα+ III mainly consisted of ML cells (Figure 2G). MCF7 and T47D cells defining clusters ERα+ I and III showed similar gene expression characteristics.
To identify genes and processes involved in the applied CSC enrichment method, we compared differentially expressed genes between ML and AR cells. In AR cells, CDH1, CD24, EPCAM, ESR1, PGR, and ID1 were downregulated and FOSL1 upregulated in both cell types, while CCNA2 was only downregulated in MCF7 cells (Figures 2D and 2H). This common regulation of MCF7 and T47D cells suggests similar enrichment mechanisms. To further pursue this notion, we performed pairwise gene correlation analysis at the single-cell level to identify mutual regulatory elements (Stahlberg and Bengtsson, 2010). Interestingly, there were a larger number of correlations in AR cells compared with ML cells, accompanied by an increase of common correlations in MCF7 and T47D AR cells (Table S4). Furthermore, the observed correlations in AR cells linked differentiation-associated genes with proliferation markers.
Proliferative Phenotypes Define ERα− Breast Cancer Cell Lines
Two ERα− cell lines, CAL120 and MDA-MB-231 (MDA231), were next analyzed using the same experimental setup as for ERα+ cells. PCA of 140 single CAL120 cells (ML: n = 75; AR: n = 65) is illustrated in Figure 3A. Cells grouped into two clusters termed ERα− I and III in accordance with the nomenclature applied for ERα+ cell lines. ERα− I cells displayed low overall RNA expression levels, whereas ERα− III cells were characterized by high expression of 14 genes, belonging to all defined gene groups (Figures 3B, 3C, and S2A–S2E). Cluster ERα− III harbored the majority of all analyzed cells, while AR cells were slightly enriched in cluster ERα− I, suggesting that cluster ERα− I cells represent a slow-dividing/quiescent cell pool characteristic of CSCs (Fillmore and Kuperwasser, 2008).
Figure 3.

Single-Cell Gene Expression Analysis of ERα− Breast Cancer Cells Reveals Subpopulations of Cells with Variable Proliferative Capacity
Single-cell gene expression profiling of ERα− CAL120 and MDA231 cells grown in monolayer (ML) or anchorage-independent (anoikis-resistant, AR) cultures.
(A and E) PCA scores of individual CAL120 and MDA231 cells. Identified ERα− I–III groups are indicated in different colors. In the PCA scores plot each cell is represented by a dot. The position of a cell is defined by its gene expression profile.
(B and F) PCA gene loadings, illustrating the contribution to the PCA scores in (A) and (E).
(C and G) Mean expression levels of the PCA-identified ERα− I–III groups. The percentages of ML and AR cells per identified group are indicated at the bottom of the table. Statistical significance of groups was determined by Fisher's exact test, ∗p ≤ 0.05.
(D and H) Differentially expressed genes between ML and AR cells. Mean expression ± SEM are shown as dots (scale indicated at left y axis) and percentage of cells expressing a given gene are represented as bars (scale indicated at right y axis). The Mann-Whitney U test was used to identify significantly regulated genes, and p values were Bonferroni adjusted to correct for multiple testing. ∗p ≤ 0.05, ∗∗p ≤ 0.01, ∗∗∗p ≤ 0.001. Number of analyzed cells: CAL120, ML: n = 75; AR: n = 65; MDA231, ML: n = 84; AR, n = 75.
See also Figures S2 and S3; Tables S3 and S4.
Likewise, PCA of 159 individual MDA231 cells (ML: n = 84; AR: n = 75) revealed the presence of two cell clusters ERα− II and III. ALDH1A3, ABCG2, and SNAI1 were marginally, but not significantly, upregulated in ERα− II cells (Figures S2F–S2J). ERα− III cells exhibited elevated expression of FOSL1, VIM, CCNA2, and MKI67 (Figures 3F, 3G, and S2F–S2J). AR cells were enriched in cluster ERα− II, whereas ML cells were enriched in cluster ERα− III (Figure 3G).
As for ERα+ cell lines, most affected genes were downregulated in ERα− cell lines when comparing AR cells with ML cells (Figures 3D and 3H). Different genes were downregulated in CAL120 (CD44, CDH2, and MK167) and MDA231 (ITGA6, SNAI2, FOSL1, and VIM), and only CCNA2 and ID1 were downregulated in both ERα− cell lines. ABCG2 was the only upregulated gene in MDA231 AR cells (Figure 3H). In contrast to ERα+ AR cells, single-cell gene correlation analysis revealed no increase in the number of correlations comparing AR with ML cells (Figures S3E–S3H). Furthermore, the observed correlations differed between the two cell types.
A Common CSC Subpopulation Can Be Identified in ERα+ and ERα− Cells
In an attempt to detect common subpopulations in breast cancer cells, all single-cell data were normalized, pooled, and subjected to combined analyses. In support for similar behaviors between ERα+ and ERα− cell lines, PCA of all MCF7, T47D, CAL120, and MDA231 cells revealed the presence of distinct subpopulations based on their specific gene expression profiles (Figures 4A and 4B). ERα+ cell lines defined three discrete clusters (ERα+ I–III), whereas ERα− cell lines congregated into three partly separate clusters (ERα− I–III), where clusters ERα+ I and ERα− I represented a common quiescent CSC pool. The ERα+/ERα− I cluster included cells of all cell lines. Figure 4C shows in detail that ERα+ and ERα− CSCs cannot be separated from each other based on their gene expression profiles. Cluster ERα+ II mainly contained MCF7 AR cells, whereas cluster ERα+ III encompassed the majority of all differentiated ERα+ ML cells. Clusters ERα− II–III harbored essentially all MDA231 cells as well as most of the CAL120 cells (Figure S3B). The clusters defined lowly (ERα− II) or highly (ERα− III) proliferative groups of cells as indicated in Figure 4A. The defined clusters were validated using an alternative hierarchical clustering method (Figure S3A).
Figure 4.

ERα+ and ERα− Cells Define a Common Quiescent Cell Pool Featuring CSC-like Characteristics
Single-cell gene expression analysis of all 615 ERα+ and ERα− breast cancer cells.
(A) PCA scores of individual MCF7, T47D (ERα+) as well as CAL120 and MDA231 (ERα−) cells, cultured as monolayers (ML) and in anchorage-independent growth conditions (anoikis-resistant, AR). Each cell is represented by a symbol, specific for the cell line as shown in the figure. Identified groups are indicated in different colors.
(B) PCA gene loadings, illustrating the contribution to the PCA scores in (A).
(C) Cell-to-cell correlation heatmap of the ERα+/ERα− I group using the Spearman correlation coefficient. ERα− cells are indicated by black arrow heads.
(D) Hypothesized cellular organization of ERα+ and ERα− cell lines. The model mimics the PCA score plot in (A). Cell state conversions are indicated as bidirectional process, black arrows denote differentiation, and gray arrows indicate putative de-differentiation.
(E) PCA scores of individual cells generated from one ERα+ and one ERα− primary tumor, respectively.
(F) PCA gene loadings, illustrating the contribution to the PCA scores in (D).
(G) Hypothesized cellular organization of ERα+ and ERα− primary tumors. The model mimics the PCA score plot in (E). Directions of cell state conversions are indicated by arrows (red and blue, differentiation; gray, de-differentiation).
Figure 4D schematically illustrates the hierarchical organization between the identified subpopulations. Two distinct modes of differentiation were identified in the ERα+ cell lines. MCF7 cells differentiated via a progenitor-like state (ERα+ II), before they acquired a fully differentiated phenotype (ERα+ III), while T47D cells differentiated without passing this progenitor-like state. ERα− cell lines, on the other hand, seemed to differentiate by increasing proliferative capacity from a common quiescent CSC-like pool shared with ERα+ cells.
To validate our findings in a clinical context, we next analyzed single cells from two primary breast cancer samples, one ERα+ (n = 81) and one ERα− (n = 90) ductal cancer, collected directly after surgery without any pre-culture period. Overall, cells from the primary tumors displayed lower mean expression of most genes (Table S6) compared with the cell lines (Tables S2 and S3). When analyzing the two tumors together (Figures 4E and 4F), cells clustered based on their origin (ERα+ or ERα−) but with an overlap of some cells sharing a similar gene expression profile. This common cell pool was characterized by the expression of pluripotency markers, while the other cells expressed markers related to more differentiated cell states. The number of cells with a common undifferentiated gene expression profile was rather high, potentially including both common progenitor cells and CSCs. Figure 4G summarizes the differentiation route in primary tumor cells, which was in line with the cell hierarchy delineated for the cell lines based on manipulation of the CSC fraction (Figure 4D).
Hypoxia Enriches Two Distinct Populations with CSC Characteristics in ERα+ MCF7 Cells
As an alternative CSC enrichment for ERα+ breast cancer, we next used hypoxic growth conditions (Harrison et al., 2013). MCF7 cells were cultured in hypoxia (1% O2) or normoxia (21% O2) and collected after 48 hr for single-cell gene expression profiling (Figure 1B). Hypoxic culture was confirmed by 8.7-fold upregulation of carbonic anhydrase IX (CA9), a hypoxia-inducible factor 1α target gene (Wykoff et al., 2000) (Figure 5A). Normoxic (n = 84) and hypoxic (n = 84) cells formed no distinct clusters using PCA (Figures 5B and 5C). Therefore, we applied Kohonen self-organizing maps (SOMs) (Stahlberg et al., 2011) to define four relevant clusters (Hx I–IV) (Figure 5B). Hypoxic cells were enriched in the Hx I and Hx II groups, whereas normoxic cells dominated the Hx III and Hx IV groups (Figures 5B and 5D). Hx I cells were characterized by elevated expression of NANOG, SNAI1, SNAI2, and FOSL1, and low levels of ESR1, PGR, and ID1. Hx II cells exhibited highest expression of ABCG2, ALDH1A3, and CD44, and high expression of proliferation markers Hx III and IV cells were characterized by high levels of differentiation markers and low expression of breast CSC-associated genes. Hx III cells were mainly highly proliferative, whereas Hx IV cells were lowly proliferative (Figures 5D and S4A–S4E). Importantly, the Hx I and II populations were also present in normoxic culture condition although in lower proportions, suggesting a shift in the cellular equilibrium toward a more undifferentiated phenotype in hypoxia. When comparing differentially expressed genes in normoxic and hypoxic cells, we observed that EPCAM, ESR1, and ID1 were downregulated in hypoxia whereas ABCG2 was upregulated (Figure 5E), further supporting the notion that ERα+ cells acquire an immature phenotype in hypoxic culture.
Figure 5.

Hypoxia Enriches Two Distinct Populations with CSC Characteristics in ERα+ MCF7 Cells
Single-cell gene expression profiling of ERα+ MCF7 cells grown in normoxic (21% O2) and hypoxic (1% O2) culture for 48 hr.
(A) Fold change of carbonic anhydrase 9 (CA9) mRNA expression between normoxic and hypoxic MCF7 cells. Mean expression ± SD (n = 3) is shown. Statistical significance was determined with Student's t test, ∗∗p ≤ 0.01.
(B) PCA scores of individual normoxic and hypoxic MCF7 cells. Cells have been divided into four stable groups based on Kohonen self-organizing map (SOM) analysis, displayed as Hx I–IV. Normoxic and hypoxic cells are represented by dots and squares, respectively.
(C) PCA gene loadings, signifying the contribution to the PCA scores in (B).
(D) Mean expression of PCA-identified Hx I–IV groups. The percentages of normoxic and hypoxic cells per SOM group are indicated at the bottom of the table. Statistical significance of the identified groups was computed using the chi-square test, ∗∗∗p ≤ 0.001.
(E) Differentially expressed genes between normoxic and hypoxic cells. Mean expression ± SEM is shown as dots (scale indicated at left y axis) and percentage of cells expressing a given gene are represented as bars (scale indicated at right y axis). The Mann-Whitney U test was used to identify significantly regulated genes, and p values were Bonferroni adjusted to correct for multiple testing. ∗p ≤ 0.05, ∗∗p ≤ 0.01, ∗∗∗p ≤ 0.001. Normoxic cells: n = 84; hypoxic cells: n = 84.
For an extensive analysis of molecular networks relevant to hypoxia in MCF7 cells, we extended the existing 21-gene panel to 95 genes, including lineage-specific markers, cell-cycle regulators, and members of the Notch pathway (Table S1), which plays a role in the hypoxia-induced increase of CSCs in ERα+ breast cancers (Harrison et al., 2013). PCA of the 80 successfully pre-amplified genes showed cell clusters similar to those portrayed in Figure 5B (Figures S4F–S4G). Descriptive statistics for all 80 analyzed genes are presented in Table S5.
Label-Retaining Mammosphere-Derived MCF7 Cells Display Three Distinct Subpopulations with CSC-like Phenotypes
Since asymmetric stem cell division may leave one long-term lowly proliferative stem cell for later reactivation, and our data (Figures 1, 2, 3, 4, and 5) show that a subpopulation of cells with CSC characteristics are lowly proliferative, the next strategy to enrich for CSCs was to collect individual mammosphere-initiating cells that had undergone few cell divisions. Mammosphere-initiating cells were traced with the lipophilic PKH26 dye that diminishes with each cell division (Pece et al., 2010) (Figure 1C). The staining procedure did not significantly affect sphere formation (Figure S5A) or size (data not shown) of MCF7 cells. Mammospheres were categorized into two different PKH26-staining types: spheres containing a single PKH26Bright cell (Figure S5B) and spheres exhibiting a diffuse staining pattern (Figure S5C). When assessing the number of distinct sphere types in MCF7 cells, we observed that 40% of all MCF7 spheres (n = 141) contained one PKH26Bright cell only, whereas 60% (n = 211) of the spheres exhibited a diffuse staining pattern or multiple PKH26Bright foci (Figure S5F). Besides the presence of PKH26Bright cells in spheres, we regularly observed viable single PKH26Bright cells in our cultures not forming any spheres (Figures S5D and S5E). These cells could presumably have CSC features but resided in a more permanent quiescent cell state. For clarity, PKH26Bright single cells were eliminated from mammosphere cultures by slow centrifugation.
To verify that PKH26Bright cells were located within a mammosphere, we employed confocal microscopy and imaged z stacks of PKH26-stained spheres (Figure 6A). PKH26Bright, PKH26Intermediate, and PKH26Negative MCF7 cellular fractions were collected by fluorescence-activated cell sorting (FACS), and bulk transcript levels of key genes involved in differentiation, EMT, stemness, and proliferation demonstrated that PKH26Bright cells exhibited features of lowly proliferative CSCs (Figure S5G) in comparison with PKH26Intermediate and PKH26Negative cells. We then collected PKH26Bright single cells using FACS (n = 90) or manually picked single cells using a micromanipulator as an alternative cell collection method (n = 14) (Figure 6B). PCA of PKH26Bright cells revealed three distinct clusters (PKH I–III) (Figure 6C), featuring different gene expression characteristics (Figure 6D). Of note, the manually picked cells were present in all three groups, confirming unbiased cell collection (Figure 6C). Most cells (82%) were present in the PKH I and II clusters. PKH I cells displayed low expression of all analyzed genes, suggesting a quiescent cell state. PKH II cells exhibited elevated expression of pluripotency-associated genes as well as high expression of CD44 and the cell-cycle inhibitor CDKNA1 (p21). PKH III cells featured high expression of proliferation and differentiation-associated genes, suggestive of a proliferative progenitor pool (Figures 6E and S6).
Figure 6.

Single-Cell Gene Expression Analysis of Label-Retaining Mammosphere-Initiating ERα+ MCF7 Cells Reveals Three Distinct Subpopulations with CSC-like Features
Single-cell gene expression profiling of PKH26 label-retaining ERα+ MCF7 cells isolated from mammosphere cultures.
(A) Maximum-intensity projection of a confocal micrograph of a mammosphere containing a single PKH26Bright cell (white arrow).
(B) Micrograph of a PKH26Bright MCF7 single cell derived from dissociated mammospheres and collected by microaspiration.
(C) PCA scores of PKH26Bright MCF7 cells, collected by FACS (n = 90) and microaspiration (n = 14). Identified PKH I–III groups are indicated by different colors. Each cell is represented by a dot.
(D) PCA gene loadings showing the contribution to the PCA scores in (C).
(E) Mean expression levels of the PCA-identified PKH I–III groups. The percentages of cells per SOM group are indicated at the bottom of the table.
See also Figures S5 and S6.
ERα+ MCF7 Cells Comprise Distinct Cellular States and Are Organized in a Hierarchical Manner
Combined PCA and SOMs of all MCF7 single-cell data derived from the three CSC enrichment techniques, including corresponding monolayer populations, allowed us to relate and hierarchically organize identified phenotypic states. Individual cells could be divided into four stable clusters (MCF7 I–IV) using SOMs (Figure 7A), each presenting a unique gene expression signature (Figures 7B and S7). Cells from the three enrichment techniques were present in all defined clusters, although in varying proportions (Figure 7C). Cluster MCF7 I was dominated by AR cells and displayed high expression of EMT-related, pluripotency-related, and certain breast CSC-related genes (Figures S7A–S7E). Cluster MCF7 II primarily contained PKH26Bright cells and was characterized by high expression of CD44 (Figure S7). Cluster MCF7 III was enriched for hypoxic cells and to a lesser extent for PKH26Bright cells, with high expression of most differentiation markers ABCG2 and ERBB2 (Figure S7). Most ML cells were present in cluster MCF7 IV characterized by high expression of proliferation-associated genes, PGR, ALDH1A3, and ID1 (Figure S7). The PCA in Figure 7A is similar to that in Figure 2A, since the latter is a subset of all cells analyzed in Figure 7A. The groups relate to each other in the following manner: MCF I corresponds to ERα+ I, MCF II–III corresponds to ERα+ II, and MCF III corresponds to ERα+ III.
Figure 7.

ERα+ MCF7 Cells Feature Distinct Differentiation States Organized in a Hierarchical Manner
(A) PCA scores displaying ERα+ MCF7 cells. For a comprehensive analysis of cell types present, enriched anoikis-resistant (AR), hypoxic and PKH26Bright cells, as well as corresponding monolayer (ML) populations were subjected to PCA. Cells were classified into four groups, MCF7 I–IV, using SOMs. Data were autoscaled by cell to compensate for absolute differences in expression levels.
(B) PCA gene loadings showing the contribution to the PCA scores in (A).
(C) Percentage of cells per identified MCF7 I–IV group. Statistical significance of the identified groups was verified by using the chi-square test, ∗∗∗p ≤ 0.001.
(D) Proposed model displaying distinct identified cell states and hierarchical organization of MCF7 cells. The trend of gene expression of epithelial/differentiation, breast cancer stem cell (BCSC), pluripotency, EMT/metastasis, and proliferation-associated genes are indicated outside the box that mimics the PCA score plot in (A). Based on gradual gene regulation, differentiation and putative de-differentiation likely take place sequentially via several progenitor states along the hierarchy as further highlighted by the gray crossed circle, indicating a non-likely differentiation route.
Based on the observed gradual gene regulation between the identified clusters, we propose a hierarchical organization of MCF7 cells (Figure 7D). In this scenario the MCF7 I group featuring characteristics of quiescent CSCs represents the apex of the hierarchy, and differentiation takes place over different cellular states (MCF7 II and MCF7 III) to the most differentiated cells in group MCF7 IV. First, epithelial genes become activated at the same time as genes related to EMT, and breast CSCs become inactivated. Then, in a second step, genes related to proliferation are upregulated at the same time as pluripotency genes are downregulated.
Discussion
The CSC model suggests that tumors are driven by a small subset of cells with self-renewing and differentiation capacity, giving rise to phenotypically diverse, hierarchically organized tumors. CSCs display activated signaling pathways associated with normal stem cells and increased tumor-initiating capacity in xenograft models (Visvader and Lindeman, 2012), and have been shown to mediate metastasis (Liu et al., 2010) and increased resistance against radiotherapy and chemotherapy, contributing to relapse following therapy (Li et al., 2008, Yu et al., 2007, Zhang et al., 2010). The CSC concept has pivotal clinical implications for effective cancer treatments, since specific subpopulations in a tumor need to be targeted and monitored in order to better control tumor progression. However, diversity of breast cancer phenotypes as well as cellular plasticity complicate categorization of CSCs and, as a consequence, effective targeting of critical subpopulations of cancer cells.
Breast cancer cell lines can be classified into luminal (ERα+) and basal (ERα−) subtypes based on transcriptomic signatures (Charafe-Jauffret et al., 2006, Neve et al., 2006), and further contain cells with increased tumorigenic potential, i.e. CSCs (Charafe-Jauffret et al., 2009, Fillmore and Kuperwasser, 2008). Similarities between cell lines and primary breast cancer samples therefore support that cell lines can be used as relevant model systems for defining CSC properties and potential markers in cancer. The challenge is to define CSCs and other subpopulations and determine their relation to each other. The enrichment and detection of CSCs in breast cancer have relied on a few phenotypic markers (Al-Hajj et al., 2003, Ginestier et al., 2007), which has limited our understanding of cell transitions between tumor cells with various degrees of CSC characteristics.
To modulate stemness and differentiation, we therefore applied three functional CSC enrichment techniques, making use of inherent CSC properties, thereby circumventing obstacles associated with phenotypical CSC selection. As shown earlier (Harrison et al., 2010, Harrison et al., 2013, Ponti et al., 2005, Richichi et al., 2013) and presented in the results, all our CSC enrichment techniques increased the number of cells with stem cell properties, allowing us to detail this rare subpopulation of cancer cells. For a comprehensive analysis of CSC heterogeneity and tumor cell transitions, we employed single-cell gene expression profiling, assessing mRNA levels of well-established differentiation-, breast cancer stem cell-, pluripotency-, EMT-, and proliferation-associated genes in CSC-enriched and corresponding non-CSC populations. By applying single-cell gene expression profiling in different conditions with variable numbers of CSCs and differentiated cells, we were able to define cell states and determine their transition in relation to stemness, EMT, proliferation, and differentiation in a time-dependent manner using established approaches (Rusnakova et al., 2013, Stahlberg et al., 2011, Trapnell et al., 2014).
Comparison of two ERα+ cell lines (MCF7 and T47D) identified virtually identical regulated transcripts and an increase in common gene correlations in CSC-enriched cells. Despite similarities in gene expression in subpopulations, there were clear differences in subcellular transition principles between cell lines. T47D cells transitioned from a quiescent state to a more differentiated phenotype in a switch-like fashion, i.e., no or few cells were present in the PCA scores plot between cluster ERα+ I and III (Figure 4A), whereas MCF7 cells gradually differentiated via a progenitor-like state to acquire a more differentiated phenotype, i.e., cells were present throughout the PCA scores plot between clusters I, II, and III (Figure 4A). Conversion between differentiation states has earlier been demonstrated in breast cancer cells (Chaffer et al., 2011, Gupta et al., 2011); however, the studies were based on the assessment of three markers (CD44, CD24, EPCAM) to distinguish luminal, basal, and CSC-like lineages. Here, assessing the expression of 21-80 transcripts per individual cell, we present a much more detailed subpopulation analysis of breast cancer cells, indeed delineating progression and transit between differentiation stages in breast cancer.
To scrutinize the relationship between different breast cancer subtypes and the presence of CSC markers, we compared single-cell gene expression signatures of ERα+ and ERα− cell lines (CAL120 and MDA231). In contrast to ERα+ cell lines, ERα− cell lines produced a less well-defined separation of regular cultured and CSC-enriched cells, which could either be due to the fact that our applied gene panel did not optimally separate CSC-enriched populations or that ERα− cell lines do not exhibit a strict hierarchical organization in line with observations in melanomas (Quintana et al., 2010). ERα− cell lines are further characterized by a basal/mesenchymal phenotype, which may in part mask differentiation (Fillmore and Kuperwasser, 2008, Meyer et al., 2010). Our results nevertheless suggest that ERα− breast CSCs cluster based on proliferative capacity. This is also in line with the identification of a common CSC pool between ERα+ and ERα− cell lines that was quiescent by nature, i.e., exhibited low overall transcript levels, which has been described for cells residing in a dormant state (Cheung and Rando, 2013, Fukada et al., 2007, Huttmann et al., 2001) (Figure 4). Upon differentiation, ERα+ and ERα− cell lines activate partly different pathways by regulating specific genes, which give rise to the more mature cell types that characterize these breast cancer subtypes (Figure 4). In line with our cell line data, our proposed model of cell states and cell transition originating from a common CSC pool was supported by data generated from primary tumors.
The multitude of analyses performed using MCF7 cells allowed us to pool the various data and perform in-depth single-cell analyses, which identified four distinct subpopulations and differentiation states featuring clear-cut gene expression signatures. The most immature subpopulation displayed qualities of quiescent and pluripotent CSCs followed by distinct progenitor-like states before acquiring a more differentiated phenotype. Gradual up- and downregulation of differentiation-, cell-cycle-, EMT-, and stemness-related genes across the multiple cell states suggests a strict hierarchical organization of MCF7 cells. Whether cells transition through multiple cellular differentiation states in a uni- or bidirectional manner has not explicitly been addressed in this study, although several lines of evidence have recently reported a high degree of cellular plasticity and the capability of cells to switch between multiple cellular phenotypes (Chaffer et al., 2011, D'Amato et al., 2012, Gupta et al., 2011, Liu et al., 2014, Su et al., 2015). Furthermore, our single-cell analysis allowed us to determine the sequential order of events in CSC differentiation at a transcriptional level, since we analyzed individual tumor cells in different pre-defined conditions (Stahlberg et al., 2011). First, differentiation-associated genes were activated in immature CSCs at the same time as EMT and breast cancer-associated stem cell markers were downregulated. Second, we observed increased expression of proliferation markers and downregulation of genes related to stemness. This progression sequence is further in line with normal stem cell differentiation and development (D'Amour et al., 2005, Norrman et al., 2012). Temporal mapping of molecular mechanisms in differentiation and cellular transition modes in fact allows the identification of key events in CSC plasticity. For example, in an attempt to target de-differentiation of progenitor cells into less-differentiated cells with pluripotent features, in ERα+ breast cancers, genes associated with differentiation/EMT/breast cancer stemness need to be modulated rather than pluripotency/proliferation, since these processes follow a sequential order. However, in ERα− cells, proliferation seems to be one of the key differentiation-associated events. Targeting proliferation in both ERα+ and especially ERα− breast cancer may actually have an effect on differentiation processes, potentially increasing CSC subpopulations and tumor aggressiveness. Our data highlight the absolute need for proper tumor characterization and in-depth understanding of relevant common as well as separate differentiation and de-differentiation processes present in subtypes of breast cancer.
In this study we present unique data showing how breast cancer cells advance through a hierarchically organized structure rendering in balanced fractions of highly differentiated subpopulations of cells as well as cancer stem and progenitor cells. Focus was set on delineating the definition and composition of subpopulations with stem cell properties using single-cell qPCR of large sets of key regulators, and the results highlighted a highly orchestrated subpopulation-based organization in predominantly ERα+ breast cancer but also with common features between ERα+ and ERα− CSC populations. The results are in line with earlier reports suggesting lowly proliferative properties and the presence of pluripotency genes in CSCs as well as increased resistance to chemotherapy (Fillmore and Kuperwasser, 2008, Gao et al., 2010, Moore and Lyle, 2011, Pece et al., 2010), but in detail highlight the precise composition and existence of subpopulations with cancer-initiating properties. Data from primary breast cancer cells also support the cellular organization described in cell lines, and future studies including additional genes or next-generation sequencing data of larger sets of primary tumors can potentially reveal further subdivision and classifications of the now defined general principles of CSC pools in breast cancer. Properties and hierarchical movement between cancer subpopulations will be important knowledge when defining novel treatment approaches truly targeting CSCs and key differentiation pathways revitalizing cancer stem cell subpopulations during tumor progression.
Experimental Procedures
Extended experimental procedures are provided in the Supplemental Information.
CSC Enrichment Methods
To enrich for AR cells, single-cell suspensions were seeded in 1.2% poly(2-hydroxyethyl methacrylate)/95% ethanol-coated plates (Sigma-Aldrich) at a density of 500 cells cm−2 and grown for 16 hr in phenol red-free DMEM/F-12 (Life Technologies) containing 2% B27 supplement (Life Technologies), 20 ng ml−1 epidermal growth factor (BD Biosciences), and 1% penicillin/streptomycin (PAA) as previously described (Harrison et al., 2010). For hypoxic treatment cells were grown in the SCI-tiveN hypoxic workstation (Ruskinn Technology) in 1% O2, 5% CO2, and 94% N2 in a humidified environment at 37°C for 48 hr. For PKH26 staining of mammospheres, adherent cells were dissociated with 0.05% trypsin-EDTA (PAA), washed with serum-free growth medium, suspended in 1 ml of Diluent C for general membrane labeling (Sigma-Aldrich), and syringed once with a 25-gauge needle. For FACS, 2.5 × 10⁶ cells ml−1 were labeled with 1 μM PKH26 dye (Sigma-Aldrich) for 3 min according to the manufacturer's protocol. PKH26-labeled single cells were seeded at a cell density of 500 cells cm−2 and grown in mammosphere culture for 5 days as described for growth in anchorage-independent conditions. We regularly observe viable PKH26Bright single cells in our mammosphere cultures. To separate these PKH26Bright single cells from mammosphere-derived PKH26Bright cells, sphere cultures were centrifuged at 10 × g for 3 min, and supernatant (containing single cells) and pellet (containing mammospheres) were collected. Mammospheres were spun again at 115 × g for 5 min and enzymatically (0.05% trypsin-EDTA) and manually (25-gauge needle) dissociated, and washed twice with cold 1× PBS (pH 7.4) (Sigma-Aldrich) for downstream cell collection by FACS or microaspiration.
Single-Cell Gene Expression Analysis
The reader is referred to the Supplemental Experimental Procedures for a detailed description of applied methods used for single-cell gene expression profiling. In short, individual cells were collected by FACS or with a micromanipulator and subjected to direct cell lysis, and immediately frozen on dry ice. RNA was reverse transcribed followed by targeted cDNA pre-amplification using gene-specific oligonucleotides and quantitative real-time PCR to assess gene expression levels of selected genes.
Author Contributions
Conceptualization: N.A., A.S., G.L.; formal analysis: N.A., E.B., A.S., G.L.; investigation: N.A., D.A., E.B., P.G.; writing, original draft: N.A., A.S., G.L.; writing, review and editing: N.A., D.A., E.B., A.S., G.L.; visualization: N.A., A.S., G.L.; supervision: A.S., G.L.; project administration: A.S., G.L.; funding acquisition: A.S., G.L.
Acknowledgments
This work was supported by grants from Breakthrough Breast Cancer, the Swedish Cancer Foundation, the Swedish Research Council, Sahlgrenska Academy (ALF) at University of Gothenburg, and BioCARE National Strategic Research Program at University of Gothenburg.
Published: January 12, 2016
Footnotes
This is an open access article under the CC BY-NC-ND license (http://creativecommons.org/licenses/by-nc-nd/4.0/).
Supplemental Information includes Supplemental Experimental Procedures, seven figures, and six tables and can be found with this article online at http://dx.doi.org/10.1016/j.stemcr.2015.12.006.
Contributor Information
Anders Ståhlberg, Email: anders.stahlberg@gu.se.
Göran Landberg, Email: goran.landberg@gu.se.
Supplemental Information
References
- Al-Hajj M., Wicha M.S., Benito-Hernandez A., Morrison S.J., Clarke M.F. Prospective identification of tumorigenic breast cancer cells. Proc. Natl. Acad. Sci. USA. 2003;100:3983–3988. doi: 10.1073/pnas.0530291100. [DOI] [PMC free article] [PubMed] [Google Scholar]
- Badve S., Nakshatri H. Breast-cancer stem cells—beyond semantics. Lancet Oncol. 2012;13:e43–48. doi: 10.1016/S1470-2045(11)70191-7. [DOI] [PubMed] [Google Scholar]
- Bertos N.R., Park M. Breast cancer—one term, many entities? J. Clin. Invest. 2011;121:3789–3796. doi: 10.1172/JCI57100. [DOI] [PMC free article] [PubMed] [Google Scholar]
- Chaffer C.L., Brueckmann I., Scheel C., Kaestli A.J., Wiggins P.A., Rodrigues L.O., Brooks M., Reinhardt F., Su Y., Polyak K. Normal and neoplastic nonstem cells can spontaneously convert to a stem-like state. Proc. Natl. Acad. Sci. USA. 2011;108:7950–7955. doi: 10.1073/pnas.1102454108. [DOI] [PMC free article] [PubMed] [Google Scholar]
- Charafe-Jauffret E., Ginestier C., Monville F., Finetti P., Adelaide J., Cervera N., Fekairi S., Xerri L., Jacquemier J., Birnbaum D. Gene expression profiling of breast cell lines identifies potential new basal markers. Oncogene. 2006;25:2273–2284. doi: 10.1038/sj.onc.1209254. [DOI] [PubMed] [Google Scholar]
- Charafe-Jauffret E., Ginestier C., Iovino F., Wicinski J., Cervera N., Finetti P., Hur M.H., Diebel M.E., Monville F., Dutcher J. Breast cancer cell lines contain functional cancer stem cells with metastatic capacity and a distinct molecular signature. Cancer Res. 2009;69:1302–1313. doi: 10.1158/0008-5472.CAN-08-2741. [DOI] [PMC free article] [PubMed] [Google Scholar]
- Cheung T.H., Rando T.A. Molecular regulation of stem cell quiescence. Nat. Rev. Mol. Cell Biol. 2013;14:329–340. doi: 10.1038/nrm3591. [DOI] [PMC free article] [PubMed] [Google Scholar]
- D'Amato N.C., Ostrander J.H., Bowie M.L., Sistrunk C., Borowsky A., Cardiff R.D., Bell K., Young L.J., Simin K., Bachelder R.E. Evidence for phenotypic plasticity in aggressive triple-negative breast cancer: human biology is recapitulated by a novel model system. PLoS One. 2012;7:e45684. doi: 10.1371/journal.pone.0045684. [DOI] [PMC free article] [PubMed] [Google Scholar]
- D'Amour K.A., Agulnick A.D., Eliazer S., Kelly O.G., Kroon E., Baetge E.E. Efficient differentiation of human embryonic stem cells to definitive endoderm. Nat. Biotechnol. 2005;23:1534–1541. doi: 10.1038/nbt1163. [DOI] [PubMed] [Google Scholar]
- Dontu G., Abdallah W.M., Foley J.M., Jackson K.W., Clarke M.F., Kawamura M.J., Wicha M.S. In vitro propagation and transcriptional profiling of human mammary stem/progenitor cells. Genes Dev. 2003;17:1253–1270. doi: 10.1101/gad.1061803. [DOI] [PMC free article] [PubMed] [Google Scholar]
- Fillmore C.M., Kuperwasser C. Human breast cancer cell lines contain stem-like cells that self-renew, give rise to phenotypically diverse progeny and survive chemotherapy. Breast Cancer Res. 2008;10:R25. doi: 10.1186/bcr1982. [DOI] [PMC free article] [PubMed] [Google Scholar]
- Fukada S., Uezumi A., Ikemoto M., Masuda S., Segawa M., Tanimura N., Yamamoto H., Miyagoe-Suzuki Y., Takeda S. Molecular signature of quiescent satellite cells in adult skeletal muscle. Stem Cells. 2007;25:2448–2459. doi: 10.1634/stemcells.2007-0019. [DOI] [PubMed] [Google Scholar]
- Gao M.Q., Choi Y.P., Kang S., Youn J.H., Cho N.H. CD24+ cells from hierarchically organized ovarian cancer are enriched in cancer stem cells. Oncogene. 2010;29:2672–2680. doi: 10.1038/onc.2010.35. [DOI] [PubMed] [Google Scholar]
- Ginestier C., Hur M.H., Charafe-Jauffret E., Monville F., Dutcher J., Brown M., Jacquemier J., Viens P., Kleer C.G., Liu S. ALDH1 is a marker of normal and malignant human mammary stem cells and a predictor of poor clinical outcome. Cell Stem Cell. 2007;1:555–567. doi: 10.1016/j.stem.2007.08.014. [DOI] [PMC free article] [PubMed] [Google Scholar]
- Gupta P.B., Fillmore C.M., Jiang G., Shapira S.D., Tao K., Kuperwasser C., Lander E.S. Stochastic state transitions give rise to phenotypic equilibrium in populations of cancer cells. Cell. 2011;146:633–644. doi: 10.1016/j.cell.2011.07.026. [DOI] [PubMed] [Google Scholar]
- Harrison H., Farnie G., Howell S.J., Rock R.E., Stylianou S., Brennan K.R., Bundred N.J., Clarke R.B. Regulation of breast cancer stem cell activity by signaling through the Notch4 receptor. Cancer Res. 2010;70:709–718. doi: 10.1158/0008-5472.CAN-09-1681. [DOI] [PMC free article] [PubMed] [Google Scholar]
- Harrison H., Rogerson L., Gregson H.J., Brennan K.R., Clarke R.B., Landberg G. Contrasting hypoxic effects on breast cancer stem cell hierarchy is dependent on ER-alpha status. Cancer Res. 2013;73:1420–1433. doi: 10.1158/0008-5472.CAN-12-2505. [DOI] [PubMed] [Google Scholar]
- Huttmann A., Liu S.L., Boyd A.W., Li C.L. Functional heterogeneity within rhodamine123(lo) Hoechst33342(lo/sp) primitive hemopoietic stem cells revealed by pyronin Y. Exp. Hematol. 2001;29:1109–1116. doi: 10.1016/s0301-472x(01)00684-1. [DOI] [PubMed] [Google Scholar]
- Kim J., Villadsen R., Sørlie T., Fogh L., Gronlund S.Z., Fridriksdottir A.J., Kuhn I., Rank F., Wielenga V.T., Solvang H. Tumor initiating but differentiated luminal-like breast cancer cells are highly invasive in the absence of basal-like activity. Proc. Natl. Acad. Sci. USA. 2012;109:6124–6129. doi: 10.1073/pnas.1203203109. [DOI] [PMC free article] [PubMed] [Google Scholar]
- Li X., Lewis M.T., Huang J., Gutierrez C., Osborne C.K., Wu M.F., Hilsenbeck S.G., Pavlick A., Zhang X., Chamness G.C. Intrinsic resistance of tumorigenic breast cancer cells to chemotherapy. J. Natl. Cancer Inst. 2008;100:672–679. doi: 10.1093/jnci/djn123. [DOI] [PubMed] [Google Scholar]
- Liu H., Patel M.R., Prescher J.A., Patsialou A., Qian D., Lin J., Wen S., Chang Y.F., Bachmann M.H., Shimono Y. Cancer stem cells from human breast tumors are involved in spontaneous metastases in orthotopic mouse models. Proc. Natl. Acad. Sci. USA. 2010;107:18115–18120. doi: 10.1073/pnas.1006732107. [DOI] [PMC free article] [PubMed] [Google Scholar]
- Liu S., Cong Y., Wang D., Sun Y., Deng L., Liu Y., Martin-Trevino R., Shang L., McDermott S.P., Landis M.D. Breast cancer stem cells transition between epithelial and mesenchymal states reflective of their normal counterparts. Stem Cell Rep. 2014;2:78–91. doi: 10.1016/j.stemcr.2013.11.009. [DOI] [PMC free article] [PubMed] [Google Scholar]
- Meyer M.J., Fleming J.M., Lin A.F., Hussnain S.A., Ginsburg E., Vonderhaar B.K. CD44posCD49fhiCD133/2hi defines xenograft-initiating cells in estrogen receptor-negative breast cancer. Cancer Res. 2010;70:4624–4633. doi: 10.1158/0008-5472.CAN-09-3619. [DOI] [PMC free article] [PubMed] [Google Scholar]
- Moore N., Lyle S. Quiescent, slow-cycling stem cell populations in cancer: a review of the evidence and discussion of significance. J. Oncol. 2011;2011 doi: 10.1155/2011/396076. [DOI] [PMC free article] [PubMed] [Google Scholar]
- Nakshatri H., Srour E.F., Badve S. Breast cancer stem cells and intrinsic subtypes: controversies rage on. Curr. Stem Cell Res. Ther. 2009;4:50–60. doi: 10.2174/157488809787169110. [DOI] [PubMed] [Google Scholar]
- Neve R.M., Chin K., Fridlyand J., Yeh J., Baehner F.L., Fevr T., Clark L., Bayani N., Coppe J.P., Tong F. A collection of breast cancer cell lines for the study of functionally distinct cancer subtypes. Cancer Cell. 2006;10:515–527. doi: 10.1016/j.ccr.2006.10.008. [DOI] [PMC free article] [PubMed] [Google Scholar]
- Norrman K., Strombeck A., Semb H., Stahlberg A. Distinct gene expression signatures in human embryonic stem cells differentiated towards definitive endoderm at single-cell level. Methods. 2012;59:59–70. doi: 10.1016/j.ymeth.2012.03.030. [DOI] [PubMed] [Google Scholar]
- Pece S., Tosoni D., Confalonieri S., Mazzarol G., Vecchi M., Ronzoni S., Bernard L., Viale G., Pelicci P.G., Di Fiore P.P. Biological and molecular heterogeneity of breast cancers correlates with their cancer stem cell content. Cell. 2010;140:62–73. doi: 10.1016/j.cell.2009.12.007. [DOI] [PubMed] [Google Scholar]
- Perou C.M., Sørlie T., Eisen M.B., van de Rijn M., Jeffrey S.S., Rees C.A., Pollack J.R., Ross D.T., Johnsen H., Akslen L.A. Molecular portraits of human breast tumours. Nature. 2000;406:747–752. doi: 10.1038/35021093. [DOI] [PubMed] [Google Scholar]
- Polyak K. Heterogeneity in breast cancer. J. Clin. Invest. 2011;121:3786–3788. doi: 10.1172/JCI60534. [DOI] [PMC free article] [PubMed] [Google Scholar]
- Ponti D., Costa A., Zaffaroni N., Pratesi G., Petrangolini G., Coradini D., Pilotti S., Pierotti M.A., Daidone M.G. Isolation and in vitro propagation of tumorigenic breast cancer cells with stem/progenitor cell properties. Cancer Res. 2005;65:5506–5511. doi: 10.1158/0008-5472.CAN-05-0626. [DOI] [PubMed] [Google Scholar]
- Quintana E., Shackleton M., Foster H.R., Fullen D.R., Sabel M.S., Johnson T.M., Morrison S.J. Phenotypic heterogeneity among tumorigenic melanoma cells from patients that is reversible and not hierarchically organized. Cancer Cell. 2010;18:510–523. doi: 10.1016/j.ccr.2010.10.012. [DOI] [PMC free article] [PubMed] [Google Scholar]
- Reis-Filho J.S., Pusztai L. Gene expression profiling in breast cancer: classification, prognostication, and prediction. Lancet. 2011;378:1812–1823. doi: 10.1016/S0140-6736(11)61539-0. [DOI] [PubMed] [Google Scholar]
- Ricardo S., Vieira A.F., Gerhard R., Leitao D., Pinto R., Cameselle-Teijeiro J.F., Milanezi F., Schmitt F., Paredes J. Breast cancer stem cell markers CD44, CD24 and ALDH1: expression distribution within intrinsic molecular subtype. J. Clin. Pathol. 2011;64:937–946. doi: 10.1136/jcp.2011.090456. [DOI] [PubMed] [Google Scholar]
- Richichi C., Brescia P., Alberizzi V., Fornasari L., Pelicci G. Marker-independent method for isolating slow-dividing cancer stem cells in human glioblastoma. Neoplasia. 2013;15:840–847. doi: 10.1593/neo.13662. [DOI] [PMC free article] [PubMed] [Google Scholar]
- Rusnakova V., Honsa P., Dzamba D., Stahlberg A., Kubista M., Anderova M. Heterogeneity of astrocytes: from development to injury—single cell gene expression. PLoS One. 2013;8:e69734. doi: 10.1371/journal.pone.0069734. [DOI] [PMC free article] [PubMed] [Google Scholar]
- Sørlie T., Perou C.M., Tibshirani R., Aas T., Geisler S., Johnsen H., Hastie T., Eisen M.B., van de Rijn M., Jeffrey S.S. Gene expression patterns of breast carcinomas distinguish tumor subclasses with clinical implications. Proc. Natl. Acad. Sci. USA. 2001;98:10869–10874. doi: 10.1073/pnas.191367098. [DOI] [PMC free article] [PubMed] [Google Scholar]
- Stahlberg A., Bengtsson M. Single-cell gene expression profiling using reverse transcription quantitative real-time PCR. Methods. 2010;50:282–288. doi: 10.1016/j.ymeth.2010.01.002. [DOI] [PubMed] [Google Scholar]
- Stahlberg A., Andersson D., Aurelius J., Faiz M., Pekna M., Kubista M., Pekny M. Defining cell populations with single-cell gene expression profiling: correlations and identification of astrocyte subpopulations. Nucleic Acids Res. 2011;39:e24. doi: 10.1093/nar/gkq1182. [DOI] [PMC free article] [PubMed] [Google Scholar]
- Su Y., Subedee A., Bloushtain-Qimron N., Savova V., Krzystanek M., Li L., Marusyk A., Tabassum D.P., Zak A., Flacker M.J. Somatic cell fusions reveal extensive heterogeneity in basal-like breast cancer. Cell Rep. 2015;11:1549–1563. doi: 10.1016/j.celrep.2015.05.011. [DOI] [PubMed] [Google Scholar]
- Trapnell C., Cacchiarelli D., Grimsby J., Pokharel P., Li S., Morse M., Lennon N.J., Livak K.J., Mikkelsen T.S., Rinn J.L. The dynamics and regulators of cell fate decisions are revealed by pseudotemporal ordering of single cells. Nat. Biotechnol. 2014;32:381–386. doi: 10.1038/nbt.2859. [DOI] [PMC free article] [PubMed] [Google Scholar]
- Visvader J.E., Lindeman G.J. Cancer stem cells: current status and evolving complexities. Cell Stem Cell. 2012;10:717–728. doi: 10.1016/j.stem.2012.05.007. [DOI] [PubMed] [Google Scholar]
- Wykoff C.C., Beasley N.J.P., Watson P.H., Turner K.J., Pastorek J., Sibtain A., Wilson G.D., Turley H., Talks K.L., Maxwell P.H. Hypoxia-inducible expression of tumor-associated carbonic anhydrases. Cancer Res. 2000;60:7075–7083. [PubMed] [Google Scholar]
- Yu F., Yao H., Zhu P., Zhang X., Pan Q., Gong C., Huang Y., Hu X., Su F., Lieberman J. let-7 regulates self renewal and tumorigenicity of breast cancer cells. Cell. 2007;131:1109–1123. doi: 10.1016/j.cell.2007.10.054. [DOI] [PubMed] [Google Scholar]
- Zhang M., Atkinson R.L., Rosen J.M. Selective targeting of radiation-resistant tumor-initiating cells. Proc. Natl. Acad. Sci. USA. 2010;107:3522–3527. doi: 10.1073/pnas.0910179107. [DOI] [PMC free article] [PubMed] [Google Scholar]
Associated Data
This section collects any data citations, data availability statements, or supplementary materials included in this article.