

Transcription at the immunoglobulin heavy chain (Igh) locus targets class switch recombination (CSR)-associated DNA damage and is promoted by the BRCT domain-containing PTIP protein. Starnes et al. found that PTIP functions in transcription and CSR separately from its association with the MLL3/MLL4 complex and from its localization to sites of DNA damage.
Keywords: histone methylation, BRCT domains, DNA damage, antigen receptor rearrangements, 53BP1, PTIP
Abstract
Class switch recombination (CSR) diversifies antibodies for productive immune responses while maintaining stability of the B-cell genome. Transcription at the immunoglobulin heavy chain (Igh) locus targets CSR-associated DNA damage and is promoted by the BRCT domain-containing PTIP (Pax transactivation domain-interacting protein). Although PTIP is a unique component of the mixed-lineage leukemia 3 (MLL3)/MLL4 chromatin-modifying complex, the mechanisms for how PTIP promotes transcription remain unclear. Here we dissected the minimal structural requirements of PTIP and its different protein complexes using quantitative proteomics in primary lymphocytes. We found that PTIP functions in transcription and CSR separately from its association with the MLL3/MLL4 complex and from its localization to sites of DNA damage. We identified a tandem BRCT domain of PTIP that is sufficient for CSR and identified PA1 as its main functional protein partner. Collectively, we provide genetic and biochemical evidence that a PTIP–PA1 subcomplex functions independently from the MLL3/MLL4 complex to mediate transcription during CSR. These results further our understanding of how multifunctional chromatin-modifying complexes are organized by subcomplexes that harbor unique and distinct activities.
Careful coordination of immunoglobulin heavy chain (IgH) class switch recombination (CSR) is paramount for productive immune responses and the stability of the B-cell genome. Upon exposure to antigenic stimulation, mature naïve IgM-expressing B cells become activated, proliferate, express the AID cytidine deaminase, and undergo CSR to “switch” the constant region of their expressed antibodies to generate immunoglobulins such as IgG, IgE, or IgA with different effector functions (Daniel and Nussenzweig 2013). CSR at the Igh locus is driven by transcription through a particular switch region that produces a noncoding germline transcript (Alt et al. 2013; Stavnezer and Schrader 2014). Igh germline transcription through switch regions induces an open chromatin environment that reveals ssDNA to target AID (Chaudhuri et al. 2003; Ramiro et al. 2003; Yu et al. 2003a). AID activity at the Igh locus leads to DNA double-strand breaks (DSBs) that are repaired by nonhomologous end joining (NHEJ) to promote IgH class switching (Daniel and Nussenzweig 2012; Alt et al. 2013). In addition to DSBs at Igh, AID can target other loci, including oncogenes, which can lead to chromosomal translocations and tumorigenesis; moreover, active transcription and its associated histone modifications have been found to strongly correlate with AID-induced translocations (Kenter 2012; Robbiani and Nussenzweig 2013). Therefore, understanding the molecular mechanisms underlying transcription within the various switch regions at the Igh locus is of crucial importance to fully appreciate the targeting and regulation of AID activity for both IgH CSR and genome stability.
The Pax transactivation domain-interacting protein (PTIP) is a ubiquitously expressed, nuclear-localized protein with dual functions in DNA repair and transcriptional regulation. The PTIP protein contains six (BRCA1 C-terminal) BRCT domains that are predominantly found in DNA damage/repair proteins (Manke et al. 2003; Yu et al. 2003b). Indeed, in response to ionizing radiation (IR), PTIP forms nuclear foci and associates with 53BP1 via its C-terminal BRCT domains (Manke et al. 2003; Munoz et al. 2007; Gong et al. 2009; Wu et al. 2009). PTIP function in DNA repair has been primarily linked to the NHEJ pathway as a major 53BP1 effector that can block DSB end resection (Callen et al. 2013) in part through its recruitment of the Artemis nuclease (Wang et al. 2014). However, in the absence of DNA damage, PTIP is a component of the mixed-lineage leukemia 3 (MLL3/KMT2C)–MLL4/KMT2D Set1-like lysine methyltransferase complex that contains the ASH2L, RBBP5, WDR5, and DPY30 subunits common to all Set1-like complexes as well as the unique subunits PA1, UTX, and NCOA6 (Cho et al. 2007; Issaeva et al. 2007; Patel et al. 2007). This complex catalyzes methylation marks on histone H3 Lys4 (H3K4) that are found at promoter regions and further enriched on enhancers (Lee et al. 2013; Herz et al. 2014; Heinz et al. 2015; Rao and Dou 2015).
It is generally accepted that PTIP promotes transcription by functioning as an adaptor to recruit the MLL3/MLL4 methyltransferase complex to gene-specific promoters/enhancers, thereby regulating the deposition of H3K4me and gene expression. Correlative relationships have been made from observing impaired H3K4me and transcription in PTIP-deficient embryonic stem cells (Kim et al. 2009) and during development (Patel et al. 2007; Cho et al. 2009; Daniel et al. 2010). For example, we and others have shown that PTIP plays a critical role in promoting selective transcription at Igh-γ1, Igh-γ2b, and Igh-γ3 switch regions necessary for class switching to IgG isotypes IgG1, IgG2b, and IgG3, respectively, but not IgE in B lymphocytes (Daniel et al. 2010; Schwab et al. 2011; Callen et al. 2013). Thus, despite the critical role of PTIP in two different cellular processes (DSB repair and transcription), mechanistic dissection of the protein to understand how the six different BRCT domains may separate these disparate functions is lacking.
Here we dissected the minimal structural requirements for the functions of a multiple BRCT domain-containing protein in an unprecedented manner using genetics and quantitative interaction proteomics. Specifically, by using IgH CSR in B cells, our study demonstrates for the first time a function for the PTIP–PA1 subcomplex, providing mechanistic insight into how PTIP can promote transcription at multiple genes independently from the associated MLL3/MLL4 complex.
Results
Endogenously expressed PTIP associates with the MLL3/MLL4 methyltransferase complex in B cells
To determine the associated proteins of endogenously expressed PTIP in primary tissues, we generated a novel knock-in mouse model, PTIPgfp, that expresses a GFP tag fused in-frame to the C terminus of PTIP at the endogenous PTIP locus (Supplemental Fig. 1A,B). Homozygous PTIPgfp mice are born and survive, at least to 1.2 yr of age, with similar frequency to control mice, and PTIPgfp/gfp primary mouse embryonic fibroblasts (MEFs) grow indistinguishably from controls (Supplemental Fig. 1C–E). PTIP-GFP protein was readily visualized in primary cells by Western blotting and flow cytometry (Supplemental Fig. 1F,G). Although we chose to epitope tag PTIP at its C terminus for this knock-in mouse, we found that N-terminally or C-terminally tagged PTIP proteins formed IR-induced foci and rescued the IgH CSR defects of CD19cre/+ PTIPflox/flox B cells (referred to here as PTIP−/− B cells) indistinguishably (Supplemental Fig. 2). Importantly, B cells from PTIPgfp/gfp mice show IgH class switching frequencies indistinguishable from control cells (Supplemental Fig. 1H).
To determine endogenous PTIP-associated proteins in B cells stimulated ex vivo from PTIPgfp mice, stable isotope labeling by amino acids in cell culture (SILAC)-based quantitative proteomic analysis was performed. We observed MLL3/MLL4 complex-specific proteins PA1 and NCOA6 and the common Set1-like components ASH2L, RBBP5, and WDR5 to be enriched approximately twofold in PTIP immunoprecipitates compared with GFP pull-down from littermate control B cells (Fig. 1A; Supplemental Table 1). Moreover, the MLL3/MLL4 complex components were similarly observed from both homozygous and heterozygous PTIPgfp B cells (Fig. 1A; Supplemental Table 1). A similarly repeated SILAC pull-down interactome experiment in B cells from PTIPgfp/gfp mice confirmed association of all known components of the Set1-like complex, including MLL4, UTX, and PA1 (Supplemental Table 1), which was further validated by pull-downs followed by Western blotting (Fig. 1B). Analysis of the three SILAC interactomes from PTIPgfp mice using an intensity-based absolute quantification (iBAQ) algorithm (Schwanhausser et al. 2011) suggested that PTIP and PA1 exist in a complex with 1:1 stoichiometry in B cells (Supplemental Fig 1I), which was in stark contrast to other Set1-like components that were at least 10-fold lower in their stoichiometry with PTIP (Supplemental Fig. 1I). We conclude that a fraction of endogenously expressed PTIP is a component of the MLL3/MLL4 methyltransferase complex in stimulated B cells and that PTIP and PA1 exist in a 1:1 subcomplex distinct from the Set1-like complex.
Figure 1.

Association with the MLL3/MLL4 complex in B cells is dispensable for PTIP function in Igh class switching. (A) Mass spectrometric identification of proteins in PTIP-GFP pull-downs from PTIPgfp B cells. Shown is a scatter plot of log2 transformed normalized SILAC (M/L) PTIPgfp/+/ control ratios on the X-axis and (H/L) PTIPgfp/gfp/control ratios on the Y-axis. Control refers to a wild-type PTIP+/+ littermate. MLL3/MLL4 complex components are shown in red (see also Supplemental Table 1). (B) PTIPgfp/gfp and PTIP+/+ littermate control B cells were stimulated for 3 d in the IgG3 condition. A representative Western blot from two independent experiments (n = 2 mice of each genotype) is shown from lysates immunoprecipitated with GFP beads to detect coimmunoprecipitated proteins ASH2L, RBBP5, and PA1. An anti-GFP antibody was used to detect endogenous PTIP. (C) Diagram of the N-terminal GFP-tagged PTIP retroviral constructs used, including the mCherry reporter. (Numbers) BRCT domains; (Q) glutamine-rich region; (NLS) nuclear localization signal. (D) PTIP−/− B cells were stimulated in the IgG3 condition and transduced with the indicated retroviruses. A representative Western blot from two independent transduction experiments (n = 2 mice) is shown from lysates immunoprecipitated with GFP beads to detect coimmunoprecipitated proteins ASH2L, RBBP5, and PA1. An anti-GFP antibody was used to detect PTIP. (E) Flow cytometry analyses of PTIP−/− B cells transduced with the indicated retroviruses stimulated for 3 d after transduction in the IgG3 condition. (Top) Dot plot indicating IgG3 CSR as a percentage of the full-length PTIP (FL) mCherry-positive value in the same experiment. Each dot within a group represents transduced B cells from a different PTIP−/− mouse (n = 5 for each group). Data are represented as mean. FL versus ΔBRCT3–6 and FL versus ΔBRCT5–6, P > 0.1, which is not significant (ns); FL versus empty vector mCherry-positive, (***) P = 0.0003; FL versus empty vector mCherry-negative, (****) P < 0.0001. Statistics were performed using a two-tailed unpaired t-test with Welch's correction. (Bottom) Representative flow cytometry plots measuring IgG3+ frequency in mCherry-positive cells. Numbers in the top half of each plot indicate the frequency of IgG3+ class-switched cells. (F) Quantitative real-time PCR of Igh-γ3 germline transcripts and PTIP expression in PTIP−/− or PTIP+/+ B cells transduced with the indicated retroviruses stimulated for 3 d after transduction in the IgG3 condition. Cells were sorted into mCherry-positive and mCherry-negative populations, and their expression levels are plotted relative to FL mCherry-positive PTIP−/− B cells. Data are from three independent transduction/sorting experiments (n = 3 mice) represented as mean ± SEM. (G) Western blot of PTIP and mCherry expression from FACS-sorted PTIP−/− B cells transduced with PTIP retroviral constructs, based on mCherry expression. The “mCherry–” lane is a pooled sample of mCherry-negative cells across all samples. See also Supplemental Figures 1–3.
PTIP promotes IgH class switching independently from the associated MLL3/MLL4 methyltransferase complex
To assess whether PTIP function in IgH class switching is dependent on its interaction with the MLL3/MLL4 methyltransferases, we generated a panel of GFP-PTIP deletion mutants cloned into retroviral vectors expressing an IRES-mCherry reporter (Fig. 1C). The retrovirally expressed mutant and control PTIP proteins were verified to localize to the nucleus of immortalized PTIP−/− MEFs (Supplemental Fig. 3A). Moreover, cells expressing full-length PTIP (FL) or a PTIP truncation mutant that deletes BRCT5–6 (ΔBRCT5–6) showed accumulation of PTIP into foci that colocalize with 53BP1 after IR, while deletion of BRCT3–6 (ΔBRCT3–6) abolished PTIP foci formation (Supplemental Fig. 3A), consistent with previous reports (Munoz et al. 2007; Gong et al. 2009; Daniel et al. 2010; Callen et al. 2013). Ectopic expression and pull-down analyses of these retrovirally expressed mutant and control PTIP proteins from stimulated PTIP−/− B cells revealed that BRCT domains 5 and 6 are necessary for the association of PTIP with ASH2L and RBBP5 but had no effect on the association of PA1 (Fig. 1D). Similar results were obtained from retrovirally transduced PTIP−/− MEFs (Supplemental Fig. 3B). We conclude that the PTIP BRCT5–6 domains are responsible for its association with the MLL3/MLL4 methyltransferase complex.
To determine whether PTIP association with the MLL3/MLL4 complex is important for CSR, PTIP−/− B cells were transduced with retroviruses expressing BRCT mutant or FL control containing an IRES-mCherry reporter, and the cells were stimulated to undergo class switching to IgG3. We found that mCherry-positive cells transduced with FL retrovirus rescued the IgG3 class switching defect of PTIP−/− B cells, as measured by IgG3 cell surface expression (Fig. 1E). In addition, RNA extracted from FACS-sorted mCherry-positive and mCherry-negative populations after transduction showed that Igh-γ3 germline transcription in PTIP−/− cells was rescued to that of CD19cre/+ PTIP+/+ (referred to here as PTIP+/+) cells upon expression of FL (Fig. 1F). Surprisingly, cell surface expression of IgG3 and Igh-γ3 germline transcription was also fully rescued by expression of ΔBRCT5–6 or ΔBRCT3–6 mutants (Fig. 1E,F). For each experiment, the rescued class switching defects were always made in relation to FL and compared with empty vector transduced and nontransduced cells (Fig. 1E,F) and were not due to gross differences in PTIP expression levels of the constructs, as measured at the mRNA (Fig. 1F) and protein level from FACS-sorted B cells (Fig. 1G, cf. lanes 1–4). We conclude that PTIP functions in stimulated B cells to drive IgH class switching independently from association with the MLL3/MLL4 methyltransferase complex.
The MLL3 and MLL4 methyltransferases are dispensable for germline transcription at Igh switch regions
To directly assess whether the MLL3/MLL4 methyltransferases are involved in IgH class switching, MLL3/MLL4 double-deficient B cells were generated by crossing MLL3flox/flox mice (Lee et al. 2006) with MLL4flox/flox mice (Lee et al. 2013) and subsequently deleting the two genes ex vivo using retroviral transduction and expression of GFP-tagged Cre recombinase. Quantitative real-time PCR analyses of RNA extracted from FACS-sorted GFP-positive MLL3flox/floxMLL4flox/flox cells indicated >90% deletion of both MLL3 and MLL4 in Cre transduced cells compared with cells transduced with catalytically inactive Cre* (Fig. 2A). Across subsequent days in culture, the frequency of GFP-positive B cells measured by flow cytometry decreased comparably in Cre and Cre* transduced cells, suggesting that ex vivo deletion of MLL3 and MLL4 does not impair B-cell growth (Fig. 2B). To determine whether the MLL3/MLL4 methyltransferases regulate IgH class switching, Cre and Cre* transduced B cells were stimulated to undergo class switching to IgG3 or IgG1. Flow cytometry analyses revealed a 2.0-fold defect in IgG3 class switching and a 1.6-fold defect in IgG1 class switching within Cre transduced MLL3/MLL4 double-deficient B cells compared with Cre* controls (Fig. 2C,D). To establish whether the MLL3/MLL4 methyltransferases promote CSR similarly to PTIP, B cells retrovirally transduced with Cre or Cre* were stimulated ex vivo to undergo IgG class switching, and RNA was extracted from FACS-sorted GFP-positive cells for quantitative real-time PCR analyses of Igh-γ germline transcripts. Even though MLL3/MLL4 double deficiency led to decreased class switching, MLL3/MLL4 double-deficient B cells displayed normal Igh-γ3 and Igh-γ1 germline transcription (Fig. 2E). Therefore, in contrast to PTIP, our results demonstrate that the MLL3/MLL4 methyltransferases are dispensable for Igh germline transcription and suggest that MLL3/MLL4 promote CSR downstream from PTIP through a mechanism that remains to be elucidated. Nevertheless, these results from MLL3/MLL4 double-deficient B cells are consistent with and strengthen our conclusion that PTIP promotes Igh germline transcription independently from the associated MLL3/MLL4 methyltransferase complex.
Figure 2.

MLL3/MLL4 methyltransferases are dispensable for Igh germline transcription. (A) Quantitative real-time PCR of MLL3 and MLL4 expression in Cre and Cre* transduced MLL3flox/floxMLL4flox/flox B cells 3 d after stimulation in the IgG3 condition. GFP-positive cells were sorted, and the expression levels are plotted relative to Cre* transduced cells. Data are from four independent experiments (n = 9 mice) and are represented as mean ± SEM. (B) Flow cytometry analyses of the GFP frequencies across subsequent days in culture in Cre and Cre* transduced MLL3flox/flox MLL4flox/flox B cells. Data are from n = 3 mice and are represented as mean ± SEM. (C) Flow cytometry analyses of Cre and Cre* transduced MLL3flox/floxMLL4flox/flox B cells 5 d after stimulation in the IgG3 and IgG1 condition. The dot plot indicates IgG3 or IgG1 CSR relative to the GFP-negative population. For each experiment, B cells from each mouse were transduced with Cre and Cre* virus. Each dot within a group represents transduced B cells from a different MLL3flox/floxMLL4flox/flox mouse (n = 12 for IgG3; n = 6 for IgG1). Data are represented as mean. IgG3 Cre* versus Cre, (****) P < 0.0001; IgG1 Cre* versus Cre, (***) P = 0.0008. Statistics were performed using a two-tailed unpaired t-test with Welch's correction. (D) Representative flow cytometry plots measuring IgG3 and IgG1 frequencies in Cre and Cre* transduced GFP-positive and GFP-negative MLL3flox/floxMLL4flox/flox B cells. Numbers in the top half of each plot indicate frequency in IgG3 and IgG1 class-switched cells. (E) Quantitative real-time PCR of Igh-γ3 and Igh-γ1 germline transcripts in Cre and Cre* transduced MLL3flox/floxMLL4flox/flox B cells. GFP-positive cells were sorted, and their expression levels are plotted relative to Cre* transduced cells. Data are from four independent experiments for IgG3 and one experiment for IgG1 (n = 9 for IgG3; n = 3 for IgG1).
The N-terminal BRCT1 and BRCT2 domains of PTIP are required and sufficient for PTIP function in IgH class switching
Our results demonstrate that the four C-terminal BRCT domains of PTIP are dispensable for IgH class switching (Fig. 1). To determine which domain at the N terminus is important, we designed several additional PTIP mutant retroviral constructs, including a deletion of BRCT1–2 (ΔBRCT1–2), individual deletions of BRCT1 (ΔBRCT1) or BRCT2 (ΔBRCT2), and two different point mutations of BRCT1 and BRCT2, W75R and W165R, respectively (Fig. 3A). These specific Trp residues were chosen because they are highly conserved within the predicted α3 helix of the BRCT domain that participates in ligand binding, and mutations in conserved residues abolish, for example, protein interactions of XRCC1 BRCT domain binding to DNA ligase III (Dulic et al. 2001) as well as PTIP BRCT domain binding to 53BP1 (Munoz et al. 2007). Rescue experiments using PTIP−/− B cells transduced with the retroviral constructs and stimulated ex vivo revealed that ΔBRCT1–2 severely impaired Igh-γ3 germline transcription and IgG3 class switching similar to empty vector controls (Fig. 3B,C). A similar lack of rescue in Igh-γ3 germline transcription and IgG3 class switching was observed for the W75R and W165R point mutants and the mutants with deletion of the individual BRCT domains, ΔBRCT1 and ΔBRCT2 (Fig. 3B,C). Remarkably, we found that Igh-γ3 transcription and IgG3 class switching in PTIP−/− B cells can be fully restored to FL levels with expression of ΔBRCT3–6 + Q alone, and we found this rescue to be abolished with the sole W75R point mutation (ΔBRCT3–6 + Q W75R) (Fig. 3B,C). FACS-sorted mCherry-positive B cells showed similar levels of PTIP mRNA and protein across all constructs (Figs. 1G [cf. lanes 1,4–7], 3B,D). Importantly, all of the above-mentioned N-terminal BRCT mutant PTIP proteins showed normal accumulation at sites of IR-induced DNA damage with the exception of ΔBRCT3–6, ΔBRCT3–6 + Q, and ΔBRCT3–6 + Q W75R mutants (Supplemental Fig. 3A), which do not interact with 53BP1 (Munoz et al. 2007; Gong et al. 2009). We conclude that the N-terminal BRCT1 and BRCT2 domains of PTIP are required and sufficient for PTIP function in promoting the Igh germline transcription crucial for IgG3 class switching yet are dispensable for accumulation at sites of DNA damage.
Figure 3.

PTIP N-terminal BRCT domains are required and sufficient for PTIP function in Igh class switching. (A) Diagram of the N-terminal GFP-tagged PTIP retroviral constructs used, as in Figure 1C. (B) Quantitative real-time PCR of Igh-γ3 germline transcripts and PTIP expression from PTIP−/− B cells as in Figure 1F. Data are from three independent transduction/sorting experiments (n = 3 mice) and are represented as mean ± SEM. (C) Flow cytometry analyses of PTIP−/− B cells transduced with the indicated retroviruses as in Figure 1E. FL, n = 9; empty, n = 9; ΔBRCT1–2, n = 6; W75R, n = 6; ΔBRCT3–6 + Q, n = 6; ΔBRCT3–6 + Q W75R, n = 3; ΔBRCT1, n = 3; ΔBRCT2, n = 3; W165R, n = 3. Data are represented as mean. FL versus ΔBRCT1–2, (****) P < 0.0001; FL versus ΔBRCT3–6 + Q, P > 0.1, which is not significant (ns); FL versus ΔBRCT3–6 + Q W75R, (**) P = 0.0021; FL versus W75R, (****) P < 0.0001; FL versus ΔBRCT1, (****) P < 0.0001; FL versus ΔBRCT2, (**) P = 0.0030; FL versus W165R, (*) P = 0.0135; FL versus empty vector, (****) P < 0.0001. Statistics were performed using a two-tailed unpaired t-test with Welch's correction. (D) Western blots of PTIP and mCherry expression from FACS-sorted PTIP−/− B cells transduced with PTIP retroviral constructs, based on mCherry expression as described in Figure 1G. (E) Quantitative real-time PCR of Igh-γ2b germline transcripts and Il6 and PTIP expression from PTIP−/− B cells transduced with the indicated retroviruses as in B. Data are from a single transduction/sorting experiment (n = 1 mouse) and are represented as mean ± SD. See also Supplemental Figures 3 and 4.
Consistent with previous reports that the 53BP1–PTIP interaction requires DNA damage and ATM-dependent phosphorylation events (Manke et al. 2003; Munoz et al. 2007; Callen et al. 2013), we found that 53BP1 only weakly interacts with FL in the absence of exogenous DNA damage (Supplemental Figs. 3C, 4A). Indeed, GFP-PTIP pull-downs from reconstituted PTIP−/− B cells show that ΔBRCT1–2 does not further impair the weak association of 53BP1 to PTIP (Supplemental Fig. 4A). Moreover, 53BP1−/− B cells displayed normal Igh-γ3, Igh-γ1, and Igh-μ germline transcription (Supplemental Fig. 3D), consistent with previous reports (Manis et al. 2004; Ward et al. 2004). Together with the fact that PTIP-deficient cells show normal 53BP1 accumulation into IR-induced and CSR-associated foci (Daniel et al. 2010; Gong et al. 2009), these results strongly argue against impaired 53BP1 recruitment or function as the cause of the IgH class switching defect.
To determine whether the PTIP separation of function that we observed at Igh-γ3 was relevant to other loci controlled by PTIP, we examined Igh-γ2b germline transcription, Il6 transcription, and IgG1 surface expression (Daniel et al. 2010). Indeed, a rescue in transcription at all loci tested as well as IgG1 surface expression were observed with ΔBRCT5–6 and FL control retroviruses but not with retroviruses expressing mutant PTIP disrupted at its N terminus (Fig. 3E; Supplemental Fig. 4B). To assess whether mutant PTIP protein confers a dominant-negative interfering activity, PTIP+/+ B cells were transduced with retrovirus expressing the various mutant PTIP proteins, and IgG3 surface expression was measured; however, we did not see any major changes in IgG3 class switching with transduced cells compared with nontransduced (Supplemental Fig. 4C). Collectively, our data demonstrate that the transcriptional regulation of several PTIP-dependent genes requires an intact N terminus of the protein, while the C terminus is dispensable. These data are in stark contrast to how PTIP has been proposed to function in transcription via recruitment of the MLL3/MLL4 methyltransferase complex (Issaeva et al. 2007; Patel et al. 2007; Cho et al. 2009; Daniel et al. 2010).
The PTIP N-terminal tandem BRCT domain associates with and is stabilized by PA1
To identify proteins that associate with the N terminus of PTIP and may be important for Igh germline transcription, we used SILAC-based quantitative mass spectrometry. Primary PTIP−/− B cells were stimulated and transduced with either empty vector, FL, or the ΔBRCT1–2 mutant retroviruses. Three days later, GFP pull-downs identified several MLL3/MLL4 complex component proteins by mass spectrometry, including ASH2L, RBBP5, DPY30, WDR5, UTX, and NCOA6 that were specifically enriched in FL compared with empty vector (Fig. 4A; Supplemental Table 1). PTIP and PA1 were similarly enriched in the FL pull-down (SILAC ratios of 7.7 and 7.7 for PTIP and PA1, respectively), while PA1 recovery was abrogated in the ΔBRCT1–2 pull-down (SILAC ratios of 5.0 and 1.6 for PTIP and PA1, respectively) (Fig. 4A; Supplemental Table 1). Similar results were obtained using two alternative methods for cell lysis (Supplemental Fig. 5A,B; Supplemental Table 1). As a complementary approach, we performed a similarly designed SILAC pull-down focused entirely on the N terminus of PTIP that is sufficient for IgH class switching. Strikingly, PA1 was the only protein with a SILAC ratio >4 in the ΔBRCT3–6 + Q pull-down (Fig. 4B; Supplemental Table 1); moreover, the ΔBRCT3–6 + Q W75R mutant was similarly associated with PA1 (Fig. 4B; Supplemental Table 1). Additionally, the W75R mutation had no effect on PTIP-associated proteins in a similar SILAC-based quantitative proteomics experiment comparing the W75R mutant and control proteins (Supplemental Fig. 5C; Supplemental Table 1). Possible explanations for the transcriptional defects observed in PTIP BRCT1 mutant cells showing normal association to PA1 are described later in the discussion. We conclude that PA1 is the sole protein stably associating with the PTIP N-terminal BRCT domains. These data suggest that a stable PTIP–PA1 subcomplex is sufficient for PTIP function in transcription.
Figure 4.

PA1 is the only protein stably associating with the PTIP N-terminal BRCT domains in B cells. (A,B, top) Diagram of the N-terminal GFP-tagged PTIP retroviral constructs used. (Bottom) Mass spectrometric identification of proteins in GFP-PTIP pull-downs from PTIP−/− B cells transduced with the indicated retroviruses. (A) A scatter plot of log2 transformed normalized SILAC (M/L) FL/empty vector ratios on the X-axis and (H/L) ΔBRCT1–2/empty vector ratios on the Y-axis. (B) A plot of log2 transformed normalized SILAC (M/L) ΔBRCT3–6 + Q/empty vector ratios on the X-axis and (H/L) ΔBRCT3–6 + Q W75R/empty vector ratios on the Y-axis. MLL3/MLL4 complex components are shown in red (see also Supplemental Table 1). (C) PTIP−/− B cells were stimulated and transduced with the indicated retroviruses. A Western blot is shown from lysates immunoprecipitated with GFP beads to detect coimmunoprecipitated proteins as in Figure 1D. (D) Western blot analysis of a Strep-Tactin pull-down of recombinant PTIP and PA1 proteins. Flag antibody was used to detect PA1, and Strep antibody was used to detect the PTIP N-terminal tandem BRCT domain. Shown below is the Ponceau S staining of the membrane. BSA was included to block nonspecific binding to beads. (E) Thermodynamics of the PTIP–PA1 interaction. Calorimetry data for the titration of Flag-PA1 into Strep-PTIP. The top panel shows energy (differential power [DP]) released after each injection; the bottom panel shows the integrated heat effect normalized to the number of moles of Flag-PA1 at each injection step. The solid line represents the fit of the experimental data to the 1:1 single-site binding model. The best-fit parameters correspond to the thermodynamic characteristics of the binding interactions: ΔH° = −26 kcal/mol; −TΔS = +15 kcal/mol; KD = 7.1 nM ± 2.4 nM. See also Supplemental Figure 5.
To verify and extend our proteomic interaction data, we performed additional PTIP pull-downs and Western blotting from our transduced primary PTIP−/− B cells and found that PTIP association to PA1 was abolished in ΔBRCT1–2 cells and also that PA1 binding did not depend on W75 within the BRCT1 domain of FL (Fig. 4C). Similar results were obtained from PTIP−/− MEFs transduced with retrovirus expressing the W75R mutant (Supplemental Fig. 5D). Consistent with the PTIP–PA1 interaction occurring independently from IR-induced DNA damage (Gong et al. 2009), we found that the PTIP N-terminal BRCT domain fragment associated with PA1 similarly in AID−/− and control B cells, indicating that the PTIP–PA1 interaction in B cells is not dependent on AID-induced DNA damage (Supplemental Fig. 5E). Additional GFP pull-down analysis from PTIP−/− MEFs showed that association of PA1 is severely impaired by the W165R mutation in BRCT2 (Supplemental Fig. 5D). These data are consistent with another report showing that deletion of the individual BRCT2 domain of PTIP in human cells abolishes its interaction with PA1 (Gong et al. 2009). We conclude that the W165 residue within the BRCT2 domain is necessary for PTIP association to PA1.
To gain insight into how the PTIP–PA1 subcomplex functions, we performed a biophysical characterization of this interaction using purified recombinant proteins. Confirming previously reported coprecipitation data showing that PTIP and PA1 directly associate with each other (Cho et al. 2007; Gong et al. 2009), we found that a Strep-tagged N-terminal BRCT1–2 domain fragment of PTIP was able to coprecipitate Flag-tagged full-length PA1 in a pull-down assay (Fig. 4D). To extend these results beyond observations on immobilized beads, we directly measured the binding affinity of the subcomplex in solution with isothermal titration calorimetry (ITC). The titration curve of the PTIP–PA1 interaction was best fit to a single-site binding model with a 1:1 molar ratio and dissociation constant (KD) of 7.1 nM ± 2.4 nM (Fig. 4E). Moreover, the PTIP–PA1 subcomplex formation was characterized by two additional properties: a favorable binding enthalpy (ΔH° = −26 kcal/mol at 25°C), suggesting that a fairly large number of bonding interactions (e.g., hydrogen bonds and van der Waals interactions) are formed upon binding, and an unfavorable entropic contribution (−TΔS = +15 kcal/mol at 25°C), indicating a loss in the degree of conformational freedom upon binding (Fig. 4E). Furthermore, the PTIP N-terminal fragment in complex with PA1 was found to have a much higher thermal stability than either PTIP alone (37.7°C) or PA1 alone (no cooperative thermal transition, indicating the absence of tertiary structure), showing a midpoint of thermal unfolding at 50.0°C (Supplemental Fig. 5F). Thus, thermal stability measurements indicate that PA1 binding stabilizes PTIP by >12°C. We conclude that the PTIP N-terminal tandem BRCT domain and PA1 proteins directly associate and stabilize each other in a complex with 1:1 stoichiometry.
PA1 promotes Igh germline transcription and IgH class switching
Since deletion of BRCT2 or, more specifically, the W165R point mutation abolishes PTIP function in Igh germline transcription and disrupts PTIP association with PA1, we wished to investigate whether PA1 deficiency resembled PTIP deficiency in B cells. To bypass the early embryonic lethality observed in PA1−/− mice (Kumar et al. 2014), we crossed PA1flox/flox mice with CD21cre mice to generate mature B-cell-specific PA1 knockout mice (referred to here as PA1−/−). Analysis of PA1−/− B cells revealed reduced PA1 protein (Fig. 5A) with proliferation rates similar to controls (Supplemental Fig. 6A). In PA1−/− B cells, we observed a defect in germline Igh-γ3 switch transcripts similar to PTIP−/− cells (Fig. 5B) as well as a threefold reduction in IgG3 surface expression (Fig. 5C). Furthermore, ChIP-seq (chromatin immunoprecipitation [ChIP] combined with deep sequencing) analysis of PA1−/− B cells stimulated ex vivo showed severely impaired H3K4me3 at the Igh-γ3 and Igh-γ2b loci (Fig. 5D), similar to PTIP−/− B cells (Daniel et al. 2010). We conclude that PA1 promotes germline switch region transcription, H3K4me3, and class switching to IgG3.
Figure 5.

Immunoglobulin class switching defects in PA1−/− B cells. (A) Western blot from PA1−/− and control B cells showing the deletion efficiency of PA1. (B) Quantitative real-time PCR analysis of germline Igh-γ1 and Igh-ε transcription from B cells stimulated in the IgG1/IgE condition for 5 d and germline Igh-γ3 transcription from B cells stimulated in the IgG3 condition for 3 d. Data are from n = 3 mice of each genotype: PTIP+/+, PTIP−/−, PA1+/+, and PA1−/−. Data are from two independent experiments and are represented as mean ± SEM plotted relative to their respective wild type (+/+). (C) Dot plot depicting the frequency of IgG3+ cells after 3 d of culture from PTIP−/−, PA1−/−, and control mice as determined by flow cytometry. Each dot represents one mouse (n = 3 for PTIP mice; n = 5 for PA1 mice). Data are represented as mean. PTIP+/+ versus PTIP−/−, (*) P = 0.0155; PA1+/+ versus PA1−/−, (***) P = 0.0010. Statistics were performed using a two-tailed unpaired t-test with Welch's correction. (D) H3K4me3 ChIP-seq profiles across the Igh constant region locus in B cells stimulated in the IgG3 condition. Blue rectangles indicate constant region exon segments, pink ovals indicate switch regions, orange ovals indicate enhancers, and the black rectangle indicates the antigen recognition V(D)J gene segment. The μ, γ3, γ1, γ2b, and γ2a isotypes correspond to immunoglobulins IgM, IgG3, IgG1, IgG2b, and IgG2a. (E, left) Dot plot indicating IgE and IgG1 CSR as a percentage of wild-type (+/+) switching as determined by flow cytometry on day 5 of stimulation in the IgG1/IgE condition. Each dot represents one mouse (n = 3 for PTIP and PA1 mice). Data are represented as mean. IgE switching: PTIP+/+ versus PTIP−/−, P > 0.1, which is not significant (ns); PA1+/+ versus PA1−/−, (*) P = 0.0197. IgG1 switching: PTIP+/+ versus PTIP−/−, (***) P = 0.0008; PA1+/+ versus PA1−/−, (***) P = 0.0002. Statistics were performed using a two-tailed unpaired t-test with Welch's correction. (Right) Representative flow cytometry plots from one mouse of each genotype measuring IgG1+ frequency on the Y-axis and IgE+ frequency on the X-axis. See also Supplemental Figure 6.
To further investigate the similarity between PTIP and PA1 deficiencies in IgH class switching, we stimulated mutant and control B cells to undergo class switching to IgG1 and IgE and assayed these responses. Similar to PTIP−/− B cells (Daniel et al. 2010; Callen et al. 2013), PA1−/− B cells showed impaired Igh-γ1 germline transcription and IgG1 class switching frequencies together with normal Igh-ε germline transcription and IgE CSR frequencies (Fig. 5B,E; Supplemental Fig. 6B). Also similar to PTIP−/− B cells (Daniel et al. 2010), Igh-μ germline transcription and AID expression were indistinguishable between PA1−/− and control B cells (Supplemental Fig. 6C). We conclude that, similar to PTIP, PA1 promotes selective germline transcription and class switching to IgG3 and IgG1 but not IgE. Together with our results showing that the functional domains of PTIP are similar for both IgG1 and IgG3 (Fig. 3; Supplemental Fig. 4B), these data demonstrate that PA1 regulates IgG1 CSR similar to PTIP by promoting Igh-γ1 germline transcription.
PTIP and PA1 protein stability and localization in cells
Our proteomic, biophysical, and functional data suggest that PTIP and PA1 exist in a 1:1 stable constitutive subcomplex that functions in transcription independently from the MLL3/MLL4 complex. To determine whether these two proteins stabilize one another in cells, we examined the expression levels of PA1 in PTIP−/− B cells and PTIP levels in PA1−/− B cells. Indeed, whole-cell lysates from PA1−/− B cells revealed a reduction in the levels of PTIP protein, and, conversely, we saw reduced levels of PA1 protein in PTIP−/− B cells (Fig. 6A). These observed reductions in protein levels were confirmed to be the result of destabilized proteins, as PTIP and PA1 mRNA levels were not affected in the respective deficiencies (Supplemental Fig. 6D). Further verification and support for cross-stabilization of the PTIP and PA1 proteins were demonstrated by Western blotting for PA1 and PTIP in immortalized MEFs transduced with either FL or a construct expressing untagged PA1. Destabilized PTIP protein levels in PA1−/− MEFs were rescued to near wild-type levels upon overexpression of PA1 (Fig. 6B, cf. lanes 1, 2, and 4). In PTIP−/− MEFs, slightly reduced PA1 levels were also stabilized upon expression of FL (Fig. 6B, cf. lanes 3, 5, and 6). We conclude that PTIP and PA1 proteins stabilize each other in cells, consistent with the two proteins associating in a constitutive subcomplex.
Figure 6.
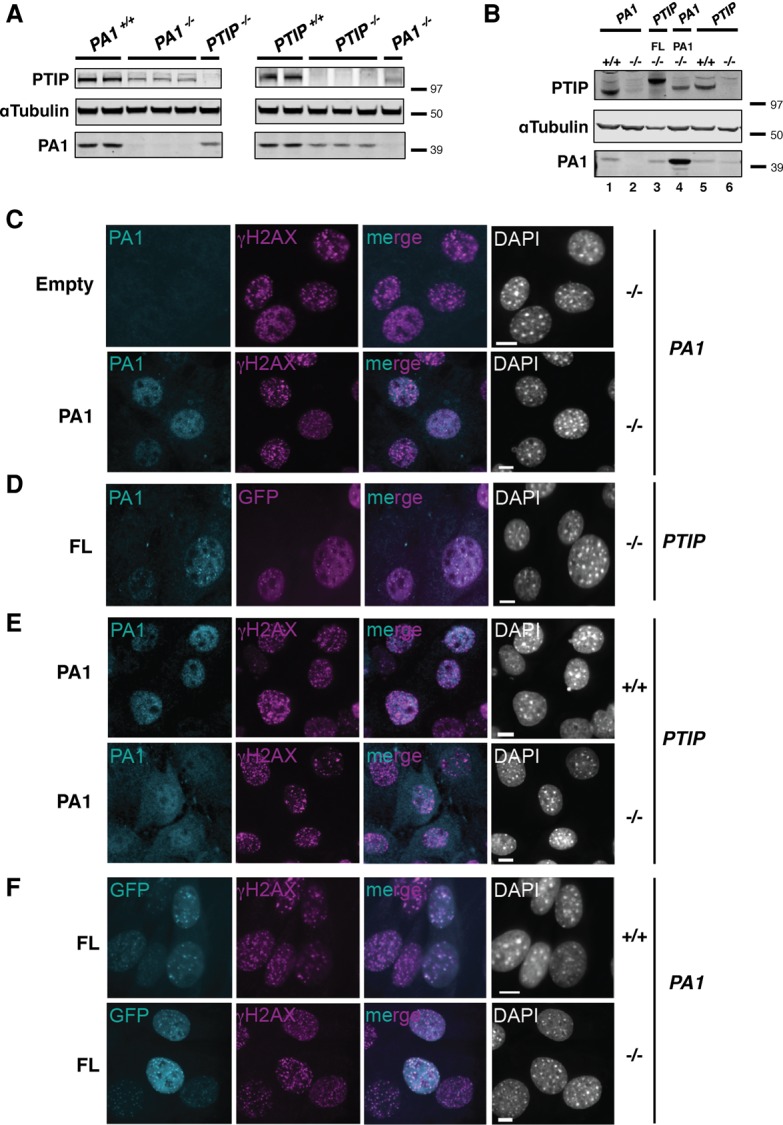
PTIP and PA1 protein stability and localization in cells. (A) A Western blot for PTIP and PA1 levels in B cells stimulated in the IgG3 condition for 3 d from individual PA1−/−, PTIP−/−, and control mice (PA1−/− and PTIP−/−, n = 3; control mice, n = 2). (B) A Western blot for PTIP and PA1 levels in immortalized PTIP−/−, PA1−/−, and control (+/+) MEFs transduced with FL and PA1. (C–F) Immunofluorescence of immortalized MEFs. (C) PA1−/− cells transduced with untagged PA1 or empty vector control. (D) PTIP−/− cells transduced with N-terminal GFP-tagged FL. (E) PTIP−/− and controls (+/+) transduced with untagged-PA1. (F) PA1−/− and controls (+/+) transduced with FL. MEFs in C–F were irradiated with 10 Gy, and FL (cyan, except for D, where FL is indicated in magenta), PA1 (cyan), and γH2AX (magenta) IR-induced foci were assessed 4 h after IR. DAPI is indicated in gray. Bars, 10 μm.
Based on these cellular protein stabilization data, we decided to overexpress stoichiometric amounts of PTIP and PA1 within PTIP−/− B cells using the 2A peptide technology (Kim et al. 2011) to determine whether we could achieve supraphysiological IgG3 class switching. PTIP−/− B cells were transduced with FL, untagged PA1, PA1.P2A.PTIP, or empty vector (Supplemental Fig. 7A). Upon assaying IgG3 surface expression, we observed that PA1 expression alone failed to rescue the IgG3 class switching defect above empty vector transduced cells and that PA1.P2A.PTIP transduced cells rescued similar to FL (Supplemental Fig. 7B); similar results were obtained for Igh-γ3 germline transcription (Supplemental Fig. 7C). P2A peptide cleavage was efficient, and the cotranslated PTIP and PA1 proteins were detected at levels similar to individually overexpressed FL and PA1 proteins (Supplemental Fig. 7D). We conclude that overexpression of the PTIP–PA1 subcomplex does not lead to elevated IgH class switching even though the proteins stabilize each other. Thus, in contrast to the elevated levels of IgH CSR observed with AID overexpression and subsequent increased DNA damage (Robbiani and Nussenzweig 2013), our results suggest that mechanisms may exist to inhibit aberrant transcription of downstream switch regions at the Igh locus. Consistent with ectopic expression of FL in PTIP+/+ cells not leading to increased levels of Igh-γ3 germline transcription or class switching compared with empty vector transduced cells (Fig. 1F; Supplemental Fig. 4C), these results together suggest that PTIP protein levels are not limiting for its function in transcription.
To further extend our functional analysis of the subcomplex, we analyzed the protein levels and localization behavior of PA1 and PTIP in immortalized MEFs using immunofluorescence microscopy. Overexpressing untagged PA1 allowed for robust and specific immunodetection of PA1 above background (Fig. 6C). Consistent with our Western blot results (Fig. 6B), we were able to visualize stabilization of endogenous PA1 in cells overexpressing FL (Fig. 6D). Both stabilized endogenous or exogenously expressed PA1 showed nuclear-restricted staining (Fig. 6C,D); however, PA1 became noticeably mislocalized to a diffuse nuclear/cytoplasmic staining in PTIP−/− MEFs (Fig. 6E). We conclude that PTIP is required for the efficient nuclear localization of PA1.
As previously reported in PA1-deficient human cells (Gong et al. 2009), we confirmed that FL formed IR-induced foci and showed nuclear localization in PA1−/− MEFs similar to controls, with the majority of foci showing clear colocalization with γH2AX (Fig. 6F). PA1 foci were observed in irradiated cells when either FL or PA1 was overexpressed (Fig. 6C–E), and the majority of these foci colocalized with FL (Fig. 6D); however, to our surprise, we found that PA1 foci do not show a clear overlap with γH2AX like we and others observed with FL foci (Fig. 6F). We conclude that PA1 is dispensable for the nuclear localization and IR-induced foci formation of PTIP and, in contrast to PTIP, does not robustly localize to sites of IR-induced DNA damage. These data therefore call into question whether PA1 is in fact a DNA damage response (DDR) factor and suggest that the reported cellular radiosensitivity of PA1-deficient human cells (Gong et al. 2009) may be indirectly due to destabilized PTIP protein levels.
Discussion
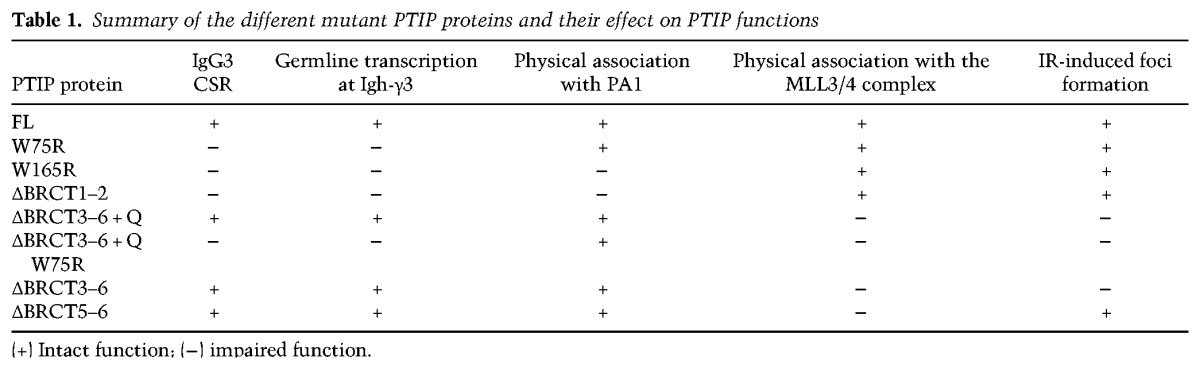
Germline transcription through the S regions of the Igh locus is essential for CSR and provides a recruitment platform to target AID to ssDNA through mechanisms that still remain to be completely elucidated (Kenter 2012; Alt et al. 2013; Robbiani and Nussenzweig 2013; Stavnezer and Schrader 2014). Here we dissected the different complexes of the multifunctional PTIP protein and found that its function in transcription for IgH class switching can be separated from both its association with the MLL3/MLL4 methyltransferase complex and its DNA damage-induced association with the DDR factor 53BP1 (Fig. 7; Table 1). Contrary to previous assumptions, we found that the transcription function of PTIP for IgH class switching is not mediated through direct association or recruitment of the MLL3/MLL4 complex but is instead mediated by one of its tandem BRCT domains that associate with the PA1 protein in a PTIP–PA1 subcomplex.
Figure 7.

Model for how the PTIP–PA1 subcomplex promotes transcription for IgH class switching independently from the associated MLL3/MLL4 complex. Prior to stimulation, Igh-μ germline transcripts are produced from the 5′ Eμ region, and a full-length Igh transcript is produced from upstream of the V(D)J gene segment. PTIP and PA1 proteins stabilize each other in a constitutive subcomplex that, upon B-cell activation, localizes to downstream Igh-γ switch regions through an unknown transcription factor interaction, where it then interacts with the transcription machinery (i.e., a chromatin-modifying complex or polymerase II [Pol II]) to promote germline transcription initiation (step 1). The Igh-γ3 switch region is shown as an example. Dashed arrows indicate a direct or indirect association. H3K4me3 marks are deposited by a Set1-like methyltransferase either before or after transcription initiation (step 2). AID is targeted to the now accessible chromatin at the switch regions, leading to DSB formation (step 3). DSBs are repaired by the NHEJ pathway and the 53BP1 and RIF1 DDR factors, leading to a recombined Igh locus and expression of IgG3 (step 4). Constant (C) region exons are indicated by blue rectangles, switch regions are indicated by pink ovals, the 5′ enhancer is indicated by an orange oval, and the black rectangle indicates the antigen recognition V(D)J gene segment. Cγ3, Cδ, and Cμ refer to immunoglobulins IgG, IgD, and IgM, respectively.
Table 1.
Summary of the different mutant PTIP proteins and their effect on PTIP functions
PTIP deficiency correlates with reduced H3K4me marks and transcription at specific genes in multiple cell types (Issaeva et al. 2007; Patel et al. 2007; Cho et al. 2009; Daniel et al. 2010). We previously found that H3K4me2 and H3K4me3, but not H3K4me1, at Igh switch region promoters were dependent on PTIP (Daniel et al. 2010). Together, these data suggested a key role for PTIP as an accessory subunit of the MLL3/MLL4 complex that recruits the methyltransferases to chromatin for establishing and/or enforcing chromatin states that are permissive for transcription. Indeed, we found that endogenously expressed PTIP associates with the MLL3/MLL4 complex in primary B cells; however, upon identifying the region of PTIP that associates with the MLL3/MLL4 complex, we found this interaction to be dispensable for transcription and IgH CSR. Consistent with this notion, we found that MLL3 and MLL4 are dispensable for Igh germline transcription across Igh-γ1 and Igh-γ3 switch regions. More recently, MLL3/MLL4 have been found to mostly catalyze H3K4me1/2 at enhancer regions (Lee et al. 2013; Herz et al. 2014; Heinz et al. 2015). Thus, our observations that PTIP and PA1 promote H3K4me3 at promoters further suggest that the PTIP–PA1 subcomplex has functions independent from the enhancer-enriched H3K4me1/2 methyltransferases. While the specific molecular mechanisms that recruit the PTIP–PA1 subcomplex to the Igh locus and bridge the subcomplex to the general transcription machinery remain to be elucidated, we propose that the PTIP–PA1 subcomplex is recruited to chromatin through a transient interaction with a DNA-binding transcription factor and thereby stabilizes recruitment of RNA polymerase II (Pol II) to initiate transcription, promoting H3K4me3 by an alternative Set1-like methyltransferase complex either before or subsequent to transcription initiation (Fig. 7). Nevertheless, the CSR defects that we and others (Ortega-Molina et al. 2015) observed with MLL3/MLL4 deficiencies in mice remain to be elucidated and may help to model the immune defects observed in human Kabuki syndrome that harbor mutations in Mll4 (Lindsley et al. 2015).
We call attention to PA1 as a novel CSR factor functioning together with PTIP in a subcomplex. PA1 was the only protein that we identified to strongly interact with the N-terminal PTIP fragment sufficiently for CSR and was found to associate with full-length PTIP more than other MLL3/MLL4 complex components; similar stoichiometry estimation results have been reported in human cells (van Nuland et al. 2013). Additional evidence to support the existence of a PTIP–PA1 subcomplex stems from size exclusion chromatographic fractionation of PTIP-associated proteins from human cells showing a high-molecular-weight pool of PTIP–PA1 cofractionating with the Set1-like complex component WDR5 and a lower-molecular-weight pool of PTIP–PA1 that does not contain WDR5 (Gong et al. 2009). Our data further bolster the notion of a functional PTIP–PA1 subcomplex by showing that the PTIP N-terminal tandem BRCT domain and full-length PA1 proteins directly and tightly interact in a complex with 1:1 stoichiometry and stabilize each other in cells. Moreover, the low nanomolar binding affinity that we observed for the PTIP–PA1 interaction is much stronger than the low micromolar binding affinities of other known tandem BRCT domain interactions with phospho-Ser-containing peptides (Leung and Glover 2011), further suggesting a phosphorylation-independent binding mechanism. Surprisingly, we found that BRCT1 and BRCT2 domains of PTIP were individually required for PTIP function in CSR even though PA1 association to PTIP was not affected by disruption of BRCT1. We speculate that BRCT1 of PTIP may help to stabilize the stoichiometry of the subcomplex, activate a function of PA1, or associate transiently with a different protein that is essential for transcription and IgH CSR. Nevertheless, our work here establishes for the first time a specific biological function for the PTIP–PA1 subcomplex. By showing that PTIP similarly regulates transcription at three different switch regions and at the Il6 cytokine gene, we speculate that the subcomplex acts at multiple genomic loci in different cellular contexts.
PTIP promotes IgH CSR to IgG isotypes but not IgE (Daniel et al. 2010; Callen et al. 2013), and we now show that PA1 functions similarly. Our data demonstrate that the N-terminal tandem BRCT domain fragment of PTIP completely rescues the transcription and CSR defects of PTIP−/− B cells independently from PTIP foci formation. This PTIP–PA1 function is in stark contrast to our understanding of how 53BP1 and RIF1 function in this recombination reaction, as their deficiencies do not lead to defects in Igh germline transcription but instead show significant Igh-associated genomic instability (Manis et al. 2004; Ward et al. 2004; Chapman et al. 2013; Di Virgilio et al. 2013; Escribano-Diaz et al. 2013). Thus, while PTIP and RIF1 both associate with the N terminus of 53BP1 in response to DSBs (Callen et al. 2013; Chapman et al. 2013; Di Virgilio et al. 2013; Escribano-Diaz et al. 2013; Zimmermann et al. 2013), PTIP does not have a major role in DSB repair during CSR but instead is critical for the Igh germline transcription step that occurs prior to AID-induced DNA damage and independently from these DDR factors.
Materials and methods
Mice
PTIPflox/flox (Daniel et al. 2010), CD19Cre (Rickert et al. 1997), CD21Cre (Kraus et al. 2004), MLL3flox/flox (Lee et al. 2006), and MLL4flox/flox (Lee et al. 2013) mice were previously described. The generation of PA1flox/flox mice will be described in the future (JE Lee and K Ge, in prep.). Mice used for experiments were between 8 and 12 wk of age. All experiments were performed in compliance with the Danish Working Environment Authority, the Danish Animal Experiment Inspectorate, and the Department of Experimental Medicine at the University of Copenhagen. Cloning of the knock-in construct for the PTIP-GFP mice was performed by Gene Bridges using the ACN vector as a backbone (Bunting et al. 1999). Embryonic stem cell electroporation and blastocyst injection were performed by the University of Copenhagen Core Facility for Transgenic Mice.
SILAC labeling and immunoprecipitations
For triple SILAC labeling of B cells from PTIPgfp mice, B cells were isolated from littermates consisting of PTIP+/+ plated in light medium (containing L-arginine [Arg-0] and L-lysine [Lys-0]), PTIPgfp/+ plated in medium medium (containing L-arginine [13C6]HCl [Arg-6] and L-lysine-4,4,5,5-d4 [Lys-4]) and PTIPgfp/gfp plated in heavy medium (containing L-arginine [13C6,15N4]HCl [Arg-10] and L-lysine [13C6,15N2]HCl [Lys-8] [Sigma]). Cells were cultured for 72 h in the IgG3 condition followed by collection and lysis as outlined below. For triple SILAC labeling of PTIP−/− B cells transduced with FL and mutant constructs, cells to be transduced were plated in their respective SILAC media overnight in the IgG3 condition. The following day, cells were transduced and plated as follows: GFP empty retrovirus was always cultured in light medium, FL or ΔBRCT3–6 + Q was cultured in medium medium and ΔBRCT1–2, the W75R point mutant, or ΔBRCT3–6 + Q W75R was cultured in heavy medium. Three days after transduction, cells in their separate conditions were collected and lysed, followed by immunoprecipitation. Cells were lysed according to the method of Mendez and Stillman (2000), referred to as method 1 in the text. Briefly, cells from each SILAC population were collected, washed with cold PBS, and lysed in hypotonic buffer A (10 mM HEPES at pH 7.9, 10 mM KCl, 1.5 mM MgCl2, 0.34M sucrose, 10% glycerol, complete protease inhibitor cocktail, PhosSTOP phosphatase inhibitor cocktail [Roche], 1 mM DTT, 0.1% Triton X-100) to isolate nuclei. Chromatin-bound proteins were released by treatment with 0.2 U of micrococcal nuclease (Sigma) and 1 mM CaCl2 in buffer A for 3 min at 37°C. The reaction was stopped by addition of 1 mM EGTA, and nuclei were collected and lysed in extraction buffer (3 mM EDTA, 0.2 mM EGTA, complete protease inhibitor cocktail, PhosSTOP phosphatase inhibitor cocktail [Roche], 1 mM DTT). One milligram of this chromatin-enriched nuclear extract was incubated for 2 h at 4°C with GFP-Trap_A beads (Chromotek) in immunoprecipitation buffer (10 mM Tris-HCl at pH 8, 150 mM NaCl, 0.5 mM EDTA, 0.2% Igepal CA-630, complete protease inhibitor cocktail, PhosSTOP phosphatase inhibitor cocktail [Roche]). The beads were washed three to four times, and then the immunoprecipitation reactions from three different SILAC samples were pooled together after the last wash for mass spectrometric analysis. Two additional lysis methods were used for triple SILAC interactomes comparing FL with ΔBRCT1–2 (Supplemental Fig. 5). Method 2 was the EBC buffer method described previously (Danielsen et al. 2012) with a micrococcal nuclease treatment to enrich for chromatin factors, and method 3 refers to the “two-step” protocol using hypotonic shock followed by salt extraction to enrich for possible transcription factors (Klenova et al. 2002).
Mass spectrometric analyses
PTIP-GFP and copurifying proteins were resolved by SDS-PAGE on 4%–12% NuPAGE Bis-Tris gels (Life Technologies) and visualized by Coomassie blue staining. Peptides were recovered from the SDS-PAGE gel using a standard in-gel digestion protocol (Lundby and Olsen 2011). Peptide fractions were analyzed by online nanoflow liquid chromatography-tandem mass spectrometry (LC-MS/MS) using a Proxeon easy nLC 1000 system connected to an Q-Exactive mass spectrometer (Thermo Scientific), as described (Kelstrup et al. 2012). Raw data were computationally processed using MaxQuant and searched against the UniProt database (January 2014 release) using the integrated Andromeda search engine (http://www.maxquant.org) (Cox and Mann 2008; Cox et al. 2011). Complete lists of all quantified proteins, their SILAC ratios, and other relevant mass spectrometry data are in Supplemental Table 1.
ChIP-seq
B cells were harvested for chromatin preparation 2 d after stimulation, and ChIP-seq and Illumina sequencing were performed as previously described (Daniel et al. 2010). All sequence data have been deposited in the Gene Expression Omnibus database (accession no. GSE75930) at http://ncbi.nlm.nih.gov/geo.
Quantitative real-time PCR
mCherry-positive and mCherry-negative sorted B cells were collected, and total RNA was extracted using TRIzol reagent (Invitrogen); treated with DNA-free RNase-free DNase (Ambion) or, in cases with low cell numbers, using the Arcturus PicoPure RNA isolation kit (Life Technologies); and reverse-transcribed using random hexamers from SuperScript III first strand synthesis SuperMix (Invitrogen), all according to the manufacturer's instructions. Quantitative PCR was performed in 20-μL reactions on cDNA using 100 nM each primer, SYBR Green PCR Master mix (Applied Biosystems), and a Stratagene Mx3005P (Agilent Technologies) machine. See the Supplemental Material for quantitative PCR conditions and a list of the primers used.
Supplementary Material
Acknowledgments
We thank Jutta Bulkescher for technical assistance with imaging; Gelo Dela Cruz (DanStem) for FACS sorting; Davide Robbiani for helpful advice and constructs regarding cloning of the PTIP-GFP knock-in vector; Jae W. Lee for the MLL3flox/flox mice; Gustavo Gutierrez-Cruz for technical assistance with ChIP-seq; Tobias Gustavsson, Khalid Pardes, and Mia Nielsen for recombinant protein expression and purification; and Javier Gonzalez (University of Copenhagen Core Facility for Transgenic Mice) for technical assistance with electroporation of embryonic stem cells and blastocyst injections. We also thank Jiri Lukas, Andres Lopez-Contreras, and Valentyn Oksenych for critical reading of the manuscript. This work was supported by the Danish Council for Independent Research in Medical Sciences with a Sapere Aude Starting Grant to J.A.D. and a post-doctoral Fellowship to L.M.S. The Daniel laboratory was also supported by the Danish Cancer Society and a grant to the Center for Protein Research from the Novo Nordisk Foundation (NNF14CC0001). The work in the Choudhary laboratory was supported by the Danish Council for Independent Research in Medical Sciences with a Sapere Aude Starting Grant. The work in the Peng laboratory was supported by the National Institute of Allergy and Infectious Diseases of the National Institutes of Health (award R21AI113806). L.M.P. is supported by an International Masters Scholarship from the Lundbeck Foundation. A.M. is supported by a Marie Curie Intra-European Fellowship for Career Development (project no. 627187).
Footnotes
Supplemental material is available for this article.
Article published online ahead of print. Article and publication date are online at http://www.genesdev.org/cgi/doi/10.1101/gad.268797.115.
References
- Alt FW, Zhang Y, Meng FL, Guo C, Schwer B. 2013. Mechanisms of programmed DNA lesions and genomic instability in the immune system. Cell 152: 417–429. [DOI] [PMC free article] [PubMed] [Google Scholar]
- Bunting M, Bernstein KE, Greer JM, Capecchi MR, Thomas KR. 1999. Targeting genes for self-excision in the germ line. Genes Dev 13: 1524–1528. [DOI] [PMC free article] [PubMed] [Google Scholar]
- Callen E, Di Virgilio M, Kruhlak MJ, Nieto-Soler M, Wong N, Chen HT, Faryabi RB, Polato F, Santos M, Starnes LM, et al. 2013. 53BP1 mediates productive and mutagenic DNA repair through distinct phosphoprotein interactions. Cell 153: 1266–1280. [DOI] [PMC free article] [PubMed] [Google Scholar]
- Chapman JR, Barral P, Vannier JB, Borel V, Steger M, Tomas-Loba A, Sartori AA, Adams IR, Batista FD, Boulton SJ. 2013. RIF1 is essential for 53BP1-dependent nonhomologous end joining and suppression of DNA double-strand break resection. Mol Cell 49: 858–871. [DOI] [PMC free article] [PubMed] [Google Scholar]
- Chaudhuri J, Tian M, Khuong C, Chua K, Pinaud E, Alt FW. 2003. Transcription-targeted DNA deamination by the AID antibody diversification enzyme. Nature 422: 726–730. [DOI] [PubMed] [Google Scholar]
- Cho YW, Hong T, Hong S, Guo H, Yu H, Kim D, Guszczynski T, Dressler GR, Copeland TD, Kalkum M, et al. 2007. PTIP associates with MLL3- and MLL4-containing histone H3 lysine 4 methyltransferase complex. J Biol Chem 282: 20395–20406. [DOI] [PMC free article] [PubMed] [Google Scholar]
- Cho YW, Hong S, Jin Q, Wang L, Lee JE, Gavrilova O, Ge K. 2009. Histone methylation regulator PTIP is required for PPARγ and C/EBPα expression and adipogenesis. Cell Metab 10: 27–39. [DOI] [PMC free article] [PubMed] [Google Scholar]
- Cox J, Mann M. 2008. MaxQuant enables high peptide identification rates, individualized p.p.b.-range mass accuracies and proteome-wide protein quantification. Nat Biotechnol 26: 1367–1372. [DOI] [PubMed] [Google Scholar]
- Cox J, Neuhauser N, Michalski A, Scheltema RA, Olsen JV, Mann M. 2011. Andromeda: a peptide search engine integrated into the MaxQuant environment. J Proteome Res 10: 1794–1805. [DOI] [PubMed] [Google Scholar]
- Daniel JA, Nussenzweig A. 2012. Roles for histone H3K4 methyltransferase activities during immunoglobulin class-switch recombination. Biochim Biophys Acta 1819: 733–738. [DOI] [PMC free article] [PubMed] [Google Scholar]
- Daniel JA, Nussenzweig A. 2013. The AID-induced DNA damage response in chromatin. Mol Cell 50: 309–321. [DOI] [PMC free article] [PubMed] [Google Scholar]
- Daniel JA, Santos MA, Wang Z, Zang C, Schwab KR, Jankovic M, Filsuf D, Chen HT, Gazumyan A, Yamane A, et al. 2010. PTIP promotes chromatin changes critical for immunoglobulin class switch recombination. Science 329: 917–923. [DOI] [PMC free article] [PubMed] [Google Scholar]
- Danielsen JR, Povlsen LK, Villumsen BH, Streicher W, Nilsson J, Wikstrom M, Bekker-Jensen S, Mailand N. 2012. DNA damage-inducible SUMOylation of HERC2 promotes RNF8 binding via a novel SUMO-binding zinc finger. J Cell Biol 197: 179–187. [DOI] [PMC free article] [PubMed] [Google Scholar]
- Di Virgilio M, Callen E, Yamane A, Zhang W, Jankovic M, Gitlin AD, Feldhahn N, Resch W, Oliveira TY, Chait BT, et al. 2013. Rif1 prevents resection of DNA breaks and promotes immunoglobulin class switching. Science 339: 711–715. [DOI] [PMC free article] [PubMed] [Google Scholar]
- Dulic A, Bates PA, Zhang X, Martin SR, Freemont PS, Lindahl T, Barnes DE. 2001. BRCT domain interactions in the heterodimeric DNA repair protein XRCC1–DNA ligase III. Biochemistry 40: 5906–5913. [DOI] [PubMed] [Google Scholar]
- Escribano-Diaz C, Orthwein A, Fradet-Turcotte A, Xing M, Young JT, Tkac J, Cook MA, Rosebrock AP, Munro M, Canny MD, et al. 2013. A cell cycle-dependent regulatory circuit composed of 53BP1-RIF1 and BRCA1-CtIP controls DNA repair pathway choice. Mol Cell 49: 872–883. [DOI] [PubMed] [Google Scholar]
- Gong Z, Cho YW, Kim JE, Ge K, Chen J. 2009. Accumulation of Pax2 transactivation domain interaction protein (PTIP) at sites of DNA breaks via RNF8-dependent pathway is required for cell survival after DNA damage. J Biol Chem 284: 7284–7293. [DOI] [PMC free article] [PubMed] [Google Scholar]
- Heinz S, Romanoski CE, Benner C, Glass CK. 2015. The selection and function of cell type-specific enhancers. Nat Rev Mol Cell Biol 16: 144–154. [DOI] [PMC free article] [PubMed] [Google Scholar]
- Herz HM, Hu D, Shilatifard A. 2014. Enhancer malfunction in cancer. Mol Cell 53: 859–866. [DOI] [PMC free article] [PubMed] [Google Scholar]
- Issaeva I, Zonis Y, Rozovskaia T, Orlovsky K, Croce CM, Nakamura T, Mazo A, Eisenbach L, Canaani E. 2007. Knockdown of ALR (MLL2) reveals ALR target genes and leads to alterations in cell adhesion and growth. Mol Cell Biol 27: 1889–1903. [DOI] [PMC free article] [PubMed] [Google Scholar]
- Kelstrup CD, Young C, Lavallee R, Nielsen ML, Olsen JV. 2012. Optimized fast and sensitive acquisition methods for shotgun proteomics on a quadrupole orbitrap mass spectrometer. J Proteome Res 11: 3487–3497. [DOI] [PubMed] [Google Scholar]
- Kenter AL. 2012. AID targeting is dependent on RNA polymerase II pausing. Semin Immunol 24: 281–286. [DOI] [PMC free article] [PubMed] [Google Scholar]
- Kim D, Patel SR, Xiao H, Dressler GR. 2009. The role of PTIP in maintaining embryonic stem cell pluripotency. Stem Cells 27: 1516–1523. [DOI] [PMC free article] [PubMed] [Google Scholar]
- Kim JH, Lee SR, Li LH, Park HJ, Park JH, Lee KY, Kim MK, Shin BA, Choi SY. 2011. High cleavage efficiency of a 2A peptide derived from porcine teschovirus-1 in human cell lines, zebrafish and mice. PLoS One 6: e18556. [DOI] [PMC free article] [PubMed] [Google Scholar]
- Klenova E, Chernukhin I, Inoue T, Shamsuddin S, Norton J. 2002. Immunoprecipitation techniques for the analysis of transcription factor complexes. Methods 26: 254–259. [DOI] [PubMed] [Google Scholar]
- Kraus M, Alimzhanov MB, Rajewsky N, Rajewsky K. 2004. Survival of resting mature B lymphocytes depends on BCR signaling via the Igα/β heterodimer. Cell 117: 787–800. [DOI] [PubMed] [Google Scholar]
- Kumar A, Lualdi M, Loncarek J, Cho YW, Lee JE, Ge K, Kuehn MR. 2014. Loss of function of mouse Pax-interacting protein 1-associated glutamate rich protein 1a (Pagr1a) leads to reduced Bmp2 expression and defects in chorion and amnion development. Dev Dyn 243: 937–947. [DOI] [PMC free article] [PubMed] [Google Scholar]
- Lee S, Lee DK, Dou Y, Lee J, Lee B, Kwak E, Kong YY, Lee SK, Roeder RG, Lee JW. 2006. Coactivator as a target gene specificity determinant for histone H3 lysine 4 methyltransferases. Proc Natl Acad Sci 103: 15392–15397. [DOI] [PMC free article] [PubMed] [Google Scholar]
- Lee JE, Wang C, Xu S, Cho YW, Wang L, Feng X, Baldridge A, Sartorelli V, Zhuang L, Peng W, et al. 2013. H3K4 mono- and di-methyltransferase MLL4 is required for enhancer activation during cell differentiation. Elife 2: e01503. [DOI] [PMC free article] [PubMed] [Google Scholar]
- Leung CC, Glover JN. 2011. BRCT domains: easy as one, two, three. Cell Cycle 10: 2461–2470. [DOI] [PMC free article] [PubMed] [Google Scholar]
- Lindsley AW, Saal HM, Burrow TA, Hopkin RJ, Shchelochkov O, Khandelwal P, Xie C, Bleesing J, Filipovich L, Risma K, et al. 2015. Defects of B-cell terminal differentiation in patients with type-1 Kabuki syndrome. J Allergy Clin Immunol. 10.1016/j.jaci.2015.06.002. [DOI] [PMC free article] [PubMed] [Google Scholar]
- Lundby A, Olsen JV. 2011. GeLCMS for in-depth protein characterization and advanced analysis of proteomes. Methods Mol Biol 753: 143–155. [DOI] [PubMed] [Google Scholar]
- Manis JP, Morales JC, Xia Z, Kutok JL, Alt FW, Carpenter PB. 2004. 53BP1 links DNA damage-response pathways to immunoglobulin heavy chain class-switch recombination. Nat Immunol 5: 481–487. [DOI] [PubMed] [Google Scholar]
- Manke IA, Lowery DM, Nguyen A, Yaffe MB. 2003. BRCT repeats as phosphopeptide-binding modules involved in protein targeting. Science 302: 636–639. [DOI] [PubMed] [Google Scholar]
- Mendez J, Stillman B. 2000. Chromatin association of human origin recognition complex, cdc6, and minichromosome maintenance proteins during the cell cycle: assembly of prereplication complexes in late mitosis. Mol Cell Biol 20: 8602–8612. [DOI] [PMC free article] [PubMed] [Google Scholar]
- Munoz IM, Jowsey PA, Toth R, Rouse J. 2007. Phospho-epitope binding by the BRCT domains of hPTIP controls multiple aspects of the cellular response to DNA damage. Nucleic Acids Res 35: 5312–5322. [DOI] [PMC free article] [PubMed] [Google Scholar]
- Ortega-Molina A, Boss IW, Canela A, Pan H, Jiang Y, Zhao C, Jiang M, Hu D, Agirre X, Niesvizky I, et al. 2015. The histone lysine methyltransferase KMT2D sustains a gene expression program that represses B cell lymphoma development. Nat Med 21: 1199–1208. [DOI] [PMC free article] [PubMed] [Google Scholar]
- Patel SR, Kim D, Levitan I, Dressler GR. 2007. The BRCT-domain containing protein PTIP links PAX2 to a histone H3, lysine 4 methyltransferase complex. Dev Cell 13: 580–592. [DOI] [PMC free article] [PubMed] [Google Scholar]
- Ramiro AR, Stavropoulos P, Jankovic M, Nussenzweig MC. 2003. Transcription enhances AID-mediated cytidine deamination by exposing single-stranded DNA on the nontemplate strand. Nat Immunol 4: 452–456. [DOI] [PubMed] [Google Scholar]
- Rao RC, Dou Y. 2015. Hijacked in cancer: the KMT2 (MLL) family of methyltransferases. Nat Rev Cancer 15: 334–346. [DOI] [PMC free article] [PubMed] [Google Scholar]
- Rickert RC, Roes J, Rajewsky K. 1997. B lymphocyte-specific, Cre-mediated mutagenesis in mice. Nucleic Acids Res 25: 1317–1318. [DOI] [PMC free article] [PubMed] [Google Scholar]
- Robbiani DF, Nussenzweig MC. 2013. Chromosome translocation, B cell lymphoma, and activation-induced cytidine deaminase. Annu Rev Pathol 8: 79–103. [DOI] [PubMed] [Google Scholar]
- Schwab KR, Patel SR, Dressler GR. 2011. Role of PTIP in class switch recombination and long-range chromatin interactions at the immunoglobulin heavy chain locus. Mol Cell Biol 31: 1503–1511. [DOI] [PMC free article] [PubMed] [Google Scholar]
- Schwanhausser B, Busse D, Li N, Dittmar G, Schuchhardt J, Wolf J, Chen W, Selbach M. 2011. Global quantification of mammalian gene expression control. Nature 473: 337–342. [DOI] [PubMed] [Google Scholar]
- Stavnezer J, Schrader CE. 2014. IgH chain class switch recombination: mechanism and regulation. J Immunol 193: 5370–5378. [DOI] [PMC free article] [PubMed] [Google Scholar]
- van Nuland R, Smits AH, Pallaki P, Jansen PW, Vermeulen M, Timmers HT. 2013. Quantitative dissection and stoichiometry determination of the human SET1/MLL histone methyltransferase complexes. Mol Cell Biol 33: 2067–2077. [DOI] [PMC free article] [PubMed] [Google Scholar]
- Wang J, Aroumougame A, Lobrich M, Li Y, Chen D, Chen J, Gong Z. 2014. PTIP associates with Artemis to dictate DNA repair pathway choice. Genes Dev 28: 2693–2698. [DOI] [PMC free article] [PubMed] [Google Scholar]
- Ward IM, Reina-San-Martin B, Olaru A, Minn K, Tamada K, Lau JS, Cascalho M, Chen L, Nussenzweig A, Livak F, et al. 2004. 53BP1 is required for class switch recombination. J Cell Biol 165: 459–464. [DOI] [PMC free article] [PubMed] [Google Scholar]
- Wu J, Prindle MJ, Dressler GR, Yu X. 2009. PTIP regulates 53BP1 and SMC1 at the DNA damage sites. J Biol Chem 284: 18078–18084. [DOI] [PMC free article] [PubMed] [Google Scholar]
- Yu K, Chedin F, Hsieh CL, Wilson TE, Lieber MR. 2003a. R-loops at immunoglobulin class switch regions in the chromosomes of stimulated B cells. Nat Immunol 4: 442–451. [DOI] [PubMed] [Google Scholar]
- Yu X, Chini CC, He M, Mer G, Chen J. 2003b. The BRCT domain is a phospho-protein binding domain. Science 302: 639–642. [DOI] [PubMed] [Google Scholar]
- Zimmermann M, Lottersberger F, Buonomo SB, Sfeir A, de Lange T. 2013. 53BP1 regulates DSB repair using Rif1 to control 5′ end resection. Science 339: 700–704. [DOI] [PMC free article] [PubMed] [Google Scholar]
Associated Data
This section collects any data citations, data availability statements, or supplementary materials included in this article.