

Takano et al. describe novel roles for both isoforms of paired-related homeodomain transcription factor 1 (Prrx1) in the metastatic cascade using complementary in vitro and in vivo models. Prrx1b promotes invasion, tumor dedifferentiation, and EMT. In contrast, Prrx1a stimulates metastatic outgrowth in the liver, tumor differentiation, and MET.
Keywords: Prrx1a, Prrx1b, pancreatic cancer, metastasis, EMT, MET
Abstract
The two major isoforms of the paired-related homeodomain transcription factor 1 (Prrx1), Prrx1a and Prrx1b, are involved in pancreatic development, pancreatitis, and carcinogenesis, although the biological role that these isoforms serve in the systemic dissemination of pancreatic ductal adenocarcinoma (PDAC) has not been investigated. An epithelial–mesenchymal transition (EMT) is believed to be important for primary tumor progression and dissemination, whereas a mesenchymal–epithelial transition (MET) appears crucial for metastatic colonization. Here, we describe novel roles for both isoforms in the metastatic cascade using complementary in vitro and in vivo models. Prrx1b promotes invasion, tumor dedifferentiation, and EMT. In contrast, Prrx1a stimulates metastatic outgrowth in the liver, tumor differentiation, and MET. We further demonstrate that the switch from Prrx1b to Prrx1a governs EMT plasticity in both mouse models of PDAC and human PDAC. Last, we identify hepatocyte growth factor ( HGF) as a novel transcriptional target of Prrx1b. Targeted therapy of HGF in combination with gemcitabine in a preclinical model of PDAC reduces primary tumor volume and eliminates metastatic disease. Overall, we provide new insights into the isoform-specific roles of Prrx1a and Prrx1b in primary PDAC formation, dissemination, and metastatic colonization, allowing for novel therapeutic strategies targeting EMT plasticity.
Pancreatic ductal adenocarcinoma (PDAC) remains one of the most deadly malignancies and is estimated to become the second leading cause of cancer-related deaths by 2020 (Cardin and Berlin 2013; Ma et al. 2013). The reasons for this poor outcome are multifactorial and include late detection and resistance to therapeutic modalities (Hezel et al. 2006). Even patients who have undergone surgical resection frequently present with recurrent systemic disease, and >80% will succumb within 5 years (Bilimoria et al. 2007). This can be attributed in part to the recent finding that hematogenous dissemination appears to be an early event in PDAC progression (Rhim et al. 2012). In particular, genetic lineage labeling revealed that select cells within histological “preinvasive” pancreatic intraepithelial neoplasias (PanINs) undergo an epithelial–mesenchymal transition (EMT) within the pancreas, enter the bloodstream, and seed the liver in Pdx1-cre;LSL-KrasG12D/+;p53fl/+;R26YFP (KPflCY) mice.
EMT is critical in organ development, wound healing, tissue fibrosis, and cancer progression. In the context of cancer progression, EMT is associated with tumor invasion and dissemination and is an apparent prerequisite for metastatic colonization. During EMT, epithelial cells lose polarity and E-cadherin-mediated adhesion at the adherens junctions. Subsequent to these morphological and biochemical changes, cells acquire the motile and invasive phenotype characteristic of mesenchymal cells. These cells express the mesenchymal markers vimentin, fibronectin, N-cadherin, twist, and snail, among others (Thiery et al. 2009). Similar to embryonic development, where EMT is plastic, a subset of tumor cells can revert to an epithelial phenotype (a mesenchymal–epithelial transition [MET]), which is theorized to be required for seeding of distant organs and initiation of metastatic growth (Brabletz 2012; Ocaña et al. 2012; Tsai et al. 2012). However, the molecular mechanisms by which EMT and MET occur during cancer progression are still unclear. Of note, MET has been described in organ development and inducible pluripotent stem cell reprogramming (Li et al. 2010). Understanding the underlying mechanisms of EMT and MET is crucial to developing novel therapeutic approaches to target the metastatic cascade, as metastasis is a common cause of death in PDAC and other cancers. However, the molecular mechanisms that govern the overarching framework of EMT plasticity have yet to be elucidated.
We undertook a comprehensive and unbiased approach to identify key transcription factors that act as molecular drivers of pancreatic development, regeneration, and carcinogenesis, all of which are biological processes that require a high degree of cellular plasticity and involve EMT (Reichert et al. 2013a). To that end, the most up-regulated transcription factor during ductal development, induction of acinar–ductal metaplasia (ADM), and evolution of PanINs is the protein paired-related homeobox transcription factor 1 (Prrx1) (Reichert et al. 2013a). Originating from the mesoderm, Prrx1 is critical in cell fate decisions. Alternative splicing of Prrx1 results in two predominant isoforms, Prrx1a and Prrx1b, which differ at their C terminus. Prrx1a harbors an OAR (otp, aristaless, and rax) domain, in contrast to Prrx1b (Norris and Kern 2001). Both Prrx1 variants are identical from the N terminus to amino acid 199, including the homeobox domain. We found that Prrx1b annotates a subset of pancreatic ductal cells in Prrx1creER-IRES-GFP mice and that Prrx1+GFP+ cells have the capacity to self-renew and expand during chronic pancreatitis (Reichert et al. 2013a). Furthermore, Prrx1a regulates pancreatic cell migration, and Prrx1b regulates pancreatic cell invasion at the PanIN stage (Reichert et al. 2013a). Interestingly, repression of Prrx1 has been observed to be associated with metastatic colonization of colon cancer cells (Ocaña et al. 2012). However, the distinct roles of the Prrx1 isoforms were not investigated in this context.
Here we define novel functional roles for Prrx1a and Prrx1b in the regulation of EMT and MET during pancreatic carcinogenesis in mouse and human PDAC. Prrx1b promotes EMT, tumor invasion, and tumor dedifferentiation, whereas Prrx1a promotes the metastatic outgrowth of large liver lesions along with MET and tumor differentiation. The regulation of epithelial and mesenchymal states through Prrx1 isoform switching is mediated in part by up-regulation of hepatocyte growth factor (Hgf) by Prrx1b. Targeting HGF with a neutralizing antibody in concert with gemcitabine reduces PDAC burden compared with gemcitabine treatment alone in preclinical studies. Taken together, Prrx1a and Prrx1b regulation provides a new hierarchical axis in which to view governance of EMT and MET in primary and metastatic pancreatic cancer and provides a new platform for translational therapeutics.
Results
Prrx1a and Prrx1b differentially regulate MET and EMT
To study the role of Prrx1 isoforms (Supplemental Fig. S1A) in EMT, we used a previously established three-dimensional (3D) organotypic culture system (Wescott et al. 2009; Reichert et al. 2013a,b). Nontransformed primary mouse pancreatic ductal cells (wild-type PDCs) form organized spheroid cysts in this in vitro system. Pancreatic cells isolated from Pdx1-cre;LSL-KrasG12D/+ (line 4313, referred to as KC throughout) or Pdx1-cre;LSL-KrasG12D/+;p53R172H/+ mice (lines 4964 and 5143, referred to as KPC1 and KPC2, respectively, throughout) display an increasing lack of organization and appear spindle-shaped, suggesting a shift toward a mesenchymal phenotype. In contrast, liver metastatic cancer cells derived from the KPC1 and KPC2 tumors (termed KPC1Liv and KPC2Liv2) form well-organized spheroid cysts (Supplemental Fig. S1B–D). In addition to investigating the expression of Cdh1 (E-cadherin) and EMT-related genes (Supplemental Fig. S1E), we found that the balance between Prrx1a and Prrx1b shifts toward higher Prrx1a expression in metastatic cells, in contrast to higher Prrx1b expression in primary tumor cells (Supplemental Fig. S1F,G). Metastatic cells compared with paired primary tumor cells therefore show an increase in Prrx1a/Prrx1b ratios as well as a relative increase in spheroid cyst formation ability and epithelial characteristics.
When generating isoform-specific overexpressing KPC2 cell lines by transduction with control, Prrx1a (KPC2-Prrx1a), or Prrx1b (KPC2-Prrx1b) lentiviral constructs (Supplemental Fig. S1H), KPC2-Prrx1a cells form significantly more symmetric cystic structures compared with KPC2 control and KPC2-Prrx1b cells (Fig. 1A). This change in morphology in the KPC2-Prrx1a cells is accompanied by increased Cdh1 levels, whereas there are diminished Cdh1 levels in KPC2-Prrx1b cells (Fig. 1B). Consistent with this, using isoform-specific siRNAs (Supplemental Fig. S1H), Prrx1a knockdown resulted in decreased E-CADHERIN expression in KPC2Liv2 cells, whereas Prrx1b knockdown resulted in increased E-CADHERIN in the same cells (Supplemental Fig. S1I) and their parental KPC2 line (Fig. 1C). We next analyzed the invasive capacity of isoform-specific overexpressing KPC1 and KPC2 cells in a modified Boyden chamber assay. Functionally, Prrx1b promotes more invasion compared with control cells, and, interestingly, Prrx1a reduces invasion (KPC1, P < 0.005; KPC2, P < 0.0005) (Fig. 1D). Using isoform-specific siRNAs, the inverse relationship of Prrx1a and Prrx1b with invasion was corroborated in KPC1 cells (P < 0.005) (Fig. 1E).
Figure 1.

Prrx1a fosters MET, and Prrx1b promotes EMT in pancreatic cancer cells. (A) Morphological changes in KPC2 control, Prrx1a-overexpressing, and Prrx1b-overexpressing cancer cells and percentage of spheroid cyst formation in 3D culture. (*) P < 0.05. (B) Relative Cdh1 (E-cadherin) gene expression in KPC2 control, Prrx1a-overexpressing, and Prrx1b-overexpressing cells cultured in 3D. (*) P < 0.05. (C) E-CADHERIN (ECAD) protein expression by Western blot in KPC2 cells treated with Prrx1 isoform-specific siRNAs. Experiments were performed in triplicate, and band intensities were normalized by densitometry to β-ACTIN. (D,E) Invasion assay of control, Prrx1a-overexpressing, and Prrx1b-overexpressing KPC1 and KPC2 cells (D) and KPC1 cells treated with sicontrol, siPrrx1a, and siPrrx1b (E). (*) P < 0.05; (**) P < 0.005; (***) P < 0.0005. (F,G) Single-cell pancreatosphere formation assay with KPC1-overexpressing and KPC2-overexpressing cells (F) and knockdown KPC1 cells (G). (*) P < 0.05; (**) P < 0.005. (H) Soft agar colony formation assay with KPC1-overexpressing and KPC2-overexpressing cells. (*) P < 0.001. Values are shown as mean ± SEM. Bar, 100 μm.
In order for cancer cells to colonize at a distant organ after extravasation, cells may require self-renewal properties. We performed single-cell sphere formation assays (Pastrana et al. 2011), which showed that metastatic cells (KPC1Liv and KPC2Liv2) have a greater ability to form spheres compared with the matched primary tumor cells (KPC1 and KPC2) (Supplemental Fig. S1J). This pattern was also true in soft agar assays. In both assays, Prrx1a promotes an increased capacity for self-renewal and anchorage independent growth, whereas Prrx1b does not foster these characteristics to the same extent in overexpression (Fig. 1F,H) and knockdown (Fig. 1G; Supplemental Fig. S1K) experiments. Taken together, these data suggest that Prrx1a fosters an epithelial phenotype and decreases invasiveness but enhances self-renewal. Conversely, Prrx1b promotes EMT and invasion. The equilibrium between these two Prrx1 isoforms may therefore regulate EMT–MET plasticity (Supplemental Fig. S1L).
PRRX1 isoforms are expressed differentially in mPDAC and metastasis
To assess further the role of Prrx1 isoform switching in cancer progression in vivo, we used a well-established genetically engineered mouse model of pancreatic cancer; namely, the KPflCY mouse (Rhim et al. 2012). The presence of the YFP lineage label allows us to track cancer cells as they undergo EMT and give rise to metastasis, albeit with the understanding that kinetics of metastasis differ between pancreatic cancer models depending on the presence of a p53fl/+ or p53R172H/+ (Morton et al. 2010; Muller and Vousden 2013). Endogenous PRRX1A and PRRX1B expression was assessed in mouse PDAC (mPDAC) and liver metastases from KPflCY animals by immunohistochemistry (IHC) using custom isoform-specific antibodies that were validated using peptide-blocking studies (Supplemental Fig. S2A,B). Interestingly, we found that while both isoforms and E-CADHERIN are expressed in reactive ducts (Fig. 2A) and well-differentiated mPDAC (Fig. 2B), PRRX1B is the predominant isoform detected in poorly differentiated tumors (Fig. 2C). We focused next on PRRX1A and PRRX1B expression in single cancer cells that have delaminated from the primary tumor (delaminated tumor cells). Interestingly, the percentage of delaminated tumor cells (YFP+) coexpressing PRRX1B with N-CADHERIN is significantly higher compared with PRRX1A, underscoring the observation that PRRX1B is associated with EMT (Supplemental Fig. S2C,D).
Figure 2.

Differential expression of PRRX1A and PRRX1B in primary and metastatic pancreatic cancer. (A) Reactive ducts in primary mPDAC (referred to as KPflCY tumors). (First panel) Hematoxylin and eosin (H&E) staining. The boxed area is magnified in the right panel. (Second panel) IHC staining for PRRX1A and PRRX1B in serial sections is shown. PRRX1A is expressed in the cytoplasm (white arrowheads) and nucleus (black arrowheads). PRRX1B expression is restricted to the nucleus (black arrowheads). (Third and fourth panels) Immunofluorescence (IF) staining for PRRX1A/B (red), E-CADHERIN (ECAD) (white), YFP (green), and DAPI (blue). Boxed regions highlight regions where PRRX1A is coexpressed with E-cadherin. PRRX1B-expressing cells in reactive ducts are devoid of E-cadherin (white arrowheads). (B) IHC staining for PRRX1A and PRRX1B in differentiated tumor areas. (C) IHC staining for PRRX1A and PRRX1B in poorly differentiated regions. (D, first panel) H&E staining of a representative small liver metastasis in a KPflCY mouse. (Second and third panels) IHC staining for PRRX1A and PRRX1B and IF staining for PRRX1A, PRRX1B, E-CADHERIN, YFP, and DAPI in the serial sections of small liver metastases. Arrowheads indicate PRRX1A+ or PRRX1B+ cells (black or white). (E, first panel) H&E staining of a representative large liver metastasis. (Second panel) IHC for PRRX1A and PRRX1B. Positive cells are indicated by black arrowheads. (Third panel) IF staining for PRRX1A, PRRX1B, E-CADHERIN, YFP, and DAPI. PRRX1A and PRRX1B expression in large liver metastases. (F) Percentage of PRRX1A- or PRRX1B-positive cells in small or large liver metastatic foci. PRRX1A- or PRRX1B-positive cells were counted manually. Small and large metastatic foci were selected in a blinded fashion and photographed. Small, n = 6; large, n = 10. Total number of cancer cells per focus or field: PRRX1A (small, 21.5 ± 3.4 cells per foci; large, 99.9 ± 13.3 cells per field) and PRRX1B (small, 20.5 ± 3.3 cells per foci; large, 100.0 ± 7.6 cells per field; mean ± SEM). (*) P < 0.0001, Welch's t-test. Bar, 50 μm.
In addition, we analyzed the distribution of PRRX1A and PRRX1B in small (<100 cells) or large (>100 cells) liver metastases. Intriguingly, although PRRX1B is expressed highly in small metastases (Fig. 2D), it is absent in large metastases (Fig. 2E,F). In contrast, PRRX1A expression is increased in large metastases compared with small metastases (Fig. 2D–F). In line with our in vitro results, these data indicate that Prrx1a is associated with MET and metastatic colonization, whereas Prrx1b drives an EMT phenotype in poorly differentiated PDAC.
Prrx1a and Prrx1b direct tumor differentiation and hematogenous dissemination in mPDAC
We next sought to confirm the differential effects of Prrx1 isoforms on cancer cells in vivo. We performed orthotopic transplantation experiments using lineage-labeled (YFP+) cancer cell lines (Fig. 3A) derived from tumor-bearing KPflCY mice (Supplemental Fig. S3A). KPflCY cells overexpressing control, tet-on-Prrx1a, or tet-on-Prrx1b (KPflCY control/KPflCY-Prrx1a/KPflCY-Prrx1b) (Supplemental Fig. S3B) were orthotopically injected, and tumor differentiation status was analyzed 15 d after transplantation. Strikingly, KPflCY-Prrx1a tumors are well differentiated and circumscribed. In addition, KPflCY-Prrx1a tumors display abundant E-CADHERIN expression (Fig. 3B). Conversely, KPflCY-Prrx1b tumors are poorly differentiated and invade into the surrounding pancreatic parenchyma accompanied by E-CADHERIN loss at the invasive front (Fig. 3B; Supplemental Fig. S3C). Next, we analyzed tumor volume in the KPflCY control/KPflCY-Prrx1a/KPflCY-Prrx1b cohorts. Both KPflCY-Prrx1a and KPflCY-Prrx1b cells establish significantly larger tumors than KPflCY control cells. Interestingly, KPflCY-Prrx1a tumors exceed the volume of KPflCY-Prrx1b tumors (Fig. 3C). To determine whether the larger tumor volume is due to increased cancer cell proliferation, we performed immunofluorescence (IF) staining for Ki-67 and YFP (Fig. 3D). Consistent with the differences in tumor volume, Ki-67+/YFP+ cells are significantly more abundant in KPflCY-Prrx1a tumors compared with KPflCY control and KPflCY-Prrx1b tumors. However, there is no difference in the number of Ki-67+/YFP+ cells between KPflCY control and KPflCY-Prrx1b tumors, which indicates that Prrx1b might contribute to tumor growth independent of proliferation.
Figure 3.

Differential roles of PRRX1A and PRRX1B in tumor differentiation of primary pancreatic cancer. (A) Experimental design for orthotopic transplantation of KPflCY control and Prrx1a-overexpressing and Prrx1b-overexpressing cells. (B, top panels) Representative primary tumor histology in experimental groups by H&E staining. Boxed regions are magnified in the bottom panels. (Second and third panels) IHC staining for PRRX1A and PRRX1B. (Bottom panels) Quadruple IF costaining of PRRX1A/B (red), E-CADHERIN (ECAD) (white), YFP (green), and DAPI (blue) in Prrx1a and Prrx1b tumors. White arrowheads indicate cancer cells devoid of E-cadherin at the invasive front of the Prrx1b tumor. (C) Primary tumor volume in three tumor groups. n = 8. Values of mean ± SEM are indicated below each box plot histogram. (D) IF staining for Ki-67 (red), YFP (green), and DAPI (blue) in three tumor groups. (Top panels) Representative pictures of the indicated tumors. (Bottom panels) Percentage of double Ki-67/YFP-positive cells. n = 6. (E) Number of circulating tumor cells (CTCs) in three tumor groups. The number of CTCs (mean ± SEM) is indicated below the box plot histograms. Bar, 50 μm.
We next examined YFP+ circulating tumor cells (CTCs) in tumor-bearing mice. We recently reported that Prrx1b expression is significantly increased in CTCs compared with matched primary tumor cells in the KPflCY model (Reichert et al. 2013a). Notably, although KPflCY-Prrx1a cells form the largest tumors, the number of CTCs in the KPflCY-Prrx1a tumor cohort is significantly lower than in the KPflCY control and KPflCY-Prrx1b tumor cohorts (Fig. 3E). KPflCY-Prrx1b tumors release significantly more cancer cells into the circulation than KPflCY-Prrx1a tumors (Fig. 3E). These data suggest that the number of CTCs does not correlate with the primary tumor volume but instead with the invasive capacity of pancreatic cancer cells. Taken together, we are able to demonstrate that Prrx1a promotes a well-differentiated tumor phenotype that is accompanied by fewer cells undergoing EMT and disseminating into the circulation. Conversely, Prrx1b promotes invasion, poorly differentiated tumors, and increased dissemination into the circulation.
Prrx1a fosters metastatic outgrowth in vivo
Considering that Prrx1a promotes epithelial differentiation and is highly expressed in large liver metastases, we hypothesized that Prrx1a facilitates metastatic colonization in vivo. In order to address this hypothesis, we designed four distinct in vivo experiments. First, we performed orthotopic transplantation of KPC2 control, KPC2-Prrx1a, and KPC2-Prrx1b cells (Fig. 4A). As in the KPflCY control/KPflCY-Prrx1a/KPflCY-Prrx1b experiments, KPC2-Prrx1b tumors grow aggressively into the host pancreatic parenchyma, whereas KPC2-Prrx1a tumors are circumscribed (Supplemental Fig. S4A). We next analyzed the frequency of liver metastasis. To distinguish metastatic seeding from metastatic outgrowth and colonization, we categorized liver metastases into small (<100 cells) and large (>100 cells). Interestingly, cells from KPC2-Prrx1b tumors form significantly more small metastases than KPC2 control and KPC2-Prrx1a tumors (Fig. 4B,C).
Figure 4.

Activation of Prrx1a and suppression of Prrx1b foster metastatic colonization. (A) Experimental design for orthotopic transplantation using KPC2 control, Prrx1a-overexpressing, and Prrx1b-overexpressing cells. (B) Representative histology of liver metastases of KPC2 control, Prrx1a, and Prrx1b tumors. Bar, 100 μm. (C) Frequency of small/large liver metastases in three tumor groups. Small metastases contain <100 cancer cells, and large metastases contain >100 cancer cells. (D) Experimental design for intraportal vein injection (liver metastasis model) of KPC2 cells. (E, top and middle panels) Representative histology and IHC staining for E-CADHERIN (ECAD) in metastatic liver disease in three experimental groups. Bar, 100 μm. (Bottom panels) IHC staining for Ki-67 in three groups. Bar, 20 μm. (F) Frequency of small/large liver metastases in three groups. (G) Percentage of mice harboring large metastases. (H) Percentage of Ki-67-positive cells in each liver metastasis in three groups. n = 6 for each group. (I) Experimental design for orthotopic transplantation using KPC2-Prrx1a or KPC2-Prrx1b cells with or without doxycycline. (J) Representative histology of liver metastases. Bar, 100 μm. (K) Frequency of liver metastases in four experimental groups (on/off Prrx1a or Prrx1b). Doxycycline treatment was initiated 12 d after transplantation. (L) Frequency of large metastases in four experimental groups.
Second, we used an in vivo liver metastasis assay in which cells were injected directly into the portal vein of mice, thereby bypassing invasion and intravasation at the primary tumor site (Thalheimer et al. 2009). We injected KPC2 control, KPC2-Prrx1a, and KPC2-Prrx1b cancer cells with a preset experimental timeline (Fig. 4D,E; Supplemental Fig. S4B). The ability of KPC2-Prrx1a cancer cells to establish large liver metastases is significantly higher than that of KPC2-Prrx1b cells (Fig. 4F). Furthermore, the frequency of large metastases in the KPC2-Prrx1a group is increased (Fig. 4G) and is associated with more E-CADHERIN (Fig. 4E). Furthermore, KPC2-Prrx1a cells show the highest proliferation index among all cohorts in the metastases (Fig. 4E,H). In line with these results, siRNA-mediated Prrx1a knockdown dramatically decreases proliferation of KPC2Liv2 metastatic cells (Supplemental Fig. S4C).
Third, we modulated Prrx1a and Prrx1b properties during primary tumor formation and metastatic dissemination using our tet-inducible system. Using KPC2 control cells, we determined primary tumor volume and frequency of liver metastases every 3 d after orthotopic transplantation (Supplemental Fig. S4D). Based on these results and in vitro experiments analyzing the responsiveness of transgene expression upon doxycycline exposure or removal (Supplemental Fig. S4E), we selected experimental day 12 to administer (on) or remove (off) doxycycline. We evaluated the dynamic relationship of Prrx1a and Prrx1b to MET and EMT, respectively, in the following experimental groups: Prrx1a off-to-off, Prrx1a off-to-on, Prrx1b on-to-on, and Prrx1b on-to-off (Fig. 4I). Remarkably, the frequency of liver metastases in Prrx1a mice exposed to doxycycline from day 12 (Prrx1a off-to-on) was significantly higher than in mice not exposed to doxycycline (Prrx1a off-to-off). Additionally, Prrx1a off-to-on mice harbor more large liver metastases compared with Prrx1a off-to-off (Fig. 4J–L). In contrast, the frequency of liver metastases in the Prrx1b on-to-on mice was significantly lower than in mice where doxycycline was removed by day 12 (Prrx1b on-to-off) (Fig. 4J,K), and these metastases also became larger when Prrx1b expression was turned off (Fig. 4L). These data suggest that Prrx1a directs metastatic outgrowth after cancer cells have left the primary tumor site, whereas Prrx1b regulates cancer cell dissemination. Maintained Prrx1b expression appears to prevent metastatic colonization.
Knockdown of both Prrx1 isoforms suppresses hematogenous dissemination and metastasis
Since both Prrx1 isoforms critically regulate distinct steps of the metastatic cascade, we investigated simultaneous knockdown of Prrx1a and Prrx1b using a short hairpin targeting both isoforms (shPrrx1a/b-GFP). We chose the KPC2 cell line, since this line exhibits the highest Prrx1b expression levels among all cell lines. After we confirmed efficient Prrx1a/b knockdown (Supplemental Fig. S5A), we analyzed morphological and transcriptional changes in 3D culture. KPC2 cells with knockdown of both Prrx1a and Prrx1b exhibited less mesenchymal characteristics morphologically (Supplemental Fig. S5B) as well as on a transcriptional level (Supplemental Fig. S5C). Functionally, knockdown of both isoforms leads to decreased invasiveness (Supplemental Fig. S5D) and impaired self-renewal capacity (Supplemental Fig. S5E).
To validate these results in vivo, we transplanted KPC2-shPrrx1a/b-GFP cells orthotopically into immunocompromised mice (Fig. 5A). Analyzing primary tumor volumes (Fig. 5B) and the number of CTCs (Fig. 5C) revealed smaller volumes and significantly fewer CTCs in the KPC2-shPrrx1a/b group compared with the KPC2-shcontrol-GFP group. Additionally, the incidence of metastases was decreased in KPC2-shPrrx1a/b-GFP mice compared with control animals (Fig. 5D). Taken together, these results suggest that the dynamic expression of Prrx1a and Prrx1b cooperates at different steps during tumor growth and metastatic dissemination.
Figure 5.
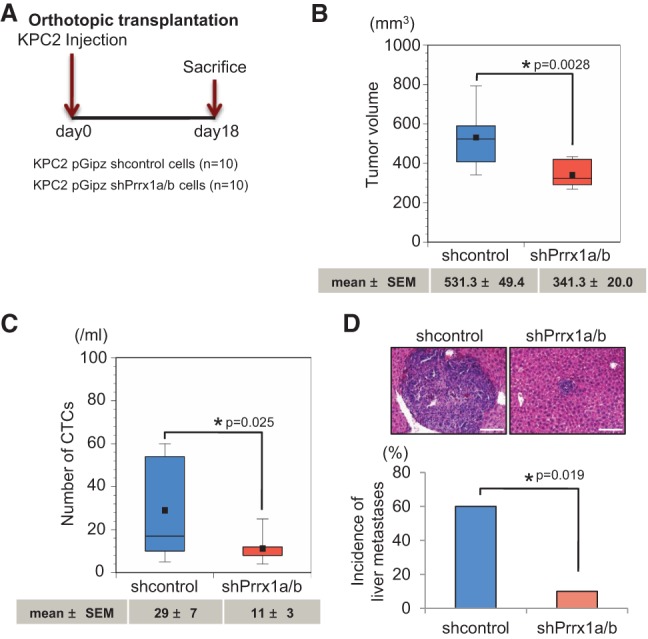
Suppression of Prrx1a/b attenuates pancreatic cancer formation, hematogenous dissemination, and metastatic colonization. (A) Experimental design for orthotopic transplantation using KPC2 control and Prrx1a/b knockdown cells. (B) Primary tumor volumes of KPC2 control and shPrrx1a/b groups. (C) Box plot histograms indicate the number of CTCs between control and Prrx1a/b knockdown cells. (D) Representative pictures of liver metastases and the frequency of metastases in two groups. Mean ± SEM is indicated below the box plot histograms. Bar, 100 μm.
Tumor differentiation is associated with specific Prrx1 isoforms in human PDAC
We showed that Prrx1 isoform expression determines the differentiation status in endogenous and exogenous mouse models of PDAC. We next analyzed the human tissue specimens of 108 PDAC patients (Supplemental Fig. S6A). Additionally, we obtained liver metastasis tissue from PDAC patients (n = 12) (Supplemental Fig. S6B). Tissue sections were subjected to PRRX1A and PRRX1B IHC. IHC of primary human PDAC demonstrated PRRX1B staining preferentially at the invasive front of the tumor tissue, while PRRX1A expression was present throughout (Supplemental Fig. S6C). All samples were categorized into two groups (low and high) for PRRX1A and PRRX1B by the degree of staining intensity (Supplemental Fig. S6D). Consistent with the in vivo results in our mouse models, PRRX1A intensity positively correlates with low-grade tumor differentiation. In contrast, PRRX1B expression is associated with an undifferentiated tumor grade in human PDAC (Fig. 6A). In addition, PRRX1A expression negatively correlates with PRRX1B expression in human PDAC samples (Fig. 6B). Furthermore, the PRRX1A “high” group showed significantly larger tumors than the PRRX1A “low” group, which is in line with our mouse data (Fig. 6C).
Figure 6.

Differential correlation of PRRX1A and PRRX1B isoforms with tumor differentiation status in human PDAC. (A) Representative IHC staining for PRRX1A and PRRX1B in well-differentiated, moderately differentiated, or poorly differentiated human PDAC (left panels) and correlation of PRRX1A (low/high) and PRRX1B (low/high) with the differentiation status (right panels). (B) Correlation of PRRX1A low/high and PRRX1B low/high groups in human primary PDAC. n = 100. (C) Primary pancreatic tumor volume of PRRX1A low/high and PRRX1B low/high groups (n = 100). (D, left panels) Representative IHC staining for PRRX1A and PRRX1B in pancreatic and metastatic liver tumors of the same PDAC patient. (Right panels) Correlation of PRRX1A low/high and PRRX1B low/high groups in primary PDAC and liver metastases. Bar, 50 μm.
Next, we compared PRRX1 isoform expression in primary tumors and liver metastases from PDAC patients. PRRX1A expression is significantly increased in metastases compared with primary PDAC (Fig. 6D). Notably, we observed a trend consistent with this finding in paired primary tumor and liver metastasis tissue obtained from the same PDAC patient (n = 7) (Supplemental Fig. S6E). In summary, these findings indicate that PRRX1A and PRRX1B modulate tumor differentiation in human PDAC. Furthermore, PRRX1A is associated with metastatic colonization of the liver.
Prrx1b facilitates invasion by transcriptionally regulating Hgf gene expression
We next identified genes regulated by Prrx1a and/or Prrx1b. Although the two splice variants Prrx1a and Prrx1b harbor the same homeobox domain, they display remarkable functional differences. To identify downstream targets bound by Prrx1a or Prrx1b, we performed chromatin immunoprecipitation (ChIP) followed by sequencing (ChIP-seq) using KPC1 cells transfected with control or Flag-tagged Prrx1 isoforms. In line with their different functional properties, we observed distinct DNA-binding patterns for PRRX1A and PRRX1B. Indeed, only 23 genes are bound by both isoforms (Fig. 7A). Kyoto Encyclopedia of Genes and Genomes (KEGG) pathway analysis revealed that PRRX1A binds to genes involved in cancer, including pancreatic cancer. In contrast, genes bound by PRRX1B show enrichment in focal adhesion as well as ErbB and axon guidance signaling. Interestingly, among the target genes of PRRX1B is Hgf, also known as scatter factor, as well as c-Met (HGF receptor [HGFR]). The Hgf–Met signaling axis is a key pathway regulating EMT and invasive tumor growth (Comoglio and Trusolino 2002; Pennacchietti et al. 2003). Mouse Hgf (mHgf) gene expression is up-regulated in KPflCY-Prrx1b cells, whereas KPflCY-Prrx1a cells show no change (Fig. 7B). Loss-of-function experiments were performed in KPC2 cancer cells, since these cells express the highest levels of mHgf among our cell lines (Supplemental Fig. S7A). As expected, mHgf is dramatically decreased in KPC2 cells upon Prrx1b knockdown by siRNA; however, it is unaffected by Prrx1a knockdown (Fig. 7B). In order to address whether the Prrx1b–Hgf axis regulates the invasive capabilities of cancer cells, we treated KPC2-sicontrol, siPrrx1a, and siPrrx1b cells with mouse recombinant HGF (mrHGF) in Matrigel invasion assays. Interestingly, impaired invasiveness of KPC2 cells upon Prrx1b knockdown can be rescued by mrHGF (Fig. 7C). Additionally, mrHGF treatment of KPC2 cells leads to an up-regulation of EMT genes, indicating that Prrx1b drives cellular invasion by regulating an EMT program via Hgf (Supplemental Fig. S7B). Additionally, PRRX1B and HGF are closely associated, especially at the invasive front of KPflCY tumors (Fig. 7D). Enzyme-linked immunosorbent assays (ELISAs) also revealed that HGF secretion is induced by Prrx1b overexpression (Fig. 7E) and abrogated by shRNA-mediated knockdown of Prrx1a/b (Fig. 7F). These results suggest that Prrx1b transcriptionally regulates Hgf and thereby facilitates cell invasion and mesenchymal differentiation in an autocrine fashion.
Figure 7.

Prrx1b–Hgf signaling regulates pancreatic cancer cell invasion. (A) Prrx1a and Prrx1b target genes identified by ChIP-seq. Genes of enriched pathways (KEGG) are indicated. (B) Relative mHgf gene expression in control and Prrx1a-overexpressing and Prrx1b-overexpressing KPflCY cells (left) and control and Prrx1a and Prrx1b knockdown KPC2 cells (right). (*) P < 0.05; mean ± standard deviation (SD). (C) Invasion assay in control and Prrx1a and Prrx1b knockdown cells using mrHGF. (D) Double IHC staining for PRRX1B (brown) and mHGF (blue) in KPflCY pancreatic tumors (orthotopic transplantation model). Bars, 50 μm. (E) Quantification of secreted mHGF protein by ELISA. n = 3; mean ± SEM. (F) Secreted mHGF protein in the supernatant of control and Prrx1a/b knockdown KPC2 cells. n = 5; mean ± SEM.
Neutralization of cancer cell-derived HGF reduces PDAC growth and metastasis in vivo
To demonstrate the importance of cancer cell-derived, autocrine HGF signaling, we obtained ficlatuzumab (formerly SCH900105 or AV-299; Aveo Pharmaceuticals, Inc.), a neutralizing antibody against human HGF (hHGF). Ficlatuzumab has been shown to inhibit HGF signaling (Mittra et al. 2013), and its tolerability has been tested in clinical trials (Patnaik et al. 2010; Tan et al. 2011). Its efficacy in pancreatic cancer was evaluated using the human pancreatic cancer cell line Panc1 in vitro. Panc1 cells were chosen due to their high endogenous levels of hHGF. Ficlatuzumab is able to abolish HGF-induced mesenchymal morphology (Supplemental Fig. S8A) as well as invasion using a Boyden chamber invasion assay (Supplemental Fig. S8B). Furthermore, hHGF neutralization by ficlatuzumab decreases Prrx1b-mediated invasion (Supplemental Fig. S8C). Given these in vitro findings, we designed a preclinical trial to compare the efficacy of ficlatuzumab, gemcitabine, or their combination in our orthotopic transplantation model both early in the process of tumor formation and later in the stage of metastatic progression. The study design is depicted in Figure 8, A and D. Transplanted mice were randomized into four treatment groups: IgG (control), ficlatuzumab, gemcitabine, and the combination of gemcitabine and ficlatuzumab. The absence of hHGF protein as well as high E-CADHERIN expression levels in tumors from the ficlatuzumab group indicate sufficient drug delivery (Fig. 8B). Strikingly, the primary tumor volumes in the ficlatuzumab and combination therapy groups were significantly smaller than in the IgG (control) group, and combination therapy—when compared with gemcitabine alone—exhibited a trend toward greater efficacy in reducing primary tumor volume (Fig. 8C). By extending the course of the orthotopic transplantation preclinical trial (“late trial” outlined in Fig. 8D), we found that the combination of gemcitabine and ficlatuzumab, but not either agent alone, significantly reduced the number of mice with metastasis (two of five vs. seven of seven) and the number of individual liver metastatic lesions per animal (0.6 vs. 7.86) in comparison with IgG control (Fig. 8E–G).
Figure 8.

Cancer cell-derived HGF is required for PDAC and initiation of metastasis in vivo. (A) Experimental design of the randomized trial using Panc1 cells in an orthotopic transplantation model (early trial). Human IgG antibody (control), ficlatuzumab (Fic), gemcitabine (Gem), and the combination ficlatuzumab with gemcitabine (Fic+Gem) were administrated through intraperitoneal injection. (B) Representative histology of pancreatic tumors of IgG control and ficlatuzumab groups. (Top panel) H&E. (Middle panel) IHC for hHGF. (Bottom panel) IHC for E-CADHERIN (ECAD). Black arrowheads show positive staining for the indicated proteins. (C) Pancreatic tumor volumes are depicted for treatment groups in box plot histograms. Each volume represents the mean ± SEM. (D) Experimental design of the randomized trial using Panc1 cells in an orthotopic transplantation model (late trial). (E) Representative H&E staining of liver metastases from each treatment group. (F) Frequency of liver metastases in four treatment groups. (G) Number of liver metastases per mouse in four treatment groups. Each number presents the mean ± SEM. Bar, 100 μm.
Together, these data demonstrate that Prrx1b drives production of HGF in cancer cells. Targeting the Prrx1b–Hgf axis may offer a new therapeutic approach in treating primary and metastatic pancreatic cancer, since anti-HGF therapy results in the diminution of both primary tumor volume and dissemination.
Discussion
The inability to detect PDAC prior to the dissemination of metastatic disease is one of the primary reasons PDAC has 5-year survival rates <5%. It is therefore critical to understand the molecular mechanisms by which cancer cells acquire the ability to leave the primary tumor site, survive in circulation, extravasate, and eventually colonize distant sites. EMT and MET are thought to be crucial cellular characteristics in the metastatic cascade (Thiery et al. 2009; Rhim et al. 2012; Giancotti 2013). Indeed, there appears to be an inverse correlation between local invasiveness and the ability of cancer cells to colonize distant organs (Tsai et al. 2012), and recent work indicates that there may even an inverse relationship between primary tumor growth and metastatic ability (Whittle et al. 2015). In addition, metastatic lesions tend to be more differentiated than their corresponding primary tumors (Brabletz 2012). This observation was confirmed in our data set comparing primary human PDAC and liver metastases. Moreover, PRRX1A is more abundant in human liver metastases compared with primary tumors, and metastases derived from Prrx1a-overexpressing cancer cells display an epithelial phenotype, which is consistent with the detection of higher levels of “luminal differentiation genes” in the context of metastatic breast cancer (Lawson et al. 2015). In contrast, Prrx1b-overexpressing cells form poorly differentiated tumors that are devoid of E-CADHERIN. We show for the first time that these two Prrx1 isoforms orchestrate distinct steps during PDAC invasion and dissemination (Fig. 9).
Figure 9.

Model of the functional roles of Prrx1a and Prrx1b in pancreatic cancer progression and metastasis.
HGF promotes a multistep program in cancer progression, including proliferation, migration, invasion, and metastasis. This process, mediated in an autocrine and/or paracrine fashion, is often termed “invasive growth” (Comoglio and Trusolino 2002). We reported recently that Prrx1b markedly stimulates proliferation in both normal ductal and PanIN cells. Additionally, Prrx1b strongly fosters PanIN cell invasion by initiating EMT (Reichert et al. 2013a). Using genetic lineage labeling, we demonstrated that EMT and hematogenous dissemination are early events in pancreatic cancer progression (Rhim et al. 2012). Indeed, Prrx1b is significantly up-regulated in circulating pancreatic cells at the PanIN stage (Reichert et al. 2013a). Here, we identify Hgf as a transcriptional target of PRRX1B as well as the functionally critical role that the Prrx1b–Hgf axis plays in regulating the invasive growth program during cancer progression. By inhibiting autocrine Prrx1b–Hgf signaling using the humanized HGF-neutralizing antibody ficlatuzumab in combination with the nucleoside analog gemcitabine, we demonstrated significant disruption of liver metastasis. Corroborating this in vivo observation of the synergistic effects of these two therapies are our in vitro data that demonstrate the synergistic effects of the silencing of Prrx1b with gemcitabine treatment on cell viability in a metastatic PDAC cell line (Supplemental Fig. S8D). Interestingly, ficlatuzumab is in a phase II clinical trial in non-small cell lung cancer in concert with an EGFR inhibitor, and our studies highlight the importance of insights that can be gained from coclinical (concurrent mouse–human) trials.
According to our results, Prrx1b contributes to primary tumor growth and dissemination; however, Prrx1b is not involved or might even be disadvantageous in metastatic outgrowth. Indeed, Prrx1b is restricted to small metastatic lesions and is not associated with proliferating cells, whereas large metastases show decreased Prrx1b expression. In line with these results, Hgf is down-regulated in metastatic PDAC cell lines compared with their primary cancer counterparts (Supplemental Fig. S7A), a pattern that has been observed previously (Shi et al. 2009). It has been demonstrated that the EMT program can suppress self-renewal capacities and the metastatic colonization potential of cancer cells (Tsuji et al. 2008; Celià-Terrassa et al. 2012); however, this relationship appears not to be imperative in other contexts (Mani et al. 2008). Indeed, our data suggest a complex interplay between EMT status and acquisition of enhanced self-renewal properties in pancreatic cancer.
Re-establishing epithelial integrity appears to be a requirement for disseminating cancer cells to form overt metastasis (Korpal et al. 2011). The epithelial phenotype is associated with self-renewal and proliferation, two properties that may be required to survive and expand in the hostile environment of a distant organ. Importantly, Prrx1a facilitates these properties in vitro and in vivo. Additionally, cell-intrinsic and cell-extrinsic factors support metastatic outgrowth (Gao et al. 2012; Wan et al. 2013). Interestingly, one Prrx1a target gene identified by us is Sonic hedgehog (Shh) (Fig. 7A). The maintenance of Shh signaling is critical for aberrant proliferation and tumorigenesis (Thayer et al. 2003) as well as the tumor stroma (Olive et al. 2009). The role of Shh at a secondary tumor site is poorly understood, but it is tempting to speculate that Prrx1a regulates Shh to establish the metastatic niche, a subject of future investigation.
Apart from illustrating the importance of these two Prrx1 isoforms at different stages of tumor progression, our data also indicate that Prrx1a and Prrx1b have a potential reciprocal relationship in regulating EMT plasticity. We demonstrated that the two Prrx1 isoforms regulate the phenotypic switch of cancer cells required for them to undergo MET and complete the metastatic cascade. However, it is curious that 30% of disseminating cancer cells that acquire mesenchymal traits are Prrx1a-positive (Supplemental Fig. S2D). In fact, we observed previously that cancer cells in circulation comprise three subpopulations: mesenchymal, epithelial, and intermediate CTCs. Epithelial and mesenchymal genes are coexpressed in intermediate CTCs (Rhim et al. 2012). Whether it is this intermediate cell type that eventually colonizes the distant organ site is not clear and might be addressed using spatio–temporal genetic mouse models of PDAC.
Collectively, we found that Prrx1a and Prrx1b fulfill separate functions; however, both isoforms might synergize at distinct steps of PDAC progression. We specifically found that Prrx1b drives production of HGF in cancer cells. Targeting the Prrx1b–Hgf axis may offer a new therapeutic approach in treating primary and metastatic pancreatic cancer, since anti-HGF therapy results in the diminution of both primary tumor volume and dissemination. We also reveal that strategies for treating either the primary tumor or metastasis need to take into account the EMT–MET continuum, allowing for new perspectives and priorities in the development of targeted therapeutics.
Materials and methods
Human tissue samples
Primary and metastatic PDAC tissues were obtained from a total of 113 pancreatic cancer patients who had undergone pancreatectomy (n = 108) and/or partial hepatectomy (n = 12) in the Department of General Surgery, Chiba University, Japan, between 2006 and 2013 (Supplemental Fig. S6). All tumors were graded as well-differentiated, moderately differeentiated, or poorly differentiated PDAC. The Ethics Committee of this institute approved the protocol, and written informed consent was obtained from each patient before surgery.
Cell lines and culture conditions
Mouse primary pancreatic cells were cultured and maintained as described previously (Norris and Kern 2001; Reichert et al. 2013a,b). Murine PanIN (4313/KC), PDAC (4964/KPC1 and 5143/KPC2), and paired metastases (4964Liv/KPC1Liv and 5143Liv2/KPC2Liv2) were provided by Dr. Sunil Hingorani. In brief, 4313/KC cells were isolated from a mouse at a PanIN stage (Pdx1-cre; LSL-KrasG12D/+). 4964/KPC1 and 5143/KPC2 cell lines (Pdx1-cre; LSL-KrasG12D/+; p53R172H/+) were established from primary PDAC (Hingorani et al. 2005), whereas the 4964Liv/KPC1Liv and 5143Liv2/KPC2Liv2 cell lines (Pdx1-cre; LSL-KrasG12D/+; p53R172H/+) were isolated from paired liver metastases arising in 4964/KPC1 and 5143/KPC2 mice. KPflCY cells were derived from a Pdx1-cre; LSL-KrasG12D/+; p53fl/+; R26YFP mouse (cell line 7182Y) and were provided by Dr. Andrew D. Rhim (University of Michigan). The human pancreatic cancer cell line Panc1 was purchased from American Type Culture Collection and maintained in Dulbecco's modified Eagle medium (DMEM) (Sigma Chemical Co.) supplemented with 10% fetal bovine serum (FBS) and 1% penicillin/streptomycin. mrHGF (10 ng/mL; R&D Systems, 2207-HG ) or 10ng/mL human recombinant HGF (R&D Systems, 294-HG) was used for HGF stimulation assays.
3D pancreatic cell culture
3D pancreatic cell culture was performed as described previously (Wescott et al. 2009; Reichert et al. 2013a,b). For RNA extraction from 3D cultured cells, collagen-coated cells in four-well chamber slides (Thermo Fisher Scientific, Nunc 177437) were collected and collagenase-digested for 20 min in a 37°C water bath. After trypsinization, total RNA was extracted using the RNeasy minikit (Qiagen) according to the manufacturer's instructions.
Invasion assay
Invasion assays were performed as described previously (Reichert et al. 2013a) and are described in detail in the Supplemental Material.
Single-cell pancreatosphere assay
Single cells were sorted by FACS (FACSDiva flow cytometer and software, BD Bioscience). For details, see the Supplemental Material.
Colony formation assay
KPC1 or KPC2 cells were suspended in DMEM supplemented with 10% FBS and 0.67% agarose and plated on a layer of 1.0% agarose. The experiments were carried out in 24-well plates with 1000 cells per well and were performed in quadruplicate at least three times independently. Colonies were photographed (Leica DMIRB inverted microscope) and quantified manually 2 wk after seeding.
Immunohistochemical and IF staining
IF staining was carried out as described previously (Reichert et al. 2013a). Single and double IHC were performed using the ABC kit (Vector Laboratories, Inc.) according to the manufacturer's protocol. 3,3′ diaminobenzidine chromogen (Vector Laboratories) was used for signal development of single and double staining. Blue alkaline phosphate substrate (Vector Laboratories) was used for double staining. The histology of each human PDAC specimen was examined by two independent investigators (S. Takano and T. Nishida) and classified as follows: Low/high was determined based on >30% staining (high) or <30% staining (low) for PRRX1A and positive nuclear staining (high) or negative nuclear staining (low) for PRRX1B in at least two high-power fields. For antibody information and conditions as well as details of the peptide-blocking study, see the Supplemental Material.
Quantitative RT–PCR
One microgram of RNA was transcribed into cDNA (TaqMan reverse transcription reagents, Applied Biosystems) and assayed through quantitative real-time PCR using Power SYBR master mix (Applied Biosystems) on the StepOnePlus system (Applied Biosystems). Primers are listed in Supplemental Table S1. P < 0.05 was statistically significant (Mann-Whitney-Wilcoxon test). Error bars represent the standard deviation (SD).
Western blotting
Western blotting was performed as described previously (Reichert et al. 2013a) and is described in detail in the Supplemental Material.
ELISA
mHGF-secreted protein levels were measured in the supernatant of cultured cells as well as mouse serum using the mHGF DuoSet (R&D Systems, DY2207) according to the manufacturer's protocol.
RNAi transfection and vector constructs
RNAi transfection and lentiviral transduction were performed as described previously (Reichert et al. 2013a). Lentiviral vectors have been published previously (Reichert et al. 2013a,b).
ChIP-seq
The SimpleChIP enzymatic ChIP kit was used according the manufacturer's instructions (Cell Signaling Technology). ChIP was performed in KPC1 cells expressing either control, Flag-tagged Prrx1a, or Flag-tagged Prrx1b. In brief, DNA-binding proteins were cross-linked covalently to their DNA substrates in living cells by incubation in 1% formaldehyde. After washing with PBS, the DNA was fragmented, and the lysates were subsequently incubated with anti-Flag M2 antibody to precipitate DNA fragments that bound either Prrx1a or Prrx1b. Library preparation was performed using the ChIP-seq DNA sample preparation kit (Illumina, Inc.). DNA 200 ± 25 base pairs (bp) was excised and purified. Adapter-modified purified DNA was enriched by PCR followed by validation using an Agilent Technologies Bioanalyzer (Agilent Technologies, Inc.). Sequencing was performed using the Illumina HiSeq 2000.
Animals and experimental procedures
The Institutional Animal Care and Use Committee (IACUC) of the University of Pennsylvania approved all animal studies (protocol no. 804209). Eight-week-old female Ncr nude mice were purchased from Taconic. Orthotopic transplantation in the pancreas was performed as described previously (Mohammad et al. 1998). The subcapsular space of the pancreata of nude mice was injected with 1 × 10⁵ pancreatic cancer cells (KPC2 or KPflCY) suspended in 25 µL of DMEM/10% FBS. Intraportal vein injection was performed as follows. After anesthesia and proper sterile preparation of the abdomen, a small incision was made in the upper abdomen to allow mobilization of the duodenum to liberate the portal vein. KPC2 cancer cells (3 × 10⁵) suspended in 200 µL of PBS with doxycycline were then injected into the portal vein of mice using a 32-gauge needle. After removal of the needle, a sterile narrow cotton swab was immediately placed at the injection site. Light compression was maintained for 3 min. The intestine was then repositioned, and the ventral incision was closed with 4-0 absorbable vicryl sutures using a running suture technique. The mice were sacrificed 14 d after the procedure to evaluate for the presence of liver metastases.
For histology, pancreata and livers were fixed in zinc formalin overnight, transferred to 70% ethanol, and embedded in paraffin. The presence of liver metastasis was quantified as follows. Livers sections were collected and mounted onto glass slides as soon as the maximal footprint was reached. Next, four additional sections, 300 µm apart from each other, were collected. Liver sections were stained with hematoxylin and eosin (H&E) and analyzed by microscopy. Metastatic foci were photographed, and the number of cells per focus was quantified manually.
Analysis of CTCs
YFP+ or GFP+ cells in blood were detected as described previously (Rhim et al. 2012).
Ficlatuzumab treatment
Panc1 cells (1 × 10⁶) suspended in 50 µL of DMEM/10%FBS were injected orthotopically into the tails of pancreata of 8-wk-old female nude mice. After tumor growth was confirmed by ultrasound, mice were randomized into four experimental groups: IgG control group (IgG), ficlatuzumab group (Fic), gemcitabine group (Gem), and combination therapy of gemcitabine and ficlatuzumab (Gem+Fic). Human IgG antibody (R&D Systems, 1-100-A), ficlatuzumab (AVEO Pharmaceuticals), and gemcitabine HCl (Eli Lilly and Company) were used. In the “early trial,” at day 15, mice were injected intraperitoneally with IgG antibody, 20 mg/kg ficlatuzumab, 100 mg/kg gemcitabine, or both ficlatuzumab and gemcitabine twice per week for 2 wk. In the “late trial,” treatment was started at day 78 and proceeded twice weekly for 4 wk. Pancreata and livers were harvested at day 51 in the “early trial” and at day 110 in the “late trial.” The tumor volume was measured using an electronic caliper and calculated using the following formula: π/6 × (L × W × W), where L is the tumor at its longest, and W is the tumor at its shortest (Kozono et al. 2013). The incidence of liver metastases was evaluated as described above.
Statistical analysis
For all in vitro experiments, statistical analyses were performed using the Mann-Whitney-Wilcoxon test except where noted otherwise. For in vivo experiments, statistical analyses were conducted using Welch's t-test for comparison of positivity in IHC/IF staining, tumor volume, and number of CTCs. Frequency of metastases was analyzed using the χ2 test. For human tissue data, Welch's t-test was used to analyze primary tumor volumes and comparison of IHC scores between primary and metastatic PDAC. The χ2 test was used to evaluate the correlation between the IHC scores and differentiation status of PDAC samples. P < 0.05 was considered statistically significant. Values are expressed as mean ± SEM or SD.
Primer sequences
For primer sequences, see the Supplemental Material.
Supplementary Material
Acknowledgments
We express our gratitude to the Functional Genomics Core Facility (Jonathan Schug and Klaus Kaestner) and the Flow Cytometry and Cell Sorting Facility. We are grateful to Dr. Sunil Hingorani for the 4313/KC, 4964/KPC1, 5143/KPC2, 4964Liv/KPC1Liv, and 5143Liv2/KPC2Liv2 cell lines, and Dr. May Han and AVEO Pharmaceuticals, Inc., for ficlatuzumab. We thank Dr. Andrew Rhim for the KPflCY cell line (7182Y), and Nicole Aiello (laboratory of Dr. Ben Stanger) for KPflCY tissues. Finally, we are grateful for discussions with members of the Rustgi laboratory (Apple Long), the Penn Pancreas Group (Dr. Ravikanth Maddipati, Dr. Gregory Beatty, Dr. Ben Stanger, and Dr. Robert Vonderheide), Dr. Andrew Rhim (University of Michigan), and Dr. Hideyuki Yoshitomi (Chiba University). This work was supported by the National Institutes of Health (NIH) R01 DK060694 (to S.T., M.R., M.A.C., B.M., and A.K.R.), NIH/National Cancer Institute (NCI) F30 CA180601-10 (B.B.), NIH/National Institute of Diabetes and Digestive and Kidney Diseases (NIDDK) T32-DK007066 (K.K.D.), National Pancreas Foundation (M.R.), the German Cancer Aid Foundation (Max Eder Program, Deutsche Krebshilfe 111273 to M.R.), AGA-Actavis Research Award in Pancreatic Disorders (M.R.), Honjo International Scholarship Foundation (S.T.), NIH/NIDDK P30-DK050306 Center for Molecular Studies in Digestive and Liver Diseases (Molecular Pathology and Imaging, Molecular Biology/Gene Expression, Cell Culture, and Transgenic and Chimeric Mouse Cores), and American Cancer Society Grant RP-10-033-01-CCE (A.K.R.). This work was also supported by NCI R01CA113669 (A.M.) and Grant-in-Aid for Scientific Research “KAKENHI” (B) 15H04925 (S.T. and M.M.).
Footnotes
Supplemental material is available for this article.
Article is online at http://www.genesdev.org/cgi/doi/10.1101/gad.263327.115.
References
- Bilimoria KY, Bentrem DJ, Ko CY, Tomlinson JS, Stewart AK, Winchester DP, Talamonti MS. 2007. Multimodality therapy for pancreatic cancer in the U.S.: utilization, outcomes, and the effect of hospital volume. Cancer 110: 1227–1234. [DOI] [PubMed] [Google Scholar]
- Brabletz T. 2012. To differentiate or not—routes towards metastasis. Nat Rev Cancer 12: 425–436. [DOI] [PubMed] [Google Scholar]
- Cardin DB, Berlin JD. 2013. Pancreas cancer on the rise: are we up to the challenge? J Natl Cancer Inst 105: 1675–1676. [DOI] [PubMed] [Google Scholar]
- Celià-Terrassa T, Meca-Cortés O, Mateo F, de Paz AM, Rubio N, Arnal-Estapé A, Ell BJ, Bermudo R, Díaz A, Guerra-Rebollo M, et al. 2012. Epithelial–mesenchymal transition can suppress major attributes of human epithelial tumor-initiating cells. J Clin Invest 122: 1849–1868. [DOI] [PMC free article] [PubMed] [Google Scholar]
- Comoglio PM, Trusolino L. 2002. Invasive growth: from development to metastasis. J Clin Invest 109: 857–862. [DOI] [PMC free article] [PubMed] [Google Scholar]
- Gao H, Chakraborty G, Lee-Lim AP, Mo Q, Decker M, Vonica A, Shen R, Brogi E, Brivanlou AH, Giancotti FG. 2012. The BMP inhibitor Coco reactivates breast cancer cells at lung metastatic sites. Cell 150: 764–779. [DOI] [PMC free article] [PubMed] [Google Scholar]
- Giancotti FG. 2013. Mechanisms governing metastatic dormancy and reactivation. Cell 155: 750–764. [DOI] [PMC free article] [PubMed] [Google Scholar]
- Hezel AF, Kimmelman AC, Stanger BZ, Bardeesy N, Depinho RA. 2006. Genetics and biology of pancreatic ductal adenocarcinoma. Genes Dev 20: 1218–1249. [DOI] [PubMed] [Google Scholar]
- Hingorani SR, Wang L, Multani AS, Combs C, Deramaudt TB, Hruban RH, Rustgi AK, Chang S, Tuveson DA. 2005. Trp53R172H and KrasG12D cooperate to promote chromosomal instability and widely metastatic pancreatic ductal adenocarcinoma in mice. Cancer Cell 7: 469–483. [DOI] [PubMed] [Google Scholar]
- Korpal M, Ell BJ, Buffa FM, Ibrahim T, Blanco MA, Celià-Terrassa T, Mercatali L, Khan Z, Goodarzi H, Hua Y, et al. 2011. Direct targeting of Sec23a by miR-200s influences cancer cell secretome and promotes metastatic colonization. Nat Med 17: 1101–1108. [DOI] [PMC free article] [PubMed] [Google Scholar]
- Kozono S, Ohuchida K, Eguchi D, Ikenaga N, Fujiwara K, Cui L, Mizumoto K, Tanaka M. 2013. Pirfenidone inhibits pancreatic cancer desmoplasia by regulating stellate cells. Cancer Res 73: 2345–2356. [DOI] [PubMed] [Google Scholar]
- Lawson DA, Bhakta NR, Kessenbrock K, Prummel KD, Yu Y, Takai K, Zhou A, Eyob H, Balakrishnan S, Wang CY, et al. 2015. Single-cell analysis reveals a stem-cell program in human metastatic breast cancer cells. Nature 526: 131–135. [DOI] [PMC free article] [PubMed] [Google Scholar]
- Li R, Liang J, Ni S, Zhou T, Qing X, Li H, He W, Chen J, Li F, Zhuang Q, et al. 2010. A mesenchymal-to-epithelial transition initiates and is required for the nuclear reprogramming of mouse fibroblasts. Cell Stem Cell 7: 51–63. [DOI] [PubMed] [Google Scholar]
- Ma J, Siegel R, Jemal A. 2013. Pancreatic cancer death rates by race among US men and women, 1970–2009. J Natl Cancer Inst 105: 1694–1700. [DOI] [PubMed] [Google Scholar]
- Mani SA, Guo W, Liao MJ, Eaton EN, Ayyanan A, Zhou AY, Brooks M, Reinhard F, Zhang CC, Shipitsin M, et al. 2008. The epithelial–mesenchymal transition generates cells with properties of stem cells. Cell 133: 704–715. [DOI] [PMC free article] [PubMed] [Google Scholar]
- Mittra ES, Fan-Minogue H, Lin FI, Karamchandani J, Sriram V, Han M, Gambhir SS. 2013. Preclinical efficacy of the anti-hepatocyte growth factor antibody ficlatuzumab in a mouse brain orthotopic glioma model evaluated by bioluminescence, PET, and MRI. Clin Cancer Res 19: 5711–5721. [DOI] [PMC free article] [PubMed] [Google Scholar]
- Mohammad RM, Dugan MC, Mohamed AN, Almatchy VP, Flake TM, Dergham ST, Shields AF, Al-Katib AA, Vaitkevicius VK, Sarkar FH. 1998. Establishment of a human pancreatic tumor xenograft model: potential application for preclinical evaluation of novel therapeutic agents. Pancreas 16: 19–25. [DOI] [PubMed] [Google Scholar]
- Morton JP, Timpson P, Karim SA, Ridgway RA, Athineos D, Doyle B, Jamieson NB, Oien KA, Lowy AM, Brunton VG, et al. 2010. Mutant p53 drives metastasis and overcomes growth arrest/senescence in pancreatic cancer. Proc Natl Acad Sci 107: 246–251. [DOI] [PMC free article] [PubMed] [Google Scholar]
- Muller PAJ, Vousden KH. 2013. p53 mutations in cancer. Nat Cell Biol 15: 2–8. [DOI] [PubMed] [Google Scholar]
- Norris RA, Kern MJ. 2001. The identification of Prx1 transcription regulatory domains provides a mechanism for unequal compensation by the Prx1 and Prx2 loci. J Biol Chem 276: 26829–26837. [DOI] [PubMed] [Google Scholar]
- Ocaña OH, Córcoles R, Fabra A, Moreno-Bueno G, Acloque H, Vega S, Barrallo-Gimeno A, Cano A, Nieto MA. 2012. Metastatic colonization requires the repression of the epithelial–mesenchymal transition inducer Prrx1. Cancer Cell 22: 709–724. [DOI] [PubMed] [Google Scholar]
- Olive KP, Jacobetz MA, Davidson CJ, Gopinathan A, McIntyre D, Honess D, Madhu B, Goldgraben MA, Caldwell ME, Allard D, et al. 2009. Inhibition of hedgehog signaling enhances delivery of chemotherapy in a mouse model of pancreatic cancer. Science 324: 1457–1461. [DOI] [PMC free article] [PubMed] [Google Scholar]
- Pastrana E, Silva-Vargas V, Doetsch F. 2011. Eyes wide open: a critical review of sphere-formation as an assay for stem cells. Cell Stem Cell 8: 486–498. [DOI] [PMC free article] [PubMed] [Google Scholar]
- Patnaik A, Weiss GJ, Papadopoulos K, Tibes R, Tolcher AW, Payumo FC, Cotreau MM, Jac J, Isaacs R, Ramanathan RK. 2010. Phase I study of SCH 900105 (SC), an anti-hepatocyte growth factor (HGF) monoclonal antibody (MAb), as a single agent and in combination with erlotinib (E) in patients (pts) with advanced solid tumors. ASCO Meeting Abstracts 28: 2525. [Google Scholar]
- Pennacchietti S, Michieli P, Galluzzo M, Mazzone M, Giordano S, Comoglio PM. 2003. Hypoxia promotes invasive growth by transcriptional activation of the met protooncogene. Cancer Cell 3: 347–361. [DOI] [PubMed] [Google Scholar]
- Reichert M, Takano S, von Burstin J, Kim SB, Lee JS, Ihida-Stansbury K, Hahn C, Heeg S, Schneider G, Rhim AD, et al. 2013a. The Prrx1 homeodomain transcription factor plays a central role in pancreatic regeneration and carcinogenesis. Genes Dev 27: 288–300. [DOI] [PMC free article] [PubMed] [Google Scholar]
- Reichert M, Takano S, Heeg S, Bakir B, Botta G, Rustgi A. 2013b. Isolation, culture and genetic manipulation of mouse pancreatic ductal cells. Nat Protoc 8: 1354–1365. [DOI] [PMC free article] [PubMed] [Google Scholar]
- Rhim AD, Mirek ET, Aiello NM, Maitra A, Bailey JM, McAllister F, Reichert M, Beatty GL, Rustgi AK, Vonderheide RH, et al. 2012. EMT and dissemination precede pancreatic tumor formation. Cell 148: 349–361. [DOI] [PMC free article] [PubMed] [Google Scholar]
- Shi WD, Meng ZQ, Chen Z, Lin JH, Zhou ZH, Liu LM. 2009. Identification of liver metastasis-related genes in a novel human pancreatic carcinoma cell model by microarray analysis. Cancer Lett 283: 84–91. [DOI] [PubMed] [Google Scholar]
- Tan E, Park K, Lim WT, Ahn M, Ng QS, Ahn JS, Tan DS, Sun J, Jac J, Han M, et al. 2011. Phase Ib Study of ficlatuzumab (formerly AV-299), an anti-hepatocyte growth factor (HGF) monoclonal antibody (MAb) in combination with gefitinib (G) in asian patients (pts) with NSCLC. ASCO Meeting Abstracts 29: 7571. [Google Scholar]
- Thalheimer A, Otto C, Bueter M, Illert B, Gattenlohner S, Gasser M, Meyer D, Fein M, Germer CT, Waaga-Gasser AM. 2009. The intraportal injection model: a practical animal model for hepatic metastases and tumor cell dissemination in human colon cancer. BMC Cancer 9: 29. [DOI] [PMC free article] [PubMed] [Google Scholar]
- Thayer SP, di Magliano MP, Heiser PW, Nielsen CM, Roberts DJ, Lauwers GY, Qi YP, Gysin S, Fernández-del Castillo C, Yajnik V, et al. 2003. Hedgehog is an early and late mediator of pancreatic cancer tumorigenesis. Nature 425: 851–856. [DOI] [PMC free article] [PubMed] [Google Scholar]
- Thiery JP, Acloque H, Huang RYJ, Angela Nieto M. 2009. Epithelial–mesenchymal transitions in development and disease. Cell 139: 871–890. [DOI] [PubMed] [Google Scholar]
- Tsai JH, Donaher JL, Murphy DA, Chau S, Yang J. 2012. Spatiotemporal regulation of epithelial–mesenchymal transition is essential for squamous cell carcinoma metastasis. Cancer Cell 22: 725–736. [DOI] [PMC free article] [PubMed] [Google Scholar]
- Tsuji T, Ibaragi S, Shima K, Hu MG, Katsurano M, Sasaki A, Hu G-F. 2008. Epithelial–mesenchymal transition induced by growth suppressor p12CDK2-AP1 promotes tumor cell local invasion but suppresses distant colony growth. Cancer Res 68: 10377–10386. [DOI] [PMC free article] [PubMed] [Google Scholar]
- Wan L, Pantel K, Kang Y. 2013. Tumor metastasis: moving new biological insights into the clinic. Nat Med 19: 1450–1464. [DOI] [PubMed] [Google Scholar]
- Wescott MP, Rovira M, Reichert M, von Burstin J, Means A, Leach SD, Rustgi AK. 2009. Pancreatic ductal morphogenesis and the Pdx1 homeodomain transcription factor. Mol Biol Cell 20: 4838–4844. [DOI] [PMC free article] [PubMed] [Google Scholar]
- Whittle MC, Izeradjene K, Rani PG, Feng L, Carlson MA, DelGiorno KE, Wood LD, Goggins M, Hruban RH, Chang AE, et al. 2015. RUNX3 controls a metastatic switch in pancreatic ductal adenocarcinoma. Cell 161: 1345–1360. [DOI] [PMC free article] [PubMed] [Google Scholar]
Associated Data
This section collects any data citations, data availability statements, or supplementary materials included in this article.