

Abstract
Quantifying induced virion production from single proviruses is important for assessing the effects of HIV-1 latency reversal agents. Limiting dilution ex vivo cultures of resting CD4+ T cells from 14 HIV-positive volunteers revealed that virion production after T-cell activation from individual proviruses varies by 10,000-fold to 100,000-fold. High-producing proviruses were associated with increases in cell-associated HIV-1 DNA levels, suggesting that reactivated proviruses proliferate. Single-cell analyses are needed to investigate differences in proviral expansion and virus production following latency reversal.
TEXT
HIV-1 virion production from resting CD4+ T cells (rCD4) is commonly measured to assess the size of the latent reservoir and the effectiveness of latency reversal agents (1–4). Prior in vitro and in vivo studies have estimated the average viral burst size, defined as the total number of virions produced by an HIV-1-producing cell over its lifetime, to be 3 to 4 log10 virions/cell (5–9). However, most of these values were derived using parameters estimated from bulk proviral populations. No studies have quantified the distribution of virion production ex vivo from individual reactivated proviruses.
To better understand latency reversal at the single-provirus level, we isolated peripheral blood rCD4 from 14 HIV-1-infected participants on suppressive antiretroviral therapy (ART) for ≥2 years by negative selection as described previously (1). The study was approved by the University of Pittsburgh Institutional Review Board, and all blood donors gave written informed consent. The rCD4 were serially diluted and stimulated for 7 days with anti-CD3/CD28 beads (Life Technologies) at 3 beads/cell in the presence of 300 nM efavirenz and 100 nM raltegravir, which block viral replication as determined by single-genome sequencing (SGS) analysis of supernatant HIV-1 RNA (data not shown). HIV-1 virion production was measured using Roche Cobas AmpliPrep/TaqMan v2.0 (1). Preliminary experiments demonstrated that virion production peaked after 7 days of stimulation, with high cellular viability (data not shown). Using Poisson's distribution, we identified 19 wells with a ≥96% chance of containing only 1 reactivated provirus. The levels of virus production by these single proviruses differed by ∼4 log10 HIV-1 RNA copies/provirus (range, 42 to 42,456) (Fig. 1).
FIG 1.
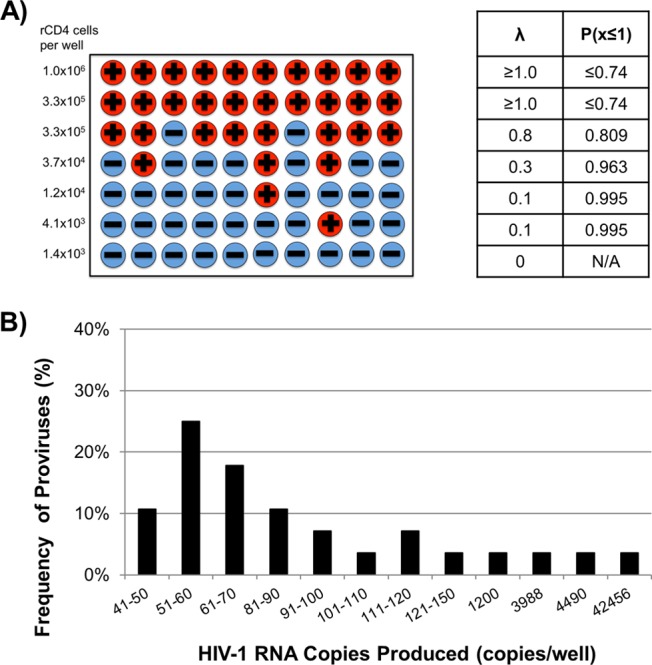
(A) Schematic of theoretical results using the limiting dilution method and use of Poisson statistics to calculate the probability that a culture with detectable HIV-1 virion production was produced by a single HIV-1 provirus. Wells with detectable HIV-1 virion production are represented by a plus sign (+), and the wells without detectable HIV-1 virion production are represented by a minus sign (−). The Poisson statistics for each row are indicated in the table. λ represents the average rate of success, which is the fraction of wells with detectable HIV-1 virion production at a given dilution. P(x≤1) represents the cumulative probability that a given well contains one or fewer expressing proviruses. (B) Distribution of induced HIV-1 virion production from individual proviruses in resting CD4+ T cells from 14 HIV-infected donors. Purified resting CD4+ T cells were serially diluted and stimulated with anti-CD3/CD28 beads for 7 days. HIV-1 RNA in the supernatants was quantified using Roche Cobas AmpliPrep/TaqMan v2.0, and Poisson statistics were used to identify 19 wells in which single inducible proviruses were present. Only data from wells with detectable HIV-1 RNA are shown.
To perform a more detailed analysis of single reactivated proviruses, rCD4 were isolated from a participant and cultured in 352 wells of 96-well plates at 74,000 cells/well (a concentration empirically determined to identify individual reactivated proviruses). The rCD4 were stimulated for 7 days with 50 ng/ml phorbol 12-myristate 13-acetate (PMA) and 500 ng/ml of ionomycin (PMA/ionomycin) in the presence of 300 nM efavirenz and 100 nM raltegravir.
To characterize the upper limit of virion production by individual reactivated proviruses, a screening method was developed to identify wells with high virion production. Aliquots of supernatant from wells in each plate row were pooled (12 wells/row, 32 rows total), and HIV-1 RNA was quantified using an integrase single-copy assay (iSCA) (10) that was modified to include initial centrifugation of supernatants at 21,000 × g for 1 h at 4°C. We identified six rows containing at least 1 provirus each producing ≥2,000 HIV-1 RNA copies/well. For these six rows, the remaining supernatant from each well was extracted and HIV-1 RNA was quantified using the modified iSCA to identify wells containing single reactivated proviruses (Fig. 2). Virion production among individual reactivated proviruses from this donor spanned ∼5 log10 HIV-1 RNA copies/provirus (range, 1 to 296,759).
FIG 2.
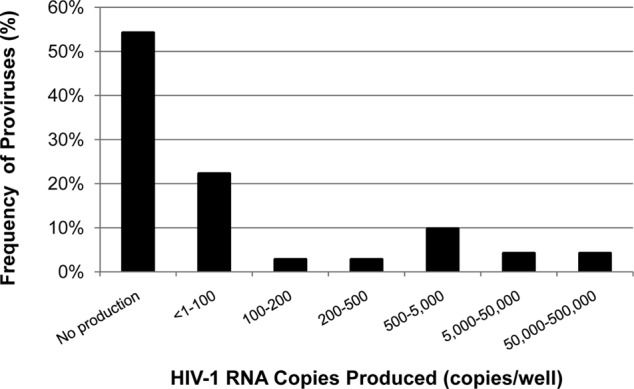
Detailed analysis of HIV-1 virion production from single inducible proviruses. Resting CD4+ T cells from a donor were serially diluted, maximally stimulated with PMA/ionomycin for 7 days, and then assayed for HIV-1 RNA in the supernatant using quantitative reverse transcriptase PCR (qRT-PCR). Data are shown from 6 plate rows (72 wells in total) that were positively screened to contain at least 1 provirus that produces ≥2,000 HIV-1 RNA copies/ml.
Approximately 47% of the wells in the positively screened rows had detectable HIV-1 virion production following stimulation. According to Poisson's distribution, ∼80% of wells with detectable HIV-1 RNA were expected to contain a single expressing HIV-1 provirus. Single-genome sequencing (SGS) (11, 12) revealed that three of four wells had monotypic sequences with infrequent single-base-pair differences within the known error rate of SGS (∼1.1 × 10⁻⁴ errors/nucleotide) (Fig. 3) (11), confirming that most wells with detectable HIV-1 RNA contained a single expressing provirus. The diversity in the fourth well (Fig. 3D) was likely a result of the presence of >1 reactivated proviruses rather than viral replication, which is blocked by 300 nM efavirenz and 100 nM raltegravir as described above.
FIG 3.
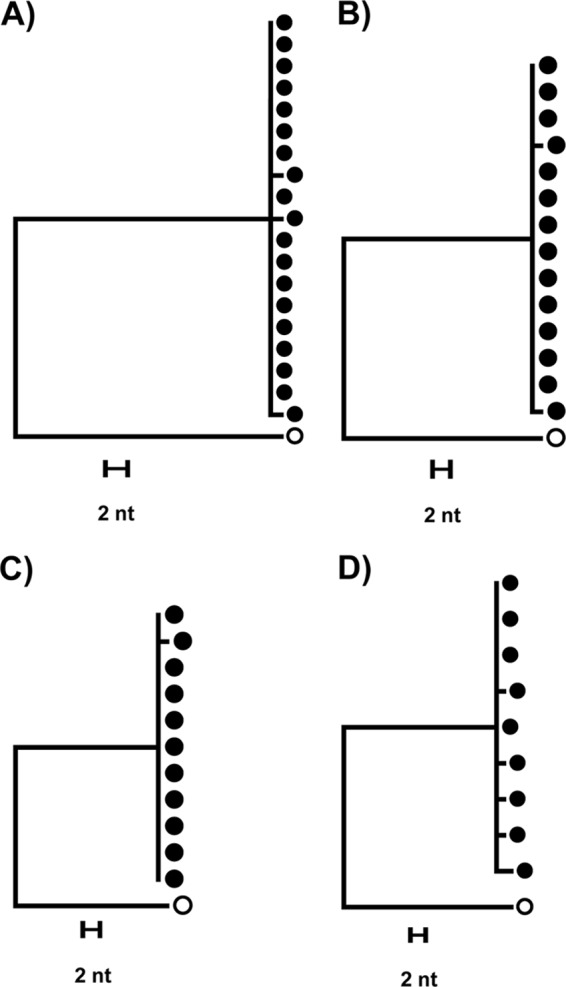
Single-genome sequence and phylogenetic analysis of virions induced from proviruses at the limiting dilution endpoint. Closed symbols represent supernatant RNA sequences, and open symbols represent the consensus HIV-1 subtype B sequence to which each tree was rooted. The single nucleotide (nt) differences of the sequences in panels A to C are within the expected error rate of SGS (∼1.1 × 10⁻⁴ errors per base sequenced or ∼1 to 2 errors per 10 sequences) and are thus consistent with virus production from single proviruses. The sequences in panel D show multiple nucleotide differences and therefore were likely derived from two or more reactivated proviruses in that culture.
We next quantified cell-associated HIV-1 DNA (CA-DNA) (1, 13) in 14 culture wells with >200 HIV-1 RNA copies/well and in 9 wells that produced <200 HIV-1 RNA copies/well. A statistically significant, positive correlation was found between the increase in CA-DNA levels in wells and HIV-1 RNA production (Spearman ρ = 0.476, P = 0.0338) (Fig. 4A). Grouped by the number of virions produced, wells with higher virion production (≥200 HIV-1 RNA copies/well) had greater CA-DNA levels than the lower producers (<200 HIV-1 RNA copies/well) and nonproducers (<1 HIV-1 RNA copy/well) (P = 0.0186, P = 0.0075, respectively [Mann-Whitney U test with Bonferroni adjustment]), suggesting that expansion and survival of virus-producing cells may contribute to the higher virion production observed for some proviruses (Fig. 4B).
FIG 4.
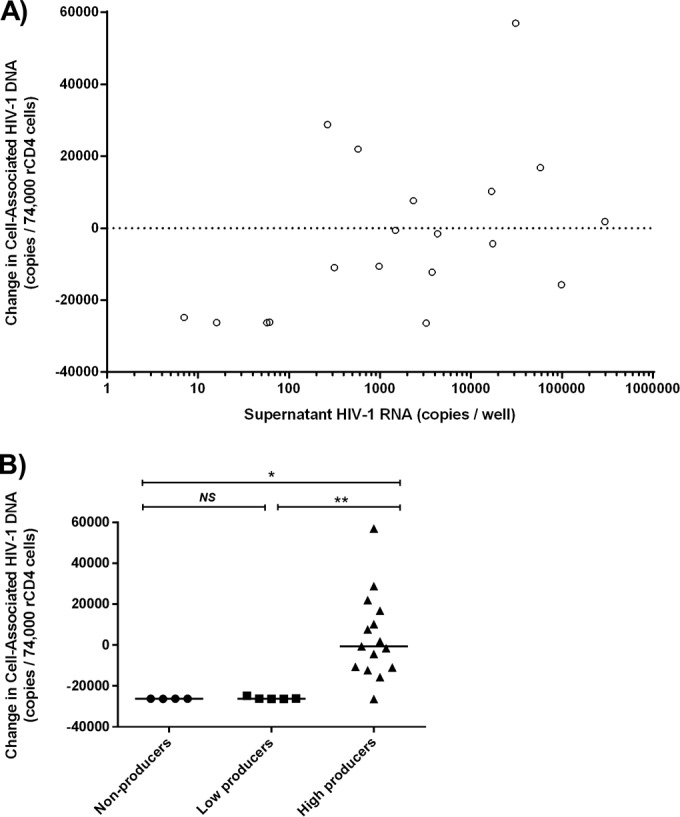
Higher virion production is associated with greater levels of cell-associated HIV-1 DNA (CA-DNA) after activation of resting CD4+ T cells. Changes in CA-DNA levels after activation are shown relative to the levels seen before activation. (A) Spearman correlation between HIV-1 virion production and change in CA-DNA levels in wells with detectable HIV-1 RNA (ρ = 0.476; P value = 0.03). (B) Change in CA-DNA levels for nonproducer wells (<1 copy HIV-1 RNA), low-producer wells (≤200 copies HIV-1 RNA), and high-producer wells (>200 copies HIV-1 RNA); horizontal lines reflect the median; statistical significance was tested with the Mann-Whitney U test with a Bonferroni correction. NS, = not significant; *, P < 0.05; **, P < 0.01.
Interpretation of changes in CA-DNA levels is complicated, however, because wells with single induced proviruses contained multiple noninduced proviruses. Specifically, an average of 144 HIV-1 DNA copies were seeded per well. Although the majority (up to 98.5%) of proviruses are not inducible (1, 14), levels of both induced and noninduced proviruses can expand following activation. Hence, the association between CA-DNA level increases and higher virion production may arise from (i) selective proliferation of induced proviruses, (ii) proliferation of noninduced proviruses, or (iii) proliferation of both induced and noninduced proviruses. Because CA-DNA increases were observed only in wells with high virion production (Fig. 4B), proliferation of induced proviruses could well have played a role.
Variable expansion of provirus levels may be attributable to differences in proviral integration sites and in infected T-cell subsets. Certain integration sites may promote survival and cellular proliferation, as observed in vivo (15, 16). In addition, HIV-1 proviruses can be found across many T-cell subsets (17, 18), which vary in proliferative and apoptotic potential (19). Virion production may also vary as a result of differences in proviral transcription. Integrations in inducible genes could contribute to higher levels of virion production, but could also lead to lower virion production from transcriptional interference (15, 20, 21). Epigenetic modifications that promote or inhibit HIV-1 transcription (22) may differ between individual infected cells. Cells may also possess variable amounts of key transcription factors (e.g., P-TEFB, NF-κB) (23). Finally, differential expression of inhibitory receptors (24) and cytokines (25) may limit T-cell activation and HIV-1 transcription. Detailed single-cell analyses are required to differentiate among these mechanisms of cell proliferation and virion production.
In summary, analysis of single inducible proviruses reveals that levels of induced virion production can vary by 100,000-fold. Given the wide range of virion production following latency reversal, results obtained from bulk cell cultures should be interpreted with caution. Detailed single-cell analyses are needed to investigate the mechanisms that contribute to the wide variation in virion production and cellular proliferation following activation.
ACKNOWLEDGMENTS
We thank the volunteers for participating in this study. We thank Roche Diagnostics for providing Cobas AmpliPrep/TaqMan kits.
REFERENCES
- 1.Cillo AR, Sobolewski MD, Bosch RJ, Fyne E, Piatak M Jr, Coffin JM, Mellors JW. 2014. Quantification of HIV-1 latency reversal in resting CD4+ T cells from patients on suppressive antiretroviral therapy. Proc Natl Acad Sci U S A 111:7078–7083. doi: 10.1073/pnas.1402873111. [DOI] [PMC free article] [PubMed] [Google Scholar]
- 2.Wei DG, Chiang V, Fyne E, Balakrishnan M, Barnes T, Graupe M, Hesselgesser J, Irrinki A, Murry JP, Stepan G, Stray KM, Tsai A, Yu H, Spindler J, Kearney M, Spina CA, McMahon D, Lalezari J, Sloan D, Mellors J, Geleziunas R, Cihlar T. 2014. Histone deacetylase inhibitor romidepsin induces HIV expression in CD4 T cells from patients on suppressive antiretroviral therapy at concentrations achieved by clinical dosing. PLoS Pathog 10:e1004071. doi: 10.1371/journal.ppat.1004071. [DOI] [PMC free article] [PubMed] [Google Scholar]
- 3.Laird GM, Eisele EE, Rabi SA, Lai J, Chioma S, Blankson JN, Siliciano JD, Siliciano RF. 2013. Rapid quantification of the latent reservoir for HIV-1 using a viral outgrowth assay. PLoS Pathog 9:e1003398. doi: 10.1371/journal.ppat.1003398. [DOI] [PMC free article] [PubMed] [Google Scholar]
- 4.Bruner KM, Hosmane NN, Siliciano RF. 2015. Towards an HIV-1 cure: measuring the latent reservoir. Trends Microbiol 23:192–203. doi: 10.1016/j.tim.2015.01.013. [DOI] [PMC free article] [PubMed] [Google Scholar]
- 5.Althaus CL, Joos B, Perelson AS, Gunthard HF. 2014. Quantifying the turnover of transcriptional subclasses of HIV-1-infected cells. PLoS Comput Biol 10:e1003871. doi: 10.1371/journal.pcbi.1003871. [DOI] [PMC free article] [PubMed] [Google Scholar]
- 6.O'Connell KA, Rabi SA, Siliciano RF, Blankson JN. 2011. CD4+ T cells from elite suppressors are more susceptible to HIV-1 but produce fewer virions than cells from chronic progressors. Proc Natl Acad Sci U S A 108:E689–E698. doi: 10.1073/pnas.1108866108. [DOI] [PMC free article] [PubMed] [Google Scholar]
- 7.Chen HY, Di Mascio M, Perelson AS, Ho DD, Zhang L. 2007. Determination of virus burst size in vivo using a single-cycle SIV in rhesus macaques. Proc Natl Acad Sci U S A 104:19079–19084. doi: 10.1073/pnas.0707449104. [DOI] [PMC free article] [PubMed] [Google Scholar]
- 8.Dimitrov DS, Willey RL, Sato H, Chang LJ, Blumenthal R, Martin MA. 1993. Quantitation of human immunodeficiency virus type 1 infection kinetics. J Virol 67:2182–2190. [DOI] [PMC free article] [PubMed] [Google Scholar]
- 9.Tsai WP, Conley SR, Kung HF, Garrity RR, Nara PL. 1996. Preliminary in vitro growth cycle and transmission studies of HIV-1 in an autologous primary cell assay of blood-derived macrophages and peripheral blood mononuclear cells. Virology 226:205–216. doi: 10.1006/viro.1996.0648. [DOI] [PubMed] [Google Scholar]
- 10.Cillo AR, Vagratian D, Bedison MA, Anderson EM, Kearney MF, Fyne E, Koontz D, Coffin JM, Piatak M Jr, Mellors JW. 2014. Improved single-copy assays for quantification of persistent HIV-1 viremia in patients on suppressive antiretroviral therapy. J Clin Microbiol 52:3944–3951. doi: 10.1128/JCM.02060-14. [DOI] [PMC free article] [PubMed] [Google Scholar]
- 11.Palmer S, Kearney M, Maldarelli F, Halvas EK, Bixby CJ, Bazmi H, Rock D, Falloon J, Davey RT Jr, Dewar RL, Metcalf JA, Hammer S, Mellors JW, Coffin JM. 2005. Multiple, linked human immunodeficiency virus type 1 drug resistance mutations in treatment-experienced patients are missed by standard genotype analysis. J Clin Microbiol 43:406–413. doi: 10.1128/JCM.43.1.406-413.2005. [DOI] [PMC free article] [PubMed] [Google Scholar]
- 12.Kearney M, Palmer S, Maldarelli F, Shao W, Polis MA, Mican J, Rock-Kress D, Margolick JB, Coffin JA, Mellors JW. 2008. Frequent polymorphism at drug resistance sites in HIV-1 protease and reverse transcriptase. AIDS 22:497–501. doi: 10.1097/QAD.0b013e3282f29478. [DOI] [PMC free article] [PubMed] [Google Scholar]
- 13.Cillo AR, Krishnan A, Mitsuyasu RT, McMahon DK, Li S, Rossi JJ, Zaia JA, Mellors JW. 2013. Plasma viremia and cellular HIV-1 DNA persist despite autologous hematopoietic stem cell transplantation for HIV-related lymphoma. J Acquir Immune Defic Syndr 63:438–441. doi: 10.1097/QAI.0b013e31828e6163. [DOI] [PMC free article] [PubMed] [Google Scholar]
- 14.Ho YC, Shan L, Hosmane NN, Wang J, Laskey SB, Rosenbloom DI, Lai J, Blankson JN, Siliciano JD, Siliciano RF. 2013. Replication-competent noninduced proviruses in the latent reservoir increase barrier to HIV-1 cure. Cell 155:540–551. doi: 10.1016/j.cell.2013.09.020. [DOI] [PMC free article] [PubMed] [Google Scholar]
- 15.Maldarelli F, Wu X, Su L, Simonetti FR, Shao W, Hill S, Spindler J, Ferris AL, Mellors JW, Kearney MF, Coffin JM, Hughes SH. 2014. HIV latency. Specific HIV integration sites are linked to clonal expansion and persistence of infected cells. Science 345:179–183. [DOI] [PMC free article] [PubMed] [Google Scholar]
- 16.Wagner TA, McLaughlin S, Garg K, Cheung CY, Larsen BB, Styrchak S, Huang HC, Edlefsen PT, Mullins JI, Frenkel LM. 2014. HIV latency. Proliferation of cells with HIV integrated into cancer genes contributes to persistent infection. Science 345:570–573. [DOI] [PMC free article] [PubMed] [Google Scholar]
- 17.Brenchley JM, Hill BJ, Ambrozak DR, Price DA, Guenaga FJ, Casazza JP, Kuruppu J, Yazdani J, Migueles SA, Connors M, Roederer M, Douek DC, Koup RA. 2004. T-cell subsets that harbor human immunodeficiency virus (HIV) in vivo: implications for HIV pathogenesis. J Virol 78:1160–1168. doi: 10.1128/JVI.78.3.1160-1168.2004. [DOI] [PMC free article] [PubMed] [Google Scholar]
- 18.Buzon MJ, Sun H, Li C, Shaw A, Seiss K, Ouyang Z, Martin-Gayo E, Leng J, Henrich TJ, Li JZ, Pereyra F, Zurakowski R, Walker BD, Rosenberg ES, Yu XG, Lichterfeld M. 2014. HIV-1 persistence in CD4+ T cells with stem cell-like properties. Nat Med 20:139–142. doi: 10.1038/nm.3445. [DOI] [PMC free article] [PubMed] [Google Scholar]
- 19.Mueller SN, Gebhardt T, Carbone FR, Heath WR. 2013. Memory T cell subsets, migration patterns, and tissue residence. Annu Rev Immunol 31:137–161. doi: 10.1146/annurev-immunol-032712-095954. [DOI] [PubMed] [Google Scholar]
- 20.Shan L, Yang HC, Rabi SA, Bravo HC, Shroff NS, Irizarry RA, Zhang H, Margolick JB, Siliciano JD, Siliciano RF. 2011. Influence of host gene transcription level and orientation on HIV-1 latency in a primary-cell model. J Virol 85:5384–5393. doi: 10.1128/JVI.02536-10. [DOI] [PMC free article] [PubMed] [Google Scholar]
- 21.Lenasi T, Contreras X, Peterlin BM. 2008. Transcriptional interference antagonizes proviral gene expression to promote HIV latency. Cell Host Microbe 4:123–133. doi: 10.1016/j.chom.2008.05.016. [DOI] [PMC free article] [PubMed] [Google Scholar]
- 22.Mbonye U, Karn J. 2014. Transcriptional control of HIV latency: cellular signaling pathways, epigenetics, happenstance and the hope for a cure. Virology 454–455:328–339. [DOI] [PMC free article] [PubMed] [Google Scholar]
- 23.Chakraborty AK, Das J. 2010. Pairing computation with experimentation: a powerful coupling for understanding T cell signalling. Nat Rev Immunol 10:59–71. doi: 10.1038/nri2688. [DOI] [PubMed] [Google Scholar]
- 24.Yamazaki T, Akiba H, Iwai H, Matsuda H, Aoki M, Tanno Y, Shin T, Tsuchiya H, Pardoll DM, Okumura K, Azuma M, Yagita H. 2002. Expression of programmed death 1 ligands by murine T cells and APC. J Immunol 169:5538–5545. doi: 10.4049/jimmunol.169.10.5538. [DOI] [PubMed] [Google Scholar]
- 25.Santa-Marta M, de Brito PM, Godinho-Santos A, Goncalves J. 2013. Host factors and HIV-1 replication: clinical evidence and potential therapeutic approaches. Front Immunol 4:343. [DOI] [PMC free article] [PubMed] [Google Scholar]