

See Lancaster and Hall (doi: 10.1093/awv330 ) for a scientific commentary on this article .
Large-scale functional brain interactions are likely to underlie the manifestations of childhood-onset schizophrenia. Berman et al. report decreases in coupling between sensorimotor and social-cognitive networks, associated with positive symptoms (e.g. hallucinations), and a decreased coupling in the social-cognitive network associated with negative symptoms (e.g. blunted affect).
Keywords: psychosis, schizophrenia, positive symptoms, negative symptoms, neuropsychiatry: imaging
See Lancaster and Hall (doi: 10.1093/awv330 ) for a scientific commentary on this article .
Large-scale functional brain interactions are likely to underlie the manifestations of childhood-onset schizophrenia. Berman et al. report decreases in coupling between sensorimotor and social-cognitive networks, associated with positive symptoms (e.g. hallucinations), and a decreased coupling in the social-cognitive network associated with negative symptoms (e.g. blunted affect).
Abstract
See Lancaster and Hall (doi: 10.1093/awv330 ) for a scientific commentary on this article .
Schizophrenia is increasingly recognized as a neurodevelopmental disorder with altered connectivity among brain networks. In the current study we examined large-scale network interactions in childhood-onset schizophrenia, a severe form of the disease with salient genetic and neurobiological abnormalities. Using a data-driven analysis of resting-state functional magnetic resonance imaging fluctuations, we characterized data from 19 patients with schizophrenia and 26 typically developing controls, group matched for age, sex, handedness, and magnitude of head motion during scanning. This approach identified 26 regions with decreased functional correlations in schizophrenia compared to controls. These regions were found to organize into two function-related networks, the first with regions associated with social and higher-level cognitive processing, and the second with regions involved in somatosensory and motor processing. Analyses of across- and within-network regional interactions revealed pronounced across-network decreases in functional connectivity in the schizophrenia group, as well as a set of across-network relationships with overall negative coupling indicating competitive or opponent network dynamics. Critically, across-network decreases in functional connectivity in schizophrenia predicted the severity of positive symptoms in the disorder, such as hallucinations and delusions. By contrast, decreases in functional connectivity within the social-cognitive network of regions predicted the severity of negative symptoms, such as impoverished speech and flattened affect. These results point toward the role that abnormal integration of sensorimotor and social-cognitive processing may play in the pathophysiology and symptomatology of schizophrenia.
Introduction
Schizophrenia is a debilitating psychiatric disorder characterized by delusions, hallucinations, cognitive impairment, and symptoms relating to social dysfunction. A growing body of evidence highlights two overarching hypotheses regarding the nature of this complex disorder. The first is that schizophrenia is a neurodevelopmental disorder, in which the overt clinical symptoms are preceded by alterations in brain development ( Weinberger, 1987 ; Rapoport et al. , 2005 ). The second is that schizophrenia is a disorder of dysconnectivity ( Friston and Frith, 1995 ; Andreasen et al. , 1998 ). Rather than emerging from dysfunction of discrete, localized brain regions, it is thought to result from altered interactions across distributed brain systems.
The study of childhood-onset schizophrenia, a severe phenotype of the disease defined by onset of psychosis before the age of 13, may offer insight into the neurodevelopmental and dysconnectivity models of schizophrenia. Early clinical studies have demonstrated the continuity of childhood-onset and adult-onset schizophrenia ( Beitchman, 1985 ), and anatomical imaging has replicated common findings from the adult-onset literature in the younger cohort ( Rapoport et al. , 1997 ; Giedd et al. , 1999 ; Gogtay and Thompson, 2010 ), which is less confounded by substance abuse and institutionalization ( Gordon et al. , 1994 ). In addition, certain features of childhood-onset schizophrenia may permit the identification of neurodevelopmentally relevant alterations. The disorder is associated with marked premorbid developmental delays ( Alaghband-Rad et al. , 1995 ; Addington and Rapoport, 2009 ) as well as more salient rare genetic risk ( Walsh et al. , 2008 ; Ahn et al. , 2014 a ). Longitudinal anatomical investigations suggest a spatiotemporal pattern of accelerated cortical thinning in childhood-onset schizophrenia, which ultimately includes sensorimotor, parietal, and fronto-temporal regions ( Thompson et al. , 2001 ). The study of functional brain signals in this cohort offers an opportunity to identify changes in the interactions among brain networks that accompany the salient clinical symptoms of this disease.
The introduction of resting-state functional MRI has permitted the investigation of shared temporal fluctuations across the entire brain while a participant is at rest ( Fox and Raichle, 2007 ). The correlation of spontaneous blood oxygen level-dependent signals, termed ‘functional connectivity’, is not a direct measure of anatomical connectivity but nonetheless can have consistent structure that captures functional interrelationships ( Biswal et al. , 1995 ; Power et al. , 2014 ). Resting-state studies have the critical benefit of being well tolerated by clinical populations, such as childhood-onset schizophrenia patients, for whom task-based studies are often beyond reach ( Alexander-Bloch et al. , 2010 ; Fox and Greicius, 2010 ).
Given the widespread nature of brain abnormalities associated with schizophrenia, a whole-brain analysis is needed for a comprehensive understanding of dysconnectivity. The resting-state literature in adult-onset schizophrenia suggests alterations in systems involving prefrontal cortex, including fronto-parietal, fronto-temporal, and fronto-striatal networks ( Hoffman et al. , 2011 ; Repovs et al. , 2011 ; Fornito et al. , 2013 ; Baker et al. , 2014 ; Cocchi et al. , 2014 ), as well as the predominantly limbic areas comprising the ‘default-mode’ network ( Garrity et al. , 2007 ; Whitfield-Gabrieli et al. , 2009 ). Nevertheless, the field remains without consensus on key questions, including the direction of differences, with some studies showing hypo-connectivity and others hyper-connectivity in patients compared to controls ( Bluhm et al. , 2007 ; Whitfield-Gabrieli et al. , 2009 ). In light of these discrepancies and persistent methodological concerns ( Saad et al. , 2013 ; Power et al. , 2015 ), it is critical to link functional connectivity to independent measures such as clinical symptoms. Relationships between whole-brain connectivity and behavioural symptoms have often been elusive, although a growing number of studies report associations between functional connectivity and certain clinical features (for review see Yu et al. , 2013 ).
Here we investigate whole-brain functional connectivity and its relationship to clinical features in childhood-onset schizophrenia. We performed an agnostic, data-driven search spanning every voxel in the brain ( Gotts et al. , 2012 ) to characterize connectivity differences between patients and typically-developing controls. We addressed three central questions. Are connectivity differences present among specific brain regions in childhood-onset schizophrenia? If so, what is the organization of these changes—are they homogeneous, randomly dispersed, or patterned in some meaningful way? Finally, how are differences in connectivity related to clinical symptoms?
Materials and methods
Participants
Study participants were 26 typically developing individuals between 9 and 31 years of age, and 19 individuals with childhood-onset schizophrenia between 12 and 30 years of age ( Table 1 ). Participant groups did not differ significantly in terms of age, sex ratio, or handedness (defined as reported writing hand) (all comparisons P > 0.05, Wilcoxon rank-sum test). Participants with schizophrenia were recruited nationwide and diagnosed after inpatient observation that included a medication washout. Exclusionary criteria included medical or neurological illness, substance abuse, or full-scale IQ < 70 prior to onset of psychotic symptoms (for further details, see McKenna et al. , 1994 ). Control participants were free of lifetime medical or psychiatric disorders as determined by means of clinical examination and standardized interview, and none had psychiatric illness in a first-degree relative. All patients with schizophrenia were rated by staff psychiatrists using the Scale for the Assessment of Positive Symptoms (SAPS; Andreasen, 1984 ) and Scale for the Assessment of Negative Symptoms (SANS; Andreasen, 1983 ) for quantification of symptom severity. For all but two patients (17/19), the SAPS and SANS were administered at the time of the functional MRI scans, and overall disease severity was relatively stable for the other two patients between the date of SAPS/SANS administration and scan date. All patients were receiving treatment with antipsychotic medication at the time of the study, typically clozapine. Medication doses were recorded and converted to chlorpromazine equivalents ( Woods, 2003 ) for later use in supplementary analyses of potential medication effects on the patterns of the functional MRI results. Illness duration for the schizophrenia patients was measured as the time between initial report of symptoms and the functional MRI scan date, with a mean of 9.17 years [standard deviation (SD) = 4.70 years, range = 2.53–20.83 years], although the near-perfect correlation of illness duration and age (Pearson’s r = 0.946) prevented the clear separation of this variable in analyses. Informed assent and consent were obtained from all participants and/or, when appropriate, their parent/guardian in accordance with a National Institutes of Health (NIH) Institutional Review Board approved protocol.
Table 1.
Participant demographics
| Patients with childhood-onset schizophrenia | Typically-developing control subjects | |
|---|---|---|
| Age [mean (SD)] | 19.38 (4.87) | 17.1 (4.90) |
| Sex (male:female) | 10:9 | 12:14 |
| Handedness (right: left) | 17:2 | 22:4 |
| Transient head motion [mm/TR; mean (SD)] | 0.092 (0.037) | 0.076 (0.031) |
| Sum positive symptoms [SAPS; mean (SD)] | 20.42 (18.16) | |
| Sum negative symptoms [SANS; mean (SD)] | 33.84 (24.82) |
TR = repetition time.
The schizophrenia and control groups did not differ significantly by age, sex, handedness, or transient head motion (all P > 0.13; Wilcoxon rank sum or t -test).
Functional MRI
MRI data were collected using a GE 3 T whole-body MRI scanner at the NIH Clinical Center’s Nuclear Magnetic Resonance Research Facility using standard imaging procedures. For each participant, a high-resolution T 1 -weighted anatomical image (MPRAGE) was obtained (120 axial slices, 1.2-mm slice thickness, 224 × 224 acquisition matrix). Spontaneous, slowly-fluctuating brain activity was measured during functional MRI using a gradient-echo echo-planar imaging series with whole-brain coverage while participants maintained fixation on a central cross and were instructed to lie still and rest quietly (repetition time = 2000 ms, echo time = 28 ms, flip angle = 90°, 26 axial contiguous interleaved slices per volume, 4.0-mm slice thickness, 1 mm gap, field of view = 24 cm, 64 × 64 acquisition matrix, single-voxel volume = 3.75 × 3.75 × 4.0 mm). Each resting scan lasted 5 min for a total of 150 consecutive whole-brain volumes. All echo planar imaging data were evaluated for transient head motion artefacts within the AFNI software package ( Cox, 1996 ), using the program @1dDiffMag to quantify the sharp motion magnitude over the course of the scan (in units of mm/repetition time and comparable to average Framewise Displacement over a scan; Power et al. , 2012 ). Independent measures of nuisance physiological variables (cardiac and respiration) were recorded during the resting scan for later removal. A GE 8-channel receive-only head coil was used for all scans, with a SENSE (Sensitivity Encoding) factor of 2 used to reduce gradient coil heating during the session.
Preprocessing
Preprocessing was done within AFNI ( Cox, 1996 ) using the basic ANATICOR approach ( Jo et al. , 2010 ). Briefly, the first four echo planar imaging volumes were removed, AFNI 3dDespike was used to remove large transients (due to factors such as head movement; Jo et al. , 2013 ), time series were corrected for slice-time acquisition, and all echo planar imaging volumes were co-registered with the T 1 -weighted scan to the first volume in the truncated set, then spatially blurred by a 6-mm (full-width at half-maximum) Gaussian kernel, with each voxel’s time series normalized by its temporal mean to yield units of per cent signal change. Linear regression was then used to remove motion (six motion parameters), cardiac and respiratory cycles (eight regressors for slice time 0; Glover et al. , 2000 ), and slower effects of respiration (five respiration volume per time regressors; Birn et al. , 2008 ), as well as average signal from the ventricles and a local average of white matter signal (within a radius of 20 mm centred on each voxel) calculated prior to the spatial blurring step. Fourth-order polynomial detrending was applied to all regressors and to the blurred, rescaled time series during regression. Ventricle and white matter time series were derived for each subject by segmenting the T 1 -weighted scan into grey, white, and CSF compartments using FreeSurfer ( Fischl et al. , 2002 ), and these masks were resampled to echo planar imaging resolution and eroded by one voxel to prevent partial volume effects with grey matter. With the exception of the cardiac and respiration regressors, which already incorporate time delays, delayed versions (one repetition time) of all regressors were included to allow for delayed effects of noise sources. The global signal was not used as a nuisance variable (for discussion see Murphy et al. , 2009 ; Saad et al. , 2012 , 2013 ; Gotts et al. , 2013 ; Hahamy et al. , 2014 ; Yang et al. , 2014 ), but region-level results were checked using the global correlation level (GCOR) as a nuisance covariate in group analyses ( Gotts et al. , 2013 ; Saad et al. , 2013 ), along with several other factors such as robustness to medication dosage, age, and the exclusion of left-handed participants (see Supplementary material and Supplementary Figs 1–4 ). The cleaned, blurred residual time series were then spatially normalized to the Talairach and Tournoux (1988) anatomical template for the purposes of group analyses using each subject’s anatomical scan. An index of transient head motion (AFNI’s @1dDiffMag) was calculated from each subject’s motion parameters for use as a nuisance covariate in the group-level analyses.
Functional MRI analyses
Group comparisons
After preprocessing, we conducted a whole-brain, data-driven search as in Gotts et al. (2012) for regions of interest showing connectivity differences between schizophrenia and control participants. For each participant, the average Pearson correlation of each voxel in the scan volume with all grey matter voxels (from FreeSurfer parcellation) in a whole-brain mask was calculated, yielding a measure of whole-brain functional ‘connectedness’ (see also Cole et al. , 2010 ; Salomon et al. , 2011 ). These connectedness values were then transformed to normally distributed values across participants using the Fisher’s z-transform and then compared between schizophrenia and controls using t -tests, covarying Age and transient Motion for each participant according to a basic ANCOVA approach (AFNI’s 3dttest++) ( Gotts et al. , 2013 ; Saad et al. , 2013 ; Meoded et al. , 2015 ). The resulting t -values were then thresholded at a voxel-wise alpha level of P < 0.0005 and then corrected for whole-brain comparisons to P < 0.05 using cluster size (AFNI’s AlphaSim). The stringent voxel-wise alpha was necessary to break large clusters of voxels up into smaller, more localized clusters (see Supplementary Fig. 5 for results over a range of thresholds). Twelve clusters of voxels with reduced whole-brain connectedness in the schizophrenia group survived correction, and these then served as seed regions of interest in the next step of the whole-brain search. This approach is analogous to post hoc testing following the detection of a significant main effect in an ANOVA, as the locations driving connectedness differences remain unclear without further testing. Seed tests were performed by first calculating the average time series across voxels within each of the 12 seed regions for each participant and then calculating the Pearson correlation of the seed time series with all other brain voxels. This resulted in 12 separate Pearson correlation maps for each participant, one for each seed. The correlation maps were then Fisher’s z-transformed and compared between groups with t -tests, covarying Age and Motion. Each of the 12 group seed tests was thresholded at the same voxel-wise alpha used in seed detection ( P < 0.0005) and then corrected using cluster-size for both whole-brain comparisons and the number of seeds tested (i.e. correcting each seed test to P < 0.05/12 = 0.00417, maintaining full family-wise type I error control at P < 0.05) ( Gotts et al. , 2012 ; Meoded et al. , 2015 ). As in Gotts et al. (2012) , we included any additional clusters of voxels that were present in two or more of the seed tests and had a spatial extent of at least 20 contiguous voxels. Several contiguous clusters were broken down further according to gross anatomical divisions (e.g. when a cluster spanned the left and right hemispheres due to spatial smoothing, the region was divided into separate left and right hemisphere clusters). After combining with the 12 seed regions that yielded corrected effects, this procedure resulted in a total of 26 regions of interest that participated in differences in functional connectivity between the two groups, all with reduced correlations in the schizophrenia relative to the control group.
The interrelationships among these 26 brain regions were visualized through principal component analysis (PCA) and K-Means cluster analysis applied to the region-by-region correlation matrices of the two participant groups ( Gotts et al. , 2012 , 2013 ). In brief, region-by-region correlation matrices were constructed for each participant by first averaging the cleaned time series within each of the 26 regions and then calculating the all-to-all correlation matrices, resulting in a 26 × 26 correlation matrix. These matrices were averaged across participants within each group and then further averaged across groups. For PCA, the first two principal components of the average correlation matrix were used to visualize column similarity, with near points indicating similar patterns of correlation. This method exhibited good agreement with K-Means cluster analyses applied to the same average correlation matrix when using K = 2 clusters. Elbow plots, which show the amount of variance in the matrix explained relative to the number of clusters used ( K ), also indicated that two clusters was a good trade-off of variance explained to model complexity. Cluster membership was then used to resort the rows and columns of the group-specific correlation matrices, along with the corresponding region-by-region t -tests. Two-sample t -tests between groups were conducted on the sorted region-by-region matrices, as well as one-sample t -tests for each group against a value of 0, with covariates of Age and Motion applied in both cases. The strong weighting of seed membership toward one of the two clusters (11/12 seeds occurred in Cluster 2) was further examined in supplementary analyses ( Supplementary Fig. 6 ).
Correlations with clinical measures
We evaluated the ability of functional connectivity measures within the schizophrenia group to predict behavioural measures of positive and negative symptoms, as indexed by the total SAPS and total SANS scores ( Andreasen, 1983 , 1984 ). Within the region-by-region correlation matrices for each pair of regions, the Fisher’s z-transformed resting-state correlation values across subjects were correlated (partial correlation) with both SAPS and SANS total scores, partialling Age and Motion, yielding a single partial correlation coefficient in each cell of the region-by-region matrix. Seed-based, whole-brain analyses were also conducted within the schizophrenia group using the 26 regions, thresholded voxelwise at P < 0.01 and corrected to P < 0.05/26 regions = 0.00192 using cluster size and AFNI’s AlphaSim. A more permissive voxel-wise alpha level ( P < 0.01) was chosen for these analyses, given that the magnitude of brain–behaviour correlations is rarely above an r -value of 0.5 (for discussion see Vul et al. 2009 ; Gotts et al. , 2012 ). Briefly, the seed time series for each of the 26 regions was calculated for each schizophrenia participant, was correlated with the time series in each voxel within a whole-brain mask and transformed using Fisher’s z-transform, yielding 26 whole-brain correlation maps for each participant. The partial correlation of these values in each voxel across participants with the SAPS and SANS total score was then calculated, partialling Age and Motion. Any corrected results for a given seed were then retained if they overlapped spatially with the other 25 non-seed regions.
The agreement of the overall structure of the symptom partial correlation matrices within the schizophrenia group and the group differences between schizophrenia and controls was assessed through a random permutation technique, as in Gotts et al. (2013) . For an estimate of the chance agreement of the two kinds of effects, the participants were randomly relabelled as either schizophrenia or control and the group differences (differences in the group-mean correlation values) and symptom partial correlations were recalculated for the shuffled data within the region-by-region matrix, using Pearson’s r as the measure of matrix agreement for both the original and the shuffled data. The significance level ( P -value) of matrix agreement was taken to be the percentile rank of the original agreement relative to the shuffled agreement values over 10 000 iterations.
The effect of anti-psychotic drug dosage was also evaluated on the symptom partial correlation matrices. Drug dosage in chlorpromazine equivalents ( Woods, 2003 ) was added as a nuisance covariate along with Age and Motion when testing the relationship between region-by-region functional connectivity level and SAPS/SANS scores ( Supplementary Fig. 1 ).
Statistical analyses
Detailed descriptions of each statistical analysis are provided above in the sections on functional MRI analyses. Across all analyses, functional connectivity analyses based on Pearson correlation values over time points were transformed to normally distributed values using Fisher’s z-transform to meet assumptions of t -tests, ANCOVA, and partial Pearson correlations performed for symptom severity analyses. Correction for multiple statistical comparisons was performed using Monte Carlo simulations and cluster size for brain-volume data, and using Bonferroni correction within region-by-region correlation matrices. Significance levels of agreement for group-difference and symptom correlation matrices were evaluated using permutation testing over 10 000 random permutations (shuffling participants into artificial groups).
Results
Group comparisons of functional connectivity
We investigated whole-brain network alterations in childhood-onset schizophrenia by comparing spontaneous functional MRI fluctuations from resting-state scans of 19 schizophrenia patients and 26 typically developing volunteers. Groups were matched for age, gender, and handedness ( Table 1 ). Our analysis used a whole-brain, data-driven approach in which the average correlation of each voxel’s time series with all brain voxels, termed ‘connectedness’, is compared between groups using a two-sample t -test to identify effective seed locations ( Gotts et al. , 2012 ; see also Meoded et al. , 2015 ; Song et al. , 2015 ). These locations are then used in more typical seed-based t -tests to identify the entire set of locations with differential connectivity in schizophrenia relative to controls, correcting for whole-brain comparisons and the number of seeds tested. The end result, shown in Fig. 1 , is that we identified a total of 26 brain regions of interest that had significantly lower connectivity in schizophrenia compared to controls. These regions consisted of 12 seed regions, including the middle frontal, superior temporal, precentral and postcentral gyri and subcortical foci in the putamen and cerebellum (listed in Table 2 ), as well as 14 additional non-seed regions that were identified at the point of seed testing.
Figure 1.

Regions of interest showing significant decreases in functional connectivity in childhood-onset schizophrenia patients compared to typically developing controls. Voxels are coloured by membership in the two major networks defined in Fig. 2 : a cluster dominated by social and cognitive association cortex (Cluster 1, magenta) and a cluster dominated by somatosensory and motor regions (Cluster 2, green). Results are corrected for multiple comparisons, and include both seed regions identified through voxel-wise comparisons thresholded at P < 0.0005, and non-seed regions identified as contiguous non-seed voxels that appeared in at least two of the individual seed maps (see Table 2 and ‘Materials and Methods’ section for details). Talairach coordinates indicate the axial, sagittal, and coronal slices shown in the top , middle , and bottom rows, respectively.
Table 2.
Regions of interest with decreased functional connectivity in schizophrenia compared to control
| Region number | Region of interest name | x | y | z | Number of voxels | Volume (mm 3 ) | Number of regions in seed's map | Number of seed map memberships |
|---|---|---|---|---|---|---|---|---|
| 1 | R medial frontal | 4.5 | 55.5 | 8.5 | 27 | 729 | n/a | 5 |
| 2 | L medial frontal | −10.5 | 55.5 | 8.5 | 112 | 3024 | n/a | 6 |
| 3 | R frontal pole | 25.5 | 52.5 | 17.5 | 21 | 567 | n/a | 2 |
| 4 | R IFG | 49.5 | 31.5 | 8.5 | 69 | 1863 | n/a | 4 |
| 5 | L IFG | −40.5 | 37.5 | 5.5 | 63 | 1701 | n/a | 3 |
| 6 | R DLPFC | 31.5 | 19.5 | 38.5 | 255 | 6885 | n/a | 6 |
| 7 | L DLPFC | −28.5 | 16.5 | 44.5 | 99 | 2673 | n/a | 4 |
| 8 | R posterior MTG | 52.5 | −55.5 | 11.5 | 73 | 1971 | n/a | 5 |
| 9 | L Posterior MTG | −55.5 | −49.5 | 11.5 | 104 | 2808 | 4 | 7 |
| 10 | R occipitotemporal | 46.5 | −64.5 | −9.5 | 151 | 4077 | n/a | 7 |
| 11 | L occipitotemporal | −52.5 | −43.5 | −12.5 | 152 | 4104 | n/a | 6 |
| 12 | R posterior cingulate | 4.5 | −55.5 | 29.5 | 70 | 1890 | n/a | 4 |
| 13 | L posterior cingulate | −1.5 | −58.5 | 32.5 | 179 | 4833 | n/a | 5 |
| 14 | R IPL/angular gyrus | 37.5 | −64.5 | 35.5 | 334 | 9018 | n/a | 6 |
| 15 | L IPL/angular gyrus | −40.5 | −61.5 | 35.5 | 249 | 6723 | n/a | 7 |
| 16 | L STG | −43.5 | −22.5 | −0.5 | 124 | 3348 | 3 | 4 |
| 17 | R precentral gyrus | 43.5 | −7.5 | 47.5 | 25 | 675 | 15 | 0 |
| 18 | L precentral gyrus | −37.5 | −10.5 | 44.5 | 43 | 1161 | 9 | 0 |
| 19 | R putamen | 28.5 | −7.5 | 5.5 | 65 | 1755 | 13 | 0 |
| 20 | L putamen | −25.5 | −10.5 | 8.5 | 20 | 540 | 9 | 0 |
| 21 | L SMA | −10.5 | −4.5 | 65.5 | 71 | 1917 | 17 | 1 |
| 22 | R SMA | 10.5 | −1.5 | 65.5 | 33 | 891 | 12 | 1 |
| 23 | L postcentral gyrus 1 | −16.5 | −28.5 | 44.5 | 25 | 675 | 6 | 0 |
| 24 | L postcentral gyrus 2 | −7.5 | −37.5 | 62.5 | 13 | 351 | 5 | 2 |
| 25 | R inferior cerebellum | 10.5 | −58.5 | −36.5 | 15 | 405 | 5 | 0 |
| 26 | L inferior cerebellum | −22.5 | −58.5 | −42.5 | 21 | 567 | 10 | 1 |
Region order is identical to that of matrices in Figs 2–4 where regions are grouped first by cluster (magenta, Cluster 1 at top then green, Cluster 2) and the order within each cluster is dictated by the region’s anterior-posterior location, with the exception of Region 16, which was intermediate in PCA space ( Fig. 2 ) between the two clusters. Regions in bold were seeds. x , y , and z coordinates indicate the location in Talairach space of peak statistical difference between schizophrenia and control groups (for seed regions) or the centre of mass (for non-seed regions). For seed regions, the column ‘Number of regions in seed’s map’ indicates how many of the other regions (up to 25), were found in the seed’s correlation difference map after statistical correction for multiple comparisons. For all regions, the column labeled ‘Number of seed map memberships’ indicates the number of seed maps to which the region belonged (up to 12 in the case of non-seeds and 11 in the case of seeds). R = right; L = left; IFG = inferior frontal gyrus; DLPFC = dorsolateral prefrontal cortex; MTG = middle temporal gyrus; IPL = inferior parietal lobule; SMA = supplementary motor area.
Organization of interregional relationships
We next investigated the interregional relationships of the 26 regions. For each participant, we created a region-by-region correlation matrix. These matrices were averaged across participants in each group and then pooled across groups, analysing the average matrix with PCA and K-Means clustering to determine whether any of the regions had similar patterns of correlation ( Fig. 2 ). Using a simple ‘elbow’ criterion ( Fig. 2 C), we found that a two-cluster solution was the optimal trade-off between the number of clusters and the amount of variance explained in the matrix (∼70%). The matrices in Fig. 2 D and E show each group’s average pattern of region-by-region correlation, with regions sorted according to cluster membership, along with the corresponding group t -tests having adjusted for nuisance covariates of Age and Motion ( Fig. 2 F).
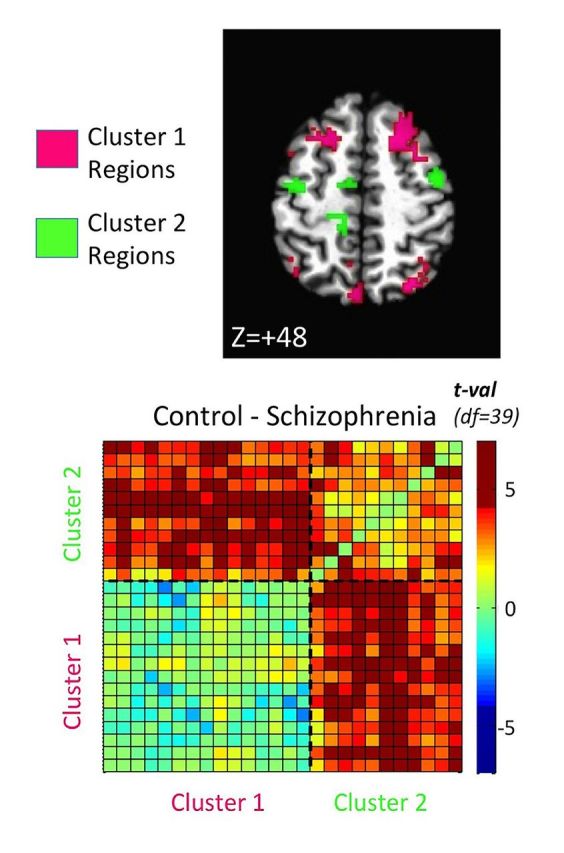
Figure 2.

Identified regions cluster into two functional networks, which show decreased across-network correlation in schizophrenia. Functional interrelationships among the detected regions, as represented in the region-by-region correlation matrices pooled across groups, were analysed by ( A ) principal component analysis (PCA), with a scatterplot constructed for the first two principal components for each region’s pattern of correlation. Analogous PCA results calculated on the corresponding group t -test matrix are shown in B . The results of K-means cluster analysis on the average correlation matrix (pooling groups) are shown using colour (magenta and green, matching Clusters 1 and 2 in Fig. 1 , respectively) in A and B . An ‘elbow’ plot constructed for K-Means cluster analysis ( C ) shows that the trade-off of variance explained versus the complexity of the cluster model (choice of K) is optimized at K = 2 clusters. Region-by-region correlation matrices sorted by cluster membership are then shown in D for controls, E for patients with schizophrenia, with the corresponding t -tests (Control-Schizophrenia) shown in F , having removed nuisance covariates of Age and Motion. The row/column order of regions of interest in the matrices is identical to those provided in Table 2 (regions 1–26 from bottom to top row and left to right column).
The region-by-region interactions revealed two salient points. First, the two clusters each represent a network of functionally related brain regions ( Table 2 ). The magenta cluster from Fig. 1 (Cluster 1) was comprised predominantly of social and cognitive association areas. These included limbic-related areas belonging to the ‘default-mode network’, such as the posterior cingulate and medial prefrontal cortex, associated with social and affective function (Carmichael and Price, 1997; Raichle et al. , 2001 ; Frith and Frith, 2007 ), as well as temporal regions involved in language and face processing ( Kanwisher and Yovel, 2006 ; Turken and Dronkers, 2011 ). Also included in Cluster 1 were higher-order association areas affiliated with working memory and executive function, including dorsolateral prefrontal and inferior parietal cortices ( Quintana and Fuster, 1999 ; Vincent et al. , 2008 ). By contrast, the green cluster (Cluster 2) was comprised predominantly of somatosensory and motor regions, including the pre- and postcentral gyri, supplementary motor area, and motor regions of the putamen and cerebellum ( Picard and Strick, 1996 ; DiMartino et al. , 2008 ; Buckner et al. , 2011 ; Zhang et al. , 2012 ).
The second salient point revealed by the region-by-region matrices is that the interaction between the two networks is altered for schizophrenia compared to controls. For each group matrix in Fig. 2 D–F, the bottom left quadrant shows region-by-region correlations within Cluster 1, and the upper right quadrant shows the correlations within Cluster 2. The upper left and lower right quadrants, which are mirror images above and below the diagonal, show the across-cluster correlations. Most of the across-cluster region pairs and those within Cluster 2 exhibited greater correlation values in controls than schizophrenic patients (Bonferroni-corrected differences shown in Fig. 2 F). In Fig. 2 D, the darker blue colours for the schizophrenia group in the across-cluster portions of the matrix indicate correlations that are relatively negative and decreased compared to the control group. We tested the presence of these negative correlations in schizophrenia statistically by conducting one-sample t -tests of the mean correlations against a value of 0 ( Fig. 3 ). For the control group, there were no significant negative correlations for any region-by-region combination ( P > 0.05, uncorrected, for all), with virtually all pairs exhibiting significant positive correlation values. For the schizophrenia group, however, numerous across-cluster correlations were negative, with five region-by-region pairs surviving Bonferroni correction over all unique inter-regional combinations. These included the left and right supplementary motor area with the right frontal pole, and the left supplementary motor area with the right dorsolateral prefrontal cortex and the left and right inferior parietal cortices overlapping the angular gyri. These negative correlations indicate that when activity is high within portions of the social-cognitive network, it is low in a subset of sensorimotor regions and vice-versa. In contrast, inter-regional coupling for the same regions in the control group was significantly positive.
Figure 3.

Functional connectivity is positive for controls but negative for select across-network regional pairs in schizophrenia. One sample t -tests of the average region-by-region correlation values against zero are provided for controls ( left ) and patients with schizophrenia ( right ). Correlation values are exclusively positive in the control group. In contrast, many across-network region-by-region pairs in the schizophrenia group have numerically negative correlation values (light blue), with a number showing significant negative correlations (both at P < 0.05, uncorrected, blue, and P < 0.05, Bonferroni-corrected, darkest blue). Row/column order of regions is identical to Fig. 2 and Table 2 .
Relationship of altered functional connectivity to clinical symptoms
Given the presence of group differences that were organized into two distinct functional networks of brain regions, we investigated the relationship between these functional connectivity alterations and clinical symptoms in schizophrenia. We separately evaluated positive symptoms, such as hallucinations and delusions, and negative symptoms, such as impoverished speech and flattened affect, using standard clinical measures (SAPS and SANS; Andreasen 1983 , 1984 ). To find out if network interactions related to symptoms, we conducted two sets of analyses on the schizophrenia data using: (i) the region-by-region matrices determined in the group comparisons; and (ii) seed-based correlations with the whole-brain from the 26 regions. For the first set of analyses, the severity of positive and negative symptoms (SAPS and SANS total scores) in the schizophrenia group was correlated with the functional connectivity values across participants in each cell of the region-by-region matrix, partialling nuisance variables of Age and magnitude of transient Motion during the scan. The results of these analyses are shown in Fig. 4 , with the results for positive symptoms shown on the left and negative symptoms on the right. For both positive and negative symptoms, the patterns of symptom correlation were in good overall agreement with the network structure of the group differences. This agreement was evaluated statistically by correlating (Pearson) the group difference (difference of r -values) and the symptom partial correlation matrices across the region-by-region combinations. Statistical significance was assessed through the use of random permutation tests (10 000 iterations) in which participants were randomly relabelled as schizophrenia and control, with the group tests, symptom correlations, and correlation between the two recalculated for the randomized data in order to derive a distribution of null values (as in Gotts et al. , 2013 ). Agreement of the group differences and symptom correlations was highly significant for both the positive symptoms ( r = −0.587, P < 0.0005) and the negative symptoms ( r = 0.564, P < 0.0033), sharing ∼30% of the total variance in the matrix values for both tests. These analyses demonstrate a basic form of validity for the group tests.
Figure 4.

Within- and across-network functional connectivity levels predict positive and negative symptoms within the schizophrenia group. Functional connectivity levels across schizophrenia participants for each region-by-region pair were correlated (partial r ) with positive symptom measures (SAPS total score, left ) and negative symptom measures (SANS total score, right ), partialling age and transient head motion magnitude during the scan. Symptom correlations agreed significantly with region-by-region network structure for both positive and negative symptoms (see main text). Small open circles indicate voxel overlap with corrected whole-brain symptom correlation results when using each of the 26 regions as a seed in seed-based analyses; these results are shown using rows to indicate seeds and columns to indicate whole-brain targets sharing voxels with the previously defined regions.
Despite the strong and significant agreement of the structure of the group-difference and symptom correlation matrices, the number of region-by-region combinations being examined (26 × 25/2 = 325 combinations) and the moderate magnitude of brain-behavioural correlations that are typically observed in neuroimaging studies (∼0.40–0.50; Vul et al. , 2009 ) resulted in failure to observe Bonferroni-corrected results for the symptom correlation analyses at individual region-by-region combinations. Cluster-size in the brain volume serves as an added dimension that could potentially permit the detection of corrected results at more typical r - and P -value thresholds, provided that voxel clusters are sufficiently large. Accordingly, we conducted a second set of analyses in order to further investigate the contribution of specific regions to symptomatology in schizophrenia. We conducted seed-based analyses of symptom correlations with the whole-brain using the 26 regions involved in the group differences. For each schizophrenia participant, whole-brain correlation maps from each of the 26 seed regions were generated and transformed to normally distributed values (Fisher’s z). For each seed, the whole-brain maps were correlated voxel-wise across participants with the SAPS and SANS total scores, partialling nuisance variables of Age and transient Motion. As with the seed-based group tests, these whole-brain symptom correlations were thresholded statistically ( P < 0.01, 2-tailed) and corrected for whole-brain comparisons and the number of seeds tested to P < 0.05 using cluster size.
This analysis revealed that positive symptoms were associated with reduced correlation strength of across-cluster interregional pairs. For positive symptoms, eight seed regions yielded significant and corrected results that overlapped spatially with 18 of the 26 regions for a total of 34 region-by-region pairs. These are rendered in axial and sagittal views in Fig. 5 A and separated by region pairs that are within Cluster 1 and Cluster 2, as well as those across networks (see also Fig. 4 ). All of these symptom correlations were negative, indicating that lower r -values predicted increased positive symptoms, consistent with the direction of the group differences (i.e. Schizophrenia < Control). The majority of these pairs occurred across clusters (23/34) and within Cluster 2 (8/34), with fewer occurring within Cluster 1 (3/34) (see Supplementary Table 2 for a complete list). Notably, three of the five region pairs showing Bonferroni-corrected negative resting-state correlations in the schizophrenia group ( Fig. 3 ) also exhibited correlations with positive symptoms (left supplementary motor area with right dorsolateral prefrontal, left inferior parietal, and right inferior parietal cortices), suggesting a possible role for this negative coupling in the generation of the positive symptoms.
Figure 5.

Anatomical and network organization of regional pairs involved in positive and negative symptom correlations. The 26 regions involved in group differences were used as seeds for each schizophrenia participant, correlating the voxel-wise functional connectivity levels across participants with positive (SAPS total score) and negative symptoms (SANS total score), partialling Age and Motion levels. Results that survived cluster-size correction for whole-brain comparisons and number of seeds tested ( P < 0.05, corrected)—and that overlapped spatially with the region of interest set—are shown for positive symptoms ( A ) and negative symptoms ( B ) by network membership: magenta lines for within the social-cognitive network, green lines for within the sensorimotor network, and black lines for across-network relationships. Solid circles indicate the anatomical locations of the 26 regions in Talairach coordinates ( x , y , and z ) using colour (magenta versus green) to denote network membership (see also Table 2 ). Left panels of A and B show top-down axial views and right panels show sagittal views from left side. Negative correlations with symptoms (weaker functional connectivity → higher symptom severity) are shown with solid lines and positive correlations with symptoms (stronger functional connectivity → higher symptom severity) are shown with dashed lines.
Negative symptoms, in contrast, appeared to be more strongly associated with decreased region-by-region correlations within Cluster 1 ( Fig. 5 B). Seven seed regions yielded significant and corrected correlations with negative symptoms that overlapped spatially with 16 of the 26 regions for a total of 25 region-by-region pairs. Fifteen of these 25 region pairs were across-cluster relationships that mostly involved the cerebellar regions, all of which had positive correlation values rather than the expected negative values (given that Schizophrenia < Control for these relationships; Fig. 5 B). However, this did not imply that participants with high negative symptom scores had unusually high functional connectivity values across clusters (i.e. greater than control). Instead, these results indicate that such participants had values closer to typical control values, undermining a strong role for the across-cluster relationships in generating negative symptoms. The 9 of 25 region pairs with negative correlations within Cluster 1 were much better candidates, involving the left and right medial frontal cortex, the right frontal pole, left and right dorsolateral prefrontal cortex, left posterior middle temporal gyrus, right occipitotemporal cortex including the fusiform gyrus, and the left posterior cingulate and inferior parietal cortex. Taken together, the results suggest that participants with high negative symptoms have a combination of relatively normal across-network correlation values and reduced correlations among Cluster 1 regions.
Discussion
In the current study we used resting-state functional MRI to examine large-scale network interactions in childhood-onset schizophrenia. We found multiple regions with decreased connectivity. These regions fell into two functionally related clusters or networks, one emphasizing social-cognitive function (Cluster 1 regions) and the other emphasizing somatosensory-motor function (Cluster 2 regions), with combinations of regions across the two networks exhibiting negative coupling in schizophrenia. We further observed a relationship between large-scale network dynamics and the positive and negative symptoms of schizophrenia, with positive symptoms primarily associated with decreased across-network coupling and negative symptoms associated with decreased coupling among social-cognitive regions. The constellation of areas with decreased connectivity in childhood-onset schizophrenia includes many regions previously identified in resting-state studies of adult schizophrenia using a priori seed-based methods as well as alternative agnostic methods such as independent component analysis. Some of these regions, most notably the prefrontal cortices, have long been recognized as candidates for dysfunction in schizophrenia based on patient studies and animal models ( Berman and Weinberger 1990 ; Goldman-Rakic and Selemon, 1997 ; Lewis and Gonzalez-Burgos 2008 ).
How do the networks observed here compare to those found in previous investigations of adult-onset schizophrenia? One of the most frequently studied resting-state networks is the ‘default mode network’, the set of regions first noted as more active during the ‘rest’ periods of task-based imaging studies ( Raichle et al. , 2001 ). This network includes the posterior cingulate and medial prefrontal cortices as key nodes, and is frequently found to have altered functional connectivity in schizophrenia, although both hyper- and hypo-connectivity have been observed ( Calhoun et al. , 2009 ; Potkin and Ford, 2009 ; Karbasforoushan and Woodward, 2012 ; Whitfield-Gabrieli and Ford, 2012 ). Interestingly, in the present study these regions were clustered with higher-order association areas, such as dorsolateral prefrontal cortex, that are typically considered ‘task-positive’. These higher-order areas also appear to be affected in schizophrenia ( Calhoun et al. , 2009 ; Karbasforoushan and Woodward, 2012 ; Mukherjee et al. , 2014 ). A recent whole-brain connectivity study indicated that the fronto-parietal interactions may be especially vulnerable ( Baker et al. , 2014 ). Our results suggest that in childhood-onset schizophrenia, these fronto-parietal regions are embedded in a larger system that includes other heteromodal association areas, including limbic-related areas along the medial wall and occipitotemporal regions related to social function ( Frith and Frith, 2007 ; Michalopoulou et al. , 2008 ; Adolphs, 2009 ). Finally, of special interest with regard to the developmental trajectory of schizophrenia, recent resting-state studies in adult-onset schizophrenia suggest hyperconnectivity of the prefrontal cortex early in the course of the disease, including in unmedicated adult-onset patients ( Anticevic et al. , 2015 a , b ). Interestingly, Anticevic and colleagues (2015 b ) have suggested that this prefrontal hyperconnectivity may be preceded still earlier by a phase of hypoconnectivity. The decreased connectivity of frontal areas in our study is in promising alignment with this proposal, and illustrates the importance of considering psychiatric disorders in relation to the growing literature on neurodevelopmental changes in resting-state networks ( Satterthwaite and Baker, 2015 ).
In addition to these high-level areas, we also found that somatosensory and motor regions were central to the altered dynamics in childhood-onset schizophrenia. The highlighting of sensorimotor systems is in contrast to the frequent emphasis on dysfunction of executive and high-level association areas, which intuitively may be more related to cardinal symptoms of the disease. Sensory and motor impairments are nevertheless indicated by multiple lines of research ( Butler et al. , 2008 ; Javitt, 2009 ; Walther and Strik, 2012 ). Motor cortex, like prefrontal cortex, has lower neuronal density in schizophrenia when measured post-mortem ( Benes et al. , 1986 ) and imaging studies have shown alterations in cortical and subcortical motor areas ( Dazzan et al. , 2004 ; Honey et al. , 2005 ). Previous behavioural studies have documented motor abnormalities in anti-psychotic naïve patients ( Wolff and O’Driscoll, 1999 ; Whitty et al. , 2009 ), particularly as a neurodevelopmental sign ( Walker et al. , 1994 ). This last point warrants emphasis, as motor impairments are among the most apparent of premorbid symptoms in childhood-onset schizophrenia ( Alaghband-Rad et al. , 1995 ; Karp et al. , 2001 ). An early disruption of sensorimotor integration, as discussed further in the next section, may be fundamental to the subsequent disease.
Functional significance of negative correlations between sensorimotor and social-cognitive regions
Correlations across a subset of regions in the two clusters were found to be negative in the schizophrenia group in the current study. The implication is not that the two functional systems are simply disconnected but that they are mutually inhibitory in some way. The biological mechanisms of these altered brain dynamics are difficult to assess using blood oxygen level-dependent fluctuations, but several proposed circuit disruptions in schizophrenia may prove consistent with negative interactions between regions such as the supplementary motor area and dorsolateral prefrontal cortex. These include a disruption of inhibitory interneurons that can mediate cortico-cortical dynamics ( Lewis et al. , 2005 ) as well as alterations in thalamo-cortical circuits ( Andreasen, 1997 ; Jones, 1997 ; Woodward et al. , 2012 ; Anticevic et al. , 2014 ; see Supplementary material and Supplementary Fig. 7 ). These circuit changes are not mutually exclusive and have the potential to alter the balance of excitation and inhibition ( Lisman, 2012 ; Anticevic et al. , 2013 ), which in principle could underlie the negative functional correlations in childhood-onset schizophrenia.
What is the significance of the negative interactions between sensorimotor and social-cognitive regions and their link to positive symptoms? One speculative possibility is that they relate to deficits in predicting the consequences of one’s own actions. A long-standing hypothesis is that schizophrenia involves an impairment of corollary discharge ( Feinberg, 1978 ; Frith et al. , 2000 ; Mathalon and Ford, 2008 ; Fletcher and Frith, 2009 ). Corollary discharge, also known as efference copy, refers to the copies of motor commands that accompany each movement ( Holst and Mittelstaedt, 1950 ; Sperry, 1950 ). These corollary signals are essential for predicting the sensory consequences of self-initiated action and distinguishing them from real external events. Convergent behavioural, electrophysiological, and imaging studies show that schizophrenic patients are impaired in this self-monitoring and sensory prediction, which is thought to underlie positive symptoms involving a failure to distinguish internal and external events ( Blakemore et al. , 2000 ; Shergill et al. , 2005 , 2014 ; Mathalon and Ford, 2008 ; Simons et al. , 2010 ; Ford et al. , 2013 ; Spering et al. , 2013 ). Furthermore, sensory prediction deficits are related to delusional thinking even in healthy control populations ( Teufel et al. , 2010 ). Although the present study was not designed to capture these deficits, these data lead to the testable hypothesis that performance on a sensory prediction task will be increasingly impaired as resting-state correlations become more negative between sensorimotor and social-cognitive networks. More generally, the current findings underscore the importance of motor systems and their interaction with higher-level association areas in the aetiology of psychiatric disease.
Decreased correlations within the social-cognitive network underlie negative symptoms
In the current study, negative symptoms were associated with decreased connectivity among social-cognitive regions in Cluster 1. The negative symptoms of schizophrenia include impairments such as inappropriate or blunted affect, impoverished thought and speech, and social inattentiveness—impairments that fall largely in the domain of social cognition. The regions most closely linked to negative symptoms in our analysis are known to contribute to these functions, including medial frontal cortex, posterior cingulate cortex, posterior middle temporal gyrus, and occipitotemporal areas including the lateral aspects of the fusiform gyrus ( Frith and Frith, 2007 ; Blakemore, 2008 ; Adolphs, 2009 ). Our results suggest that negative symptoms do not emerge from dysfunction in a single region but in decreased coordination among this set of ‘social brain’ regions, an idea that complements recent connectivity studies of social cognitive deficits in schizophrenia ( Mukherjee et al. , 2014 ). An important consideration of negative symptoms is that impairments in social cognition are common in both schizophrenia and autism ( Insel and Fernauld, 2004 ). Comorbidity of autism and childhood-onset schizophrenia has been documented previously ( Rapoport et al. , 2009 ) and recent work indicates that both autism and schizophrenia risk genes are more prevalent in childhood-onset than in adult-onset schizophrenia ( Ahn et al. , 2014 b ). A direct comparison of schizophrenic and autistic individuals will therefore be an essential next step toward identifying the shared and unique neurobiological substrates in autism and schizophrenia.
Study limitations and future steps
Common confounding factors in neuroimaging studies of schizophrenia include subject motion and medication status. As described above, groups did not differ significantly in transient head motion and we further accounted for residual motion in the group-level analyses, arguing against an interpretation of the group differences or symptom correlations as an artefact of motion differences (for a recent review of motion treatment methods, see Power et al. , 2015 ). The age range of patients in our study was quite broad (12–30 years old). Nevertheless, we failed to observe strong interactions of age with diagnostic group, and the pattern of group differences was found to replicate across younger and older ages when considered separately ( Supplementary Fig. 3 ). Medication status is inherently more difficult to control for, although several lines of evidence argue against a major contribution. Recent investigations suggest that treatment with antipsychotics leads to increases in functional connectivity among cortical association areas ( Sarpal et al. , 2015 ), rather than the decreases observed here, and similar alterations appear unrelated to antipsychotic dose in other whole-brain studies ( Woodward et al. , 2012 ; Baker et al. , 2014 ; Yang et al. , 2014 ). More compellingly for the current dataset, we found that medication dosage could not account for the relationship between the pattern of region-by-region correlations and clinical symptoms. It nevertheless is vital for future work to decipher the influence of pharmacotherapy on resting-state correlations and leverage opportunities to identify effective treatment for the spectrum of clinical symptoms in schizophrenia.
A final consideration is that the present study focused on childhood-onset schizophrenia, which is a rare cohort and by definition follows a more rapid neurodevelopmental trajectory than adult-onset schizophrenia. Given that genetic abnormalities appear to be more salient in this cohort ( Walsh et al. , 2008 ; Addington and Rapoport, 2009 ; Ahn et al. , 2014 a , b ), we anticipate that functional brain phenotypes may also be distinctive. Indeed, as discussed above, some alterations in sensorimotor and social-cognitive networks have not been reported frequently in adult-onset cases. The observed network abnormalities and their relation to clinical symptoms may have been more readily detectable in our childhood-onset cohort due to the severity of the disease or to the relatively young age at which participants were studied (early to late adolescence and young adulthood). Longitudinal investigations, along with direct comparisons of childhood- and adult-onset schizophrenia ( Jiang et al. , 2015 ), will be necessary to disentangle the effects of disease onset and development. In this regard, the non-psychotic siblings of patients with childhood-onset schizophrenia comprise another group vital for further comparison. During early adolescence, childhood-onset schizophrenia siblings share transient anatomical alterations with probands ( Gogtay et al. , 2007 ) and the analysis of resting-state networks may help to elaborate the substrates of shared environmental or genetic risk for the disease ( Repovs et al. , 2011 ). Our current findings indicate that resting-state signals in childhood-onset schizophrenia can reveal profoundly altered dynamics in meaningful functional networks that predict both positive and negative symptoms. The continued study of this form of the disease, in concert with the study of well-selected comparison groups and genetic analyses, promises to refine the neurodevelopmental understanding of the complex dysfunction in schizophrenia.
Supplementary Material
Acknowledgements
The authors thank Dr Dwight Dickinson for helpful discussion, Zoe Luscher and Pete Gochman for contributions to the acquisition and management of data, and two anonymous referees for their insightful questions and comments. This study was conducted under NIH Clinical Study Protocols 03-M-0035, 13-M-0004, 08-M-0211 (ClinicalTrials.gov IDs, respectively: NCT00049738, NCT01712646, NCT00757497).
Glossary
Abbreviations
- SANS
Scale for the Assessment of Negative Symptoms
- SAPS
Scale for the Assessment of Positive Symptoms
Funding
This research was funded by the National Institute of Mental Health (NIH), Division of Intramural Research (ZIAMH002581).
Supplementary material
Supplementary material is available at Brain online.
References
- Addington AM, Rapoport JL . The genetics of childhood-onset schizophrenia: when madness strikes the prepubescent . Curr Psychiatry Rep 2009. ; 11 : 156 – 61 . [DOI] [PMC free article] [PubMed] [Google Scholar]
- Adolphs R . The social brain: neural basis of social knowledge . Annu Rev Psychol 2009. ; 60 : 693 – 716 . [DOI] [PMC free article] [PubMed] [Google Scholar]
- Ahn K, Gotay N, Andersen TM, Anvari AA, Gochman P, Lee Y, et al. . High rate of disease-related copy number variations in childhood onset schizophrenia . Mol Psychiatry 2014a. ; 19 : 568 – 72 . [DOI] [PMC free article] [PubMed] [Google Scholar]
- Ahn K, An SS, Shugart YY, Rapoport JL . Common polygenic variation and risk for childhood-onset schizophrenia . Mol Psychiatry 2014b. . Advance online publication 2014 December 16 . [DOI] [PubMed] [Google Scholar]
- Alaghband-Rad J, McKenna K, Gordon CT, Albus KE, Hamburger SD, Rumsey JM, et al. . Childhood-onset schizophrenia: the severity of premorbid course . J Am Acad Child Adolesc Psychiatry 1995. ; 34 : 1273 – 83 . [DOI] [PubMed] [Google Scholar]
- Alexander-Bloch AF, Gogtay N, Meunier D, Birn R, Clasen L, Lalonde F, et al. . Disrupted modularity and local connectivity of brain functional networks in childhood-onset schizophrenia . Front Syst Neurosci 2010. ; 4 : 147 . [DOI] [PMC free article] [PubMed] [Google Scholar]
- Andreasen NC. Scale for the assessment of negative symptoms . Iowa City: : University of Iowa; ; 1983. . [Google Scholar]
- Andreasen NC. Scale for the assessment of positive symptoms . Iowa City: : University of Iowa; ; 1984. . [Google Scholar]
- Andreasen NC . The role of the thalamus in schizophrenia . Can J Psychiatry 1997. ; 42 : 27 – 33 . [DOI] [PubMed] [Google Scholar]
- Andreasen NC, Paradiso S, O'Leary DS . “Cognitive dysmetria” as an integrative theory of schizophrenia: a dysfunction in cortical-subcortical-cerebellar circuitry? Schizophr Bull 1998. ; 24 : 203 – 18 . [DOI] [PubMed] [Google Scholar]
- Anticevic A, Cole MW, Repovs G, Savic A, Driesen NR, Yang G, et al. . Connectivity, pharmacology, and computation: toward a mechanistic understanding of neural system dysfunction in schizophrenia . Front Psychiatry 2013. ; 4 : 169 . [DOI] [PMC free article] [PubMed] [Google Scholar]
- Anticevic A, Corlett PR, Cole MW, Savic A, Gancsos M, Tang Y, et al. . N-methyl-D-aspartate receptor antagonist effects on prefrontal cortical connectivity better model early than chronic schizophrenia . Biol Psychiatry 2015a. ; 77 : 569 – 80 . [DOI] [PubMed] [Google Scholar]
- Anticevic A, Cole MW, Repovs G, Murray JD, Brumbaugh MS, Winkler AM, et al. . Characterizing thalamo-cortical disturbances in schizophrenia and bipolar illness . Cereb Cortex 2014. ; 24 : 3116 – 30 . [DOI] [PMC free article] [PubMed] [Google Scholar]
- Anticevic A, Hu X, Xiao Y, Hu J, Li F, Bi F, et al. . Early-course unmedicated schizophrenia patients exhibit elevated prefrontal connectivity associated with longitudinal change . J Neurosci 2015b. ; 35 : 267 – 86 . [DOI] [PMC free article] [PubMed] [Google Scholar]
- Baker JT, Holmes AJ, Masters GA, Yeo BT, Krienen F, Buckner RL, et al. . Disruption of cortical association networks in schizophrenia and psychotic bipolar disorder . JAMA Psychiatry 2014. ; 71 : 109 – 18 . [DOI] [PMC free article] [PubMed] [Google Scholar]
- Beitchman JH . Childhood schizophrenia. A review and comparison with adult-onset schizophrenia . Psychiatr Clin North Am 1985. ; 8 : 793 – 814 . [PubMed] [Google Scholar]
- Benes FM, Davidson J, Bird ED . Quantitative cytoarchitectural studies of the cerebral cortex of schizophrenics . Arch Gen Psychiatry 1986. ; 43 : 31 – 5 . [DOI] [PubMed] [Google Scholar]
- Berman KF, Weinberger DR . The prefrontal cortex in schizophrenia and other neuropsychiatric diseases: in vivo physiological correlates of cognitive deficits . Prog Brain Res 1990. ; 85 : 521 – 36; discussion 536–7 . [DOI] [PubMed] [Google Scholar]
- Birn RM, Smith MA, Jones TB, Bandettini PA . The respiration response function: the temporal dynamics of fMRI signal fluctuations related to changes in respiration . Neuroimage 2008. ; 40 : 644 – 54 . [DOI] [PMC free article] [PubMed] [Google Scholar]
- Biswal B, Yetkin FZ, Haughton VM, Hyde JS . Functional connectivity in the motor cortex of resting human brain using echo-planar MRI . Magn Reson Med 1995. ; 34 : 537 – 41 . [DOI] [PubMed] [Google Scholar]
- Blakemore SJ . The social brain in adolescence . Nat Rev Neurosci 2008. ; 9 : 267 – 77 . [DOI] [PubMed] [Google Scholar]
- Blakemore SJ, Smith J, Steel R, Johnstone CE, Frith CD . The perception of self-produced sensory stimuli in patients with auditory hallucinations and passivity experiences: evidence for a breakdown in self-monitoring . Psychol Med 2000. ; 30 : 1131 – 9 . [DOI] [PubMed] [Google Scholar]
- Bluhm RL, Miller J, Lanius RA, Osuch EA, Boksman K, Neufeld RW, et al. . Spontaneous low-frequency fluctuations in the BOLD signal in schizophrenic patients: anomalies in the default network . Schizophr Bull 2007. ; 33 : 1004 – 12 . [DOI] [PMC free article] [PubMed] [Google Scholar]
- Buckner RL, Krienen FM, Castellanos A, Diaz JC, Yeo BT . The organization of the human cerebellum estimated by intrinsic functional connectivity . J Neurophysiol 2011. ; 106 : 2322 – 45 . [DOI] [PMC free article] [PubMed] [Google Scholar]
- Butler PD, Silverstein SM, Dakin SC . Visual perception and its impairment in schizophrenia . Biol Psychiatry 2008. ; 64 : 40 – 7 . [DOI] [PMC free article] [PubMed] [Google Scholar]
- Calhoun VD, Eichele T, Pearlson G . Functional brain networks in schizophrenia: a review . Front Hum Neurosci 2009. ; 3 : 17 . [DOI] [PMC free article] [PubMed] [Google Scholar]
- Carmichael ST, Price JL . Limbic connections of the orbital and medial prefrontal cortex in macaque monkeys . J Comp Neurol 1995. ; 363 : 615 – 41 . [DOI] [PubMed] [Google Scholar]
- Cocchi L, Harding IH, Lord A, Pantelis C, Yucel M, Zalesky A . Disruption of structure-function coupling in the schizophrenia connectome . Neuroimage Clin 2014. ; 4 : 779 – 87 . [DOI] [PMC free article] [PubMed] [Google Scholar]
- Cole MW, Pathak S, Schneider W . Identifying the brain's most globally connected regions . Neuroimage 2010. ; 49 : 3132 – 48 . [DOI] [PubMed] [Google Scholar]
- Cox RW . AFNI: software for analysis and visualization of functional magnetic resonance neuroimages . Comput Biomed Res 1996. ; 29 : 162 – 73 . [DOI] [PubMed] [Google Scholar]
- Dazzan P, Morgan KD, Orr KG, Hutchinson G, Chitnis X, Suckling J, et al. . The structural brain correlates of neurological soft signs in AESOP first-episode psychoses study . Brain 2004. ; 127 : 143 – 53 . [DOI] [PubMed] [Google Scholar]
- Di Martino A, Scheres A, Margulies DS, Kelly AM, Uddin LQ, Shehzad Z, et al. . Functional connectivity of human striatum: a resting state FMRI study . Cereb Cortex 2008. ; 18 : 2735 – 47 . [DOI] [PubMed] [Google Scholar]
- Feinberg I . Efference copy and corollary discharge: implications for thinking and its disorders . Schizophr Bull 1978. ; 4: 636 – 40 . [DOI] [PubMed] [Google Scholar]
- Fischl B, Salat DH, Busa E, Albert M, Dieterich M, Haselgrove C, et al. . Whole brain segmentation: automated labeling of neuroanatomical structures in the human brain . Neuron 2002. ; 33 : 341 – 55 . [DOI] [PubMed] [Google Scholar]
- Fletcher PC, Frith CD . Perceiving is believing: a Bayesian approach to explaining the positive symptoms of schizophrenia . Nat Rev Neurosci 2009. ; 10 : 48 – 58 . [DOI] [PubMed] [Google Scholar]
- Ford JM, Mathalon DH, Roach BJ, Keedy SK, Reilly JL, Gershon ES, et al. . Neurophysiological evidence of corollary discharge function during vocalization in psychotic patients and their nonpsychotic first-degree relatives . Schizophr Bull 2013. ; 39 : 1272 – 80 . [DOI] [PMC free article] [PubMed] [Google Scholar]
- Fornito A, Harrison BJ, Goodby E, Dean A, Ooi C, Nathan PJ, et al. . Functional dysconnectivity of corticostriatal circuitry as a risk phenotype for psychosis . JAMA Psychiatry 2013. ; 70 : 1143 – 51 . [DOI] [PubMed] [Google Scholar]
- Fox MD, Greicius M . Clinical applications of resting state functional connectivity . Front Syst Neurosci 2010. ; 4 : 19 . [DOI] [PMC free article] [PubMed] [Google Scholar]
- Fox MD, Raichle ME . Spontaneous fluctuations in brain activity observed with functional magnetic resonance imaging . Nat Rev Neurosci 2007. ; 8 : 700 – 11 . [DOI] [PubMed] [Google Scholar]
- Friston KJ, Frith CD . Schizophrenia: a disconnection syndrome? Clin Neurosci 1995. ; 3 : 89 – 97 . [PubMed] [Google Scholar]
- Frith CD, Blakemore S, Wolpert DM . Explaining the symptoms of schizophrenia: abnormalities in the awareness of action . Brain Res Brain Res Rev 2000. ; 31 : 357 – 63 . [DOI] [PubMed] [Google Scholar]
- Frith CD, Frith U . Social cognition in humans . Curr Biol 2007. ; 17 : R724 – 32 . [DOI] [PubMed] [Google Scholar]
- Garrity AG, Pearlson GD, McKiernan K, Lloyd D, Kiehl KA, Calhoun VD . Aberrant “default mode” functional connectivity in schizophrenia . Am J Psychiatry 2007. ; 164 : 450 – 7 . [DOI] [PubMed] [Google Scholar]
- Giedd JN, Jeffries NO, Blumenthal J, Castellanos FX, Vaituzis AC, Fernandez T, et al. . Childhood-onset schizophrenia: progressive brain changes during adolescence . Biol Psychiatry 1999. ; 46 : 892 – 8 . [DOI] [PubMed] [Google Scholar]
- Glover GH, Li TQ, Ress D . Image-based method for retrospective correction of physiological motion effects in fMRI: RETROICOR . Magn Reson Med 2000. ; 44 : 162 – 7 . [DOI] [PubMed] [Google Scholar]
- Gogtay N, Greenstein D, Lenane M, Clasen L, Sharp W, Gochman P, et al. . Cortical brain development in nonpsychotic siblings of patients with childhood-onset schizophrenia . Arch Gen Psychiatry 2007. ; 64 : 772 – 80 . [DOI] [PubMed] [Google Scholar]
- Gogtay N, Thompson PM . Mapping gray matter development: implications for typical development and vulnerability to psychopathology . Brain Cogn 2010. ; 72 : 6 – 15 . [DOI] [PMC free article] [PubMed] [Google Scholar]
- Goldman-Rakic PS, Selemon LD . Functional and anatomical aspects of prefrontal pathology in schizophrenia . Schizophr Bull 1997. ; 23 : 437 – 58 . [DOI] [PubMed] [Google Scholar]
- Gordon CT, Frazier JA, McKenna K, Giedd J, Zametkin A, Zahn T, et al. . Childhood-onset schizophrenia: an NIMH study in progress . Schizophr Bull 1994. ; 20 : 697 – 712 . [DOI] [PubMed] [Google Scholar]
- Gotts SJ, Saad ZS, Jo HJ, Wallace GL, Cox RW, Martin A . The perils of global signal regression for group comparisons: a case study of Autism Spectrum Disorders . Front Hum Neurosci 2013. ; 7 : 356 . [DOI] [PMC free article] [PubMed] [Google Scholar]
- Gotts SJ, Simmons WK, Milbury LA, Wallace GL, Cox RW, Martin A . Fractionation of social brain circuits in autism spectrum disorders . Brain 2012. ; 135 : 2711 – 25 . [DOI] [PMC free article] [PubMed] [Google Scholar]
- Hahamy A, Calhoun V, Pearlson G, Harel M, Stern N, Attar F, et al. . Save the global: global signal connectivity as a tool for studying clinical populations with functional magnetic resonance imaging . Brain Connect 2014. ; 4 : 395 – 403 . [DOI] [PMC free article] [PubMed] [Google Scholar]
- Hoffman RE, Fernandez T, Pittman B, Hampson M . Elevated functional connectivity along a corticostriatal loop and the mechanism of auditory/verbal hallucinations in patients with schizophrenia . Biol Psychiatry 2011. ; 69 : 407 – 14 . [DOI] [PMC free article] [PubMed] [Google Scholar]
- Holst E, Mittelstaedt H . Das reafferenzprinzip . Naturwissenschaften 1950. ; 37 : 464 – 76 . [Google Scholar]
- Honey GD, Pomarol-Clotet E, Corlett PR, Honey RA, McKenna PJ, Bullmore ET, et al. . Functional dysconnectivity in schizophrenia associated with attentional modulation of motor function . Brain 2005. ; 128 : 2597 – 611 . [DOI] [PMC free article] [PubMed] [Google Scholar]
- Insel TR, Fernald RD . How the brain processes social information: searching for the social brain . Annu Rev Neurosci 2004. ; 27 : 697 – 722 . [DOI] [PubMed] [Google Scholar]
- Jiang L, Xu Y, Zhu X-T, Yang Z, Li H-J, Zuo X-N . Local-to-remote cortical connectivity in early- and adulthood-onset schizophrenia . Translational Psychiatry 2015. ; 5 : e566 , doi:10.1038/tp.2015.59 . [DOI] [PMC free article] [PubMed] [Google Scholar]
- Javitt DC . When doors of perception close: bottom-up models of disrupted cognition in schizophrenia . Annu Rev Clin Psychol 2009. ; 5 : 249 – 75 . [DOI] [PMC free article] [PubMed] [Google Scholar]
- Jo HJ, Gotts SJ, Reynolds RC, Bandettini PA, Martin A, Cox RW, et al. . Effective preprocessing procedures virtually eliminate distance-dependent motion artifacts in resting state fMRI . J Appl Math 2013. ; 2013 : 935154 . [DOI] [PMC free article] [PubMed] [Google Scholar]
- Jo HJ, Saad ZS, Simmons WK, Milbury LA, Cox RW . Mapping sources of correlation in resting state FMRI, with artifact detection and removal . Neuroimage 2010. ; 52 : 571 – 82 . [DOI] [PMC free article] [PubMed] [Google Scholar]
- Jones EG . Cortical development and thalamic pathology in schizophrenia . Schizophr Bull 1997. ; 23 : 483 – 501 . [DOI] [PubMed] [Google Scholar]
- Kanwisher N, Yovel G . The fusiform face area: a cortical region specialized for the perception of faces . Philos Trans R Soc Lond B Biol Sci 2006. ; 361 : 2109 – 28 . [DOI] [PMC free article] [PubMed] [Google Scholar]
- Karbasforoushan H, Woodward ND . Resting-state networks in schizophrenia . Curr Top Med Chem 2012. ; 12 : 2404 – 14 . [DOI] [PubMed] [Google Scholar]
- Karp BI, Garvey M, Jacobsen LK, Frazier JA, Hamburger SD, Bedwell JS, et al. . Abnormal neurologic maturation in adolescents with early-onset schizophrenia . Am J Psychiatry 2001. ; 158 : 118 – 22 . [DOI] [PubMed] [Google Scholar]
- Lewis DA, Gonzalez-Burgos G . Neuroplasticity of neocortical circuits in schizophrenia . Neuropsychopharmacology 2008. ; 33 : 141 – 65 . [DOI] [PubMed] [Google Scholar]
- Lewis DA, Hashimoto T, Volk DW . Cortical inhibitory neurons and schizophrenia . Nat Rev Neurosci 2005. ; 6 : 312 – 24 . [DOI] [PubMed] [Google Scholar]
- Lisman J . Excitation, inhibition, local oscillations, or large-scale loops: what causes the symptoms of schizophrenia? Curr Opin Neurobiol 2012. ; 22 : 537 – 44 . [DOI] [PMC free article] [PubMed] [Google Scholar]
- Mathalon DH, Ford JM . Corollary discharge dysfunction in schizophrenia: evidence for an elemental deficit . Clin EEG Neurosci 2008. ; 39 : 82 – 6 . [DOI] [PubMed] [Google Scholar]
- McKenna K, Gordon CT, Lenane M, Kaysen D, Fahey K, Rapoport JL . Looking for childhood-onset schizophrenia: the first 71 cases screened . J Am Acad Child Adolesc Psychiatry 1994. ; 33 : 636 – 44 . [DOI] [PubMed] [Google Scholar]
- Meoded A, Morrissette AE, Katipally R, Schanz O, Gotts SJ, Floeter MK . Cerebro-cerebellar connectivity is increased in primary lateral sclerosis . Neuroimage Clin 2015. ; 7 : 288 – 96 . [DOI] [PMC free article] [PubMed] [Google Scholar]
- Michalopoulou PG, Surguladze S, Morley LA, Giampietro VP, Murray RM, Shergill SS . Facial fear processing and psychotic symptoms in schizophrenia: functional magnetic resonance imaging study . Br J Psychiatry 2008. ; 192 : 191 – 6 . [DOI] [PubMed] [Google Scholar]
- Mukherjee P, Whalley HC, McKirdy JW, Sprengelmeyer R . Young AW, McIntoshAM, et al . Altered amygdala connectivity within the social brain in schizophrenia. Schiz Bull 2014. ; 40 : 152 – 60 . [DOI] [PMC free article] [PubMed] [Google Scholar]
- Murphy K, Birn RM, Handwerker DA, Jones TB, Bandettini PA . The impact of global signal regression on resting state correlations: are anti-correlated networks introduced? Neuroimage 2009. ; 44 : 893 – 905 . [DOI] [PMC free article] [PubMed] [Google Scholar]
- Picard N, Strick PL . Motor areas of the medial wall: a review of their location and functional activation . Cereb Cortex 1996. ; 6 : 342 – 53 . [DOI] [PubMed] [Google Scholar]
- Potkin SG, Ford JM . Widespread cortical dysfunction in schizophrenia: the FBIRN imaging consortium . Schizophr Bull 2009. ; 35 : 15 – 8 . [DOI] [PMC free article] [PubMed] [Google Scholar]
- Power JD, Barnes KA, Snyder AZ, Schlaggar BL, Petersen SE . Spurious but systematic correlations in functional connectivity MRI networks arise from subject motion . Neuroimage 2012. ; 59 : 2142 – 54 . [DOI] [PMC free article] [PubMed] [Google Scholar]
- Power JD, Schlaggar BL, Petersen SE . Studying brain organization via spontaneous fMRI signal . Neuron 2014. ; 84 : 681 – 96 . [DOI] [PMC free article] [PubMed] [Google Scholar]
- Power JD, Schlaggar BL, Petersen SE . Recent progress and outstanding issues in motion correction in resting state fMRI . Neuroimage 2015. ; 105C : 536 – 51 . [DOI] [PMC free article] [PubMed] [Google Scholar]
- Quintana J, Fuster JM . From perception to action: temporal integrative functions of prefrontal and parietal neurons . Cereb Cortex 1999. ; 9 : 213 – 21 . [DOI] [PubMed] [Google Scholar]
- Raichle ME, MacLeod AM, Snyder AZ, Powers WJ, Gusnard DA, Shulman GL . A default mode of brain function . Proc Natl Acad Sci USA 2001. ; 98 : 676 – 82 . [DOI] [PMC free article] [PubMed] [Google Scholar]
- Rapoport J, Chavez A, Greenstein D, Addington A, Gogtay N . Autism spectrum disorders and childhood-onset schizophrenia: clinical and biological contributions to a relation revisited . J Am Acad Child Adolesc Psychiatry 2009. ; 48 : 10 – 8 . [DOI] [PMC free article] [PubMed] [Google Scholar]
- Rapoport JL, Addington AM, Frangou S, Psych MR . The neurodevelopmental model of schizophrenia: update 2005 . Mol Psychiatry 2005. ; 10 : 434 – 49 . [DOI] [PubMed] [Google Scholar]
- Rapoport JL, Giedd J, Kumra S, Jacobsen L, Smith A, Lee P, et al. . Childhood-onset schizophrenia . Progressive ventricular change during adolescence. Arch Gen Psychiatry 1997. ; 54 : 897 – 903 . [DOI] [PubMed] [Google Scholar]
- Repovs G, Csernansky JG, Barch DM . Brain network connectivity in individuals with schizophrenia and their siblings . Biol Psychiatry 2011. ; 69 : 967 – 73 . [DOI] [PMC free article] [PubMed] [Google Scholar]
- Saad ZS, Gotts SJ, Murphy K, Chen G, Jo HJ, Martin A, et al. . Trouble at rest: how correlation patterns and group differences become distorted after global signal regression . Brain Connect 2012. ; 2 : 25 – 32 . [DOI] [PMC free article] [PubMed] [Google Scholar]
- Saad ZS, Reynolds RC, Jo HJ, Gotts SJ, Chen G, Martin A, et al. . Correcting brain-wide correlation differences in resting-state FMRI . Brain Connect 2013. ; 3 : 339 – 52 . [DOI] [PMC free article] [PubMed] [Google Scholar]
- Salomon R, Bleich-Cohen M, Hahamy-Dubossarsky A, Dinstien I, Weizman R, Poyurovsky M, et al. . Global functional connectivity deficits in schizophrenia depend on behavioral state . J Neurosci 2011. ; 31 : 12972 – 81 . [DOI] [PMC free article] [PubMed] [Google Scholar]
- Sarpal DK, Robinson DG, Lencz T, Argyelan M, Ikuta T, Karlsgodt K, et al. . Antipsychotic treatment and functional connectivity of the striatum in first-episode schizophrenia . JAMA Psychiatry 2015. ; 72 : 5 – 13 . [DOI] [PMC free article] [PubMed] [Google Scholar]
- Satterthwaite TD, Baker JT . How can studies of resting-state functional connectivity help us understand psychosis as a disorder of brain development? Curr Opin Neurobiol 2015. ; 30C : 85 – 91 . [DOI] [PMC free article] [PubMed] [Google Scholar]
- Shergill SS, Samson G, Bays PM, Frith CD, Wolpert DM . Evidence for sensory prediction deficits in schizophrenia . Am J Psychiatry 2005. ; 162 : 2384 – 6 . [DOI] [PubMed] [Google Scholar]
- Shergill SS, White TP, Joyce DW, Bays PM, Wolpert DM, Frith CD . Functional magnetic resonance imaging of impaired sensory prediction in schizophrenia . JAMA Psychiatry 2014. ; 71 : 28 – 35 . [DOI] [PubMed] [Google Scholar]
- Simons CJ, Tracy DK, Sanghera KK, O'Daly O, Gilleen J, Dominguez MD, et al. . Functional magnetic resonance imaging of inner speech in schizophrenia . Biol Psychiatry 2010. ; 67 : 232 – 7 . [DOI] [PubMed] [Google Scholar]
- Song S, Gotts SJ, Dayan E, Cohen LG . Practice structure improves unconscious transitional memories by increasing synchrony in a premotor network . J Cogn Neurosci 2015. : 1 – 10 . [DOI] [PubMed] [Google Scholar]
- Spering M, Dias EC, Sanchez JL, Schutz AC, Javitt DC . Efference copy failure during smooth pursuit eye movements in schizophrenia . J Neurosci 2013. ; 33 : 11779 – 87 . [DOI] [PMC free article] [PubMed] [Google Scholar]
- Sperry RW . Neural basis of the spontaneous optokinetic response produced by visual inversion . J Comp Physiol Psychol 1950. ; 43 : 482 – 9 . [DOI] [PubMed] [Google Scholar]
- Talairach J, Tournoux P . Co-planar stereotaxic atlas of the human brain. 3-Dimensional proportional system: an approach to cerebral imaging . Paris: G. Thieme; 1988. . [Google Scholar]
- Teufel C, Kingdon A, Ingram JN, Wolpert DM, Fletcher PC . Deficits in sensory prediction are related to delusional ideation in healthy individuals . Neuropsychologia 2010. ; 48 : 4169 – 72 . [DOI] [PMC free article] [PubMed] [Google Scholar]
- Thompson PM, Vidal C, Giedd JN, Gochman P, Blumenthal J, Nicolson R, et al. . Mapping adolescent brain change reveals dynamic wave of accelerated gray matter loss in very early-onset schizophrenia . Proc Natl Acad Sci USA 2001. ; 98 : 11650 – 5 . [DOI] [PMC free article] [PubMed] [Google Scholar]
- Turken AU, Dronkers NF . The neural architecture of the language comprehension network: converging evidence from lesion and connectivity analyses . Front Syst Neurosci 2011. ; 5 : 1 . [DOI] [PMC free article] [PubMed] [Google Scholar]
- Vincent JL, Kahn I, Snyder AZ, Raichle ME, Buckner RL . Evidence for a frontoparietal control system revealed by intrinsic functional connectivity . J Neurophysiol 2008. ; 100 : 3328 – 42 . [DOI] [PMC free article] [PubMed] [Google Scholar]
- Vul E, Harris C, Winkielman P, Pashler H . Puzzlingly high correlations in fMRI studies of emotion, personality, and social cognition . Persp Psychol Sci 2009. ; 4 : 274 – 90 . [DOI] [PubMed] [Google Scholar]
- Walker EF, Savoie T, Davis D . Neuromotor precursors of schizophrenia . Schizophr Bull 1994. ; 20 : 441 – 51 . [DOI] [PubMed] [Google Scholar]
- Walsh T, McClellan JM, McCarthy SE, Addington AM, Pierce SB, Cooper GM, et al. . Rare structural variants disrupt multiple genes in neurodevelopmental pathways in schizophrenia . Science 2008. ; 320 : 539 – 43 . [DOI] [PubMed] [Google Scholar]
- Walther S, Strik W . Motor symptoms and schizophrenia . Neuropsychobiology 2012. ; 66 : 77 – 92 . [DOI] [PubMed] [Google Scholar]
- Weinberger DR . Implications of normal brain development for the pathogenesis of schizophrenia . Arch Gen Psychiatry 1987. ; 44 : 660 – 9 . [DOI] [PubMed] [Google Scholar]
- Whitfield-Gabrieli S, Ford JM . Default mode network activity and connectivity in psychopathology . Annu Rev Clin Psychol 2012. ; 8 : 49 – 76 . [DOI] [PubMed] [Google Scholar]
- Whitfield-Gabrieli S, Thermenos HW, Milanovic S, Tsuang MT, Faraone SV, McCarley RW, et al. . Hyperactivity and hyperconnectivity of the default network in schizophrenia and in first-degree relatives of persons with schizophrenia . Proc Natl Acad Sci USA 2009. ; 106 : 1279 – 84 . [DOI] [PMC free article] [PubMed] [Google Scholar]
- Whitty PF, Owoeye O, Waddington JL . Neurological signs and involuntary movements in schizophrenia: intrinsic to and informative on systems pathobiology . Schizophr Bull 2009. ; 35 : 415 – 24 . [DOI] [PMC free article] [PubMed] [Google Scholar]
- Wolff AL, O'Driscoll GA . Motor deficits and schizophrenia: the evidence from neuroleptic-naive patients and populations at risk . J Psychiatry Neurosci 1999. ; 24 : 304 – 14 . [PMC free article] [PubMed] [Google Scholar]
- Woods SW . Chlorpromazine equivalent doses for the newer atypical antipsychotics . J Clin Psychiatry 2003. ; 64 : 663 – 7 . [DOI] [PubMed] [Google Scholar]
- Woodward ND, Karbasforoushan H, Heckers S . Thalamocortical dysconnectivity in schizophrenia . Am J Psychiatry 2012. ; 169 : 1092 – 9 . [DOI] [PMC free article] [PubMed] [Google Scholar]
- Yang GJ, Murray JD, Repovs G, Cole MW, Savic A, Glasser MF, et al. . Altered global brain signal in schizophrenia . Proc Natl Acad Sci USA 2014. ; 111 : 7438 – 43 . [DOI] [PMC free article] [PubMed] [Google Scholar]
- Yu Q, Sui J, Kiehl KA, Pearlson G, Calhoun VD . State-related functional integration and functional segregation brain networks in schizophrenia . Schizophr Res 2013. ; 150 : 450 – 8 . [DOI] [PMC free article] [PubMed] [Google Scholar]
- Zhang S, Ide JS, Li CS . Resting-state functional connectivity of the medial superior frontal cortex . Cereb Cortex 2012. ; 22 : 99 – 111 . [DOI] [PMC free article] [PubMed] [Google Scholar]
Associated Data
This section collects any data citations, data availability statements, or supplementary materials included in this article.