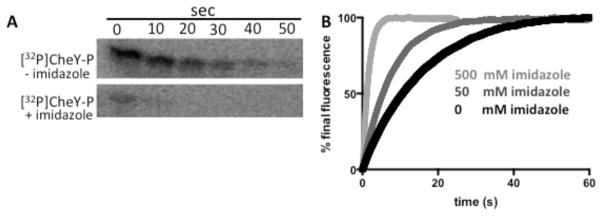
Figure 1.
CheY-P dephosphorylation kinetics in the absence and presence of imidazole. (A) Phosphorimaging scans of SDS-PAGE gels showing the time-dependent loss of 32P from [32P]CheY-P in the absence (top panel) or presence (bottom panel) of 100 mM imidazole at pH 7.5. (B) Trp fluorescence time traces showing loss of phosphoryl groups with 0 (black), 50 mM (medium gray), or 500 mM (light gray) imidazole at pH 10.3.

