

Abstract
Introduction
Blockade of the immune checkpoint programmed death receptor ligand-1 (PD-L1)/PD-1 pathway has well-established clinical activity across many tumor types. PD-L1 protein expression by immunohistochemistry (IHC) is emerging as a predictive biomarker of response to these therapies. Here, we examine PD-L1 expression in a thymic epithelial tumor (TET) tissue microarray (TMA).
Methods
The TMA contained 69 TETs and 17 thymic controls, with each case represented by triplicate cores. The TMA was stained with rabbit monoclonal antibody (clone 15, Sino Biological) to human PD-L1. PD-L1 staining was scored based on intensity as follows: 0=none, 1=equivocal/uninterpretable, 2=weak, and 3=intermediate-strong. Those cases with all cores scoring 3 in the epithelial component were categorized as PD-L1high and the remaining as PD-L1low.
Results
PD-L1high scores were more frequent in TETs than controls (68.1% vs. 17.6%, p=0.0036). PD-L1 scores and histology were significantly correlated, with higher intensity staining in WHO B2/B3/C TETs. Only 14.8% of TETs had PD-L1 staining of associated lymphocytes. In an adjusted analysis (age/gender), PD-L1high TETs had a significantly worse overall survival (HR 5.40, 95% CI 1.13-25.89, p=0.035) and a trend for worse event-free survival (HR 2.94, 95% CI 0.94-9.24, p=0.064).
Conclusions
PD-L1 expression was present in all cases of TETs within the epithelial component but only in a minority in the lymphocytic component. TETs stained more intensely for PD-L1 than controls, and PD-L1high TETs were associated with more aggressive histology and worse prognosis. This study lends rationale to a clinical trial with anti-PD1/PD-L1 therapy in this rare tumor type.
Introduction
Thymic epithelial tumors (TETs), including thymomas and thymic carcinomas, are rare, with an estimated incidence of 0.13 per 100,000 person-years in the United States.1 The origin of these tumors, the thymus, is a complex immune organ critical in the creation of T-cells that carry either αβ T-cell receptors (TCRs) or γδ TCRs.2 The thymus is essential in building the T-cell repertoire, with positive selection occurring when αβ T-cells contact peptide-major histocompatibility (MHC) complexes to produce CD4+ helper T-cells (MHC II) and CD8+ cytotoxic T-cells (MHC I). The thymus is also essential for immune homeostasis and self-tolerance via negative selection. T cells are removed when they exceed a binding threshold for the MHC-peptide complex in the thymic medulla, and natural regulatory T-cells are created via induction of transcription factor forkhead box P3 (FoxP3).3
Given the critical role of the thymus in immune function, it is not surprising that TETs are associated with autoimmune conditions like myasthenia gravis4 and pure red cell aplasia5, and a higher rate of secondary malignancies.6 These paraneoplastic conditions are associated with disruption in the balance of regulatory T-cells and effector T-cells in both the peripheral blood7 and within the tumor microenvironment.8,9 As a proof-of-concept, after thymectomy, it has been shown that this immune dysfunction improves; for example, disproportionately high levels of peripheral blood cytotoxic CD45+CD8+ T-cells implicated in autoimmunity significantly decrease.7
The interaction of programmed death receptor ligand-1 (PD-L1) and its receptor programmed death receptor-1 (PD-1) results in inhibition of the immune system.10 PD-L1 is an immune checkpoint protein that is expressed on tumor cells and tumor infiltrating immune cells (TILs) of many cancer types, with a variable impact on prognosis depending on the tumor type.11 This pathway is also being targeted for cancer immunotherapy, with clinical success seen across a variety of tumor types12 as exemplified by the recent approval of PD-1 inhibitors, nivolumab in Japan and pembrolizumab in the United States for unresectable melanoma. Expression of PD-L1 and PD-1 has been demonstrated in the thymus of both mice and humans. In mice, PD-L1 protein expression is found on the most immature double negative (CD4-CD8-) thymocyte population but not the more numerous mature double positive (CD4+CD8+) population.13 PD-L1 expression has also been found on thymic epithelial cells at the RNA and protein level.14,15 PD-1 expression in the thymus is induced at various stages of thymocyte development prior to T-cell clonal selection and is critical via its interaction with PD-L1 for the regulation of positive selection and the final T-cell repertoire.16,17 Although the PD-1/PD-L1 interaction is critical in peripheral tolerance, given its key role in positive selection, it may also play an important role in central tolerance.18,19
In a small series of TETs reported by Brown et al in 2003, PD-L1 protein expression by immunohistochemistry (IHC) was found on thymic epithelial cells in both the cortical and medullary fetal thymus and majority of non-invasive thymomas (66.7%; n=10/15), invasive thymomas (100%; n=11/11), and thymic carcinomas (87.5%; n=7/8).15 PD-L1 by IHC is emerging as a predictive biomarker for anti-PD-1 and anti-PD-L1 therapies, with an improved response rate in PD-L1 positive (PD-L1+) tumors.12 This biomarker's potential predictive ability has been demonstrated despite the retrospective nature of testing, a variety of antibodies and platforms being used for testing, and many definitions of PD-L1 positivity. PD-L1 as a biomarker is currently being validated prospectively in clinical trials.
Given the importance of PD-1 and PD-L1 within the normal thymus and the emergence of PD-L1 as a potential predictive biomarker for anti-PD-1 and anti-PD-L1 cancer immunotherapy, we examined PD-L1 expression by IHC in a TET tissue microarray (TMA).
Materials and Methods
This research was performed under an institutional review board approved protocol. Formalin-fixed, paraffin-embedded tissue samples of TETs were obtained from surgical pathology at Stanford University (Stanford, CA). A TMA was constructed from 69 TETs and 17 thymic controls (including 9 paired non-neoplastic thymuses adjacent to tumor). Two additional paired controls and two unpaired controls were not included in the analysis as insufficient tissue remained on the stained levels. To maximize the number of thymic epithelial cells, three 600-μm cores were selected from each case. These cores were generally selected from centrally located areas of the tumors. Majority of the cases had representative tissue in the TMA from initial diagnosis, except for six cases that had tissue from recurrence, including from a paravertebral mass, brain, diaphragmatic base, pleura and the remaining two from the thymus/mediastinal mass. In addition, one stage III case had representative tissue from lung secondary to direct invasion of the primary mediastinal mass. TMAs were then manufactured per standard protocol as previously described.20,21 The scoring pathologist (E.J.S.) was blinded to clinical data and sample identity. After completion of scoring, hematoxylin and eosin (H&E) stained sections were used to reclassify tumors according to the 2004 WHO classification using the original sections when available and where necessary. When a TET had a mixed histology, it was classified according to its most dominant histology. Initially, 4 μm sections of the microarray were stained with clone 5H1, a murine monoclonal antibody (mAb) to human PD-L1 (Table 1). Despite following previous guidelines on titration22, in our hands this antibody had significant non-specific staining, making meaningful scoring difficult. Thereafter, the TMA was stained with clone 15 (Sino Biological), a rabbit mAb to human PD-L1. Normal placenta was used for titration. A CK5/6 cytokeratin stain was used to aid in the localization of PD-L1 expression to epithelial cells or lymphocytes.
Table 1. Immunohistochemical Staining Protocols.
| Antibody | Clone | Dilution | Staining Conditions |
|---|---|---|---|
| PD-L1a | 5H1 (murine mAb) | 1:100 | DAKO/EDTA/Tris |
| PD-L1b | 15 (rabbit mAb) | 1:1000 | DAKO/EDTA/Tris |
| CK5/6c | D5 &16B4 (murine mAbs) | 1:50 | Leica/Leica ER2 (EDTA) |
mAb, monoclonal antibody
Yale Dr Lieping Chen
Sino Biological, Beijing, China
Cell Marque catalog number 356M-16
PD-L1 staining was scored based on intensity as follows: 0=no staining, 1=equivocal/uninterpretable staining, 2=weak staining, and 3=intermediate-strong staining. For purposes of defining PD-L1 positivity, only staining of epithelial cells was used. TETs and controls with all representative cores in the TMA scoring 3 (intermediate-strong intensity) in the epithelial component were categorized as PD-L1high and the remaining that did not fit this criterion were categorized as PD-L1low. Given the diffuse staining of PD-L1, the score was defined solely by the intensity of staining and not the threshold of percentage of cells staining positive. The PD-L1 staining intensity score used for the epithelial component was also utilized to score the lymphocytic component. In addition, the presence of tumor-associated lymphocytes (TALs) were scored based on their percentage in the core: 0=minimal, 1= < 25% lymphocytes, and 2= > 25% lymphocytes. TETs and controls were scored as Lymphhigh if all representative cores in the TMA had a score of 2 (> 25% cells), with the remaining classified as Lymphlow.
Equivocal scores due to inadequate specimens (IHC score 1) were excluded in the analysis. This means that 5 TETs and 7 controls only had evaluable PD-L1 expression in one or two representative cores. Regardless, in order to be classified as PD-L1high, all of the evaluable representative cores had to have a staining intensity of 3 within the epithelial component. A nonparametric permutation test was used to compare the PD-L1 intensity and TAL density, respectively, between TETs and controls. A paired t-test was used to compare the PD-L1 intensity between TETs and their paired adjacent non-neoplastic thymus. The Fisher's exact test or Chi-square test was used to examine the relationship between categorical variables. Event-free survival (EFS) for those cases without metastases at initial diagnosis was measured from the date of diagnosis to the date of recurrence or death of any cause. Overall survival (OS) was measured from the date of diagnosis to the date of death. Data was updated as of April 01, 2014, and patients were censored when they were last known to be alive. A proportional hazards model was used to examine outcomes of PD-L1high versus PD-L1low TETs and Lymphhigh versus Lymphlow TETs, respectively. Adjustment variables included age, gender, and Masaoka-Koga stage or WHO histology or resection status. Resection status was defined as R0 (complete), R1 (microscopic disease), and R2 (macroscopic disease). There were four cases with early pathologic Masaoka-Koga stage at diagnosis but their exact stage at diagnosis was not known, and they were excluded from any analysis that involved adjustment of stage or resection status. A larger multivariate model was not done due to limitations in sample size. A two sided p-value < 0.05 was considered statistically significant.
Results
Baseline Characteristics
There were a total of 69 cases of TETs (Table 2), with a mean patient age of 54.9 years (range 2-86), 47.8% females, 91.3% with ECOG performance status 0-1 and 36.2% who had a paraneoplastic syndrome. Pathologic Masaoka-Koga stage was predominantly early stage: 68.1% stage I-IIb, 26.1% stage III-IVb, and 5.8% unknown. Histologies were predominantly AB, B1, and B2. Majority of patients underwent a median sternotomy surgical approach (81.2%) and had a complete thymectomy (87.0%).
Table 2. Baseline Characteristics.
| Variable | n (%) |
|---|---|
|
| |
| Age, mean years | 54.9 |
| (range) | (2-86) |
|
| |
| Gender | |
| Female | 33 (47.8) |
| Male | 36 (52.2) |
|
| |
| ECOG PS | |
| 0 | 35 (50.7) |
| 1 | 28 (40.6) |
| 2 | 5 (7.2) |
| 3 | 1 (1.4) |
|
| |
| Paraneoplastic Syndrome | |
| Myasthenia Gravis | 16 (23.2) |
| Pure Red Cell Aplasia | 2 (2.9) |
| Hypogammaglobulinemia | 1 (1.4) |
| Other a | 6 (8.7) |
| None | 44 (63.8) |
|
| |
| Pathologic Masaoka Stage b | |
| I | 32 (46.4) |
| II | 15 (21.7) |
| IIA | 3 |
| IIB | 12 |
| III | 12 (17.4) |
| IV | 6 (8.7) |
| IVA | 5 |
| IVB | 1 |
| Unknown | 4 (5.8) |
|
| |
| WHO Histology c | |
| A | 8 (11.6) |
| AB | 17 (24.6) |
| B1 | 13 (18.8) |
| B2 | 20 (29.0) |
| B3 | 7 (10.1) |
| C | 4 (5.8) |
|
| |
| Chemotherapy Prior to Biopsy in TMA | 12 (17.4) |
|
| |
| Average Age of Specimen | 106.7 |
| (mo, calculated from 4/1/2014) | (26.7-209.8) |
|
| |
| Metastases at Diagnosis d | 5 (7.2) |
|
| |
| Thymectomy | |
| Unknown | 4 (5.8) |
| Partial | 5 (7.2) |
| Complete | 60 (87.0) |
|
| |
| Surgical Approach e | |
| Sternotomy | 56 (81.2) |
| Thoracotomy | 5 (7.2) |
| Transcervical | 1 (1.4) |
| VATS | 2 (2.9) |
| Hemiclamshell | 1 (1.4) |
| Unknown | 4 (5.8) |
|
| |
| Resection Status f | |
| R0 | 46 (66.7) |
| R1 | 9 (13.0) |
| R2 | 10 (14.5) |
| Unknown | 4 (5.8) |
|
| |
| Induction Chemotherapy g | 14 (20.3) |
| *all platinum-based | |
|
| |
| Adjuvant Radiation | 20 (29.0) |
ECOG PS, Eastern Cooperative Oncology Group Performance Status; mo, months; TMA=tissue microarray; VATS=video-assisted thoracoscopy
Other paraneoplastic syndromes include 1 case each of lymphocytic myocarditis, rheumatoid arthritis, minimal change nephrotic syndrome, enteropathy, dermatomyositis, and Guillain-Barre syndrome.
Initial pathologic Masaoka-Koga stage was unknown in 4 patients but these patients were known not to have metastatic disease at initial diagnosis. One stage IVA patient had a radical resection and was considered not to have metastases at diagnosis. Of the four unknown stages, all had a prolonged time from initial diagnosis to recurrence (range: 42.3-219.6 months).
A micronodular thymoma with lymphoid stroma was classified as type A; 3 classified as B1 were mixed B1/B2; 1 classified as B3 was mixed B2/B3; and 1 classified as C was mixed B3/C.
Those cases with metastases at diagnosis were all stage IV. There was one stage IV case without metastases at diagnosis because of radical resection that was performed. However, the remaining are non-metastatic stage I-III cases.
2 of the sternotomies were performed with a thoracotomy and 2 additional were performed with a VATS.
Of the R2 resections, stages were as follows: 3 IVA, 2 IVB, and 5 III. Of the R1 resections, stages were as follows: 3 IIA, 2 IIB, 3 III, and 1 IVA.
Of those cases that received induction therapy, 11 had advanced stage III-IV disease. Of those cases that received adjuvant radiation, 13 had advanced stage III-IV disease and 13 had R1 or R2 resection status.
TETs Stain Intensely and Diffusely for PD-L1, with Staining Found Mostly on Epithelial Cells and in a Minority of Tumor-Associated Lymphocytes (TALs)
The majority of PD-L1 staining was found on TET epithelial cells rather than TALs. When staining was present, in almost all cases, it was diffuse (> 50% of cells in the core). PD-L1 staining was both membranous and cytoplasmic in all cases. Only two cases had nuclear staining in addition. There were no PD-L1 intensity scores of 0 in either TETs or controls. PD-L1high scores were significantly more frequent in TETs than controls: 68.1% (n=47/69) vs. 17.6% (n=3/17), respectively (p=0.0036) (Figure 1a and 1b). There was also a trend for a higher proportion of PD-L1high scores in TETs when compared to their paired adjacent non-neoplastic thymus (p=0.09). Only 14.8% of TALs from TETs (n=8/54) (Figure 1c) and 29.4% of lymphocytes from controls (n=5/17) stained for PD-L1. In almost all cases (except one), PD-L1 intensity of TALs was weak with a score of 2. There was also no correlation between PD-L1 intensity on epithelial cells and TAL density (p=0.31).
Figure 1.
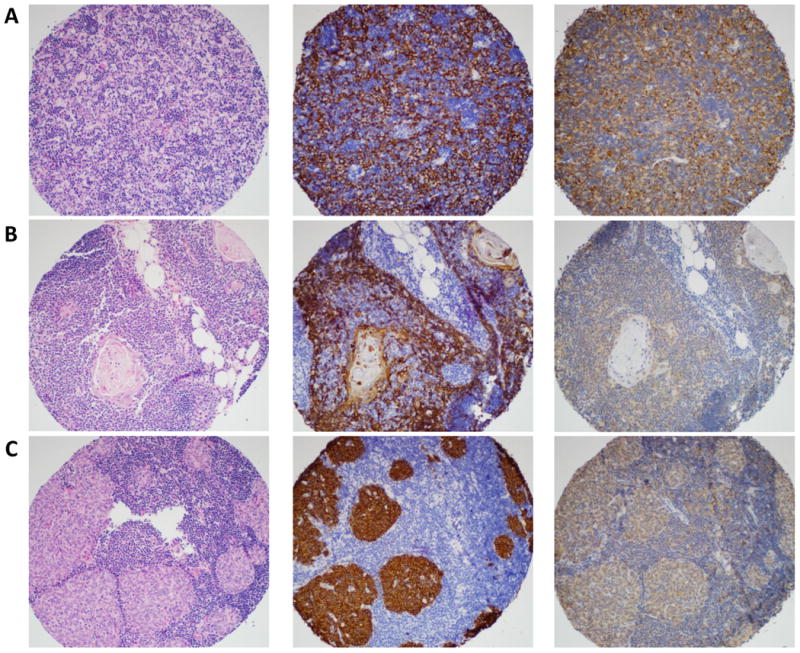
Magnification ×300. Panel A is a type B2 thymoma, Panel B is normal thymus, and Panel C is a micronodular thymoma with lymphoid stroma. Stains include H&E (left column), CK5/6 (middle column) highlighting thymic epithelial cells, and PD-L1 (right column). In panel A and B, only the epithelial cells stain for PD-L1. Panel C shows PD-L1 staining of both thymic epithelial cells and lymphocytes. Panels A, B, and C show strong (IHC 3), weak (IHC 2), and intermediate (IHC 3) PD-L1 staining, respectively.
Characteristics were examined between PD-L1high TETs and PD-L1low TETs (Table 3). There was no difference in the incidence of autoimmune disease between PD-L1high TETs and PD-L1low TETs: 40.4% (n=19/47) vs. 27.3% (n=6/22), respectively, p=0.42. Despite the vast timeframe in which tissues were acquired, there was also no difference in average age of the specimens between PD-L1high TETs and PD-L1low TETs (109.2 +/- 47.3 months vs. 101.2 +/- 52.1 months, respectively, p=0.54). There was also no association of PD-L1 score and prior chemotherapy received (p=0.31). Imbalances in demographics between PD-L1high TETs and PD-L1low TETs included older age by almost a decade in PD-L1low TETs (p=0.035). There were no statistically significant differences noted between the groups in regards to other demographic variables, site of biopsy represented in TMA (thymus versus other), surgical approach, and completeness of thymectomy. PD-L1high TETs were associated with higher stage (p=0.056), incomplete R1 or R2 resection status (p=0.053), and more aggressive histology (p=0.039) in comparison to PD-L1low TETs. This is discussed in further detail below.
Table 3. Characteristics of PD-L1high TETs versus PD-L1low TETs.
| Characteristic | PD-L1high TETs (n=47) | PD-L1low TETs (n=22) | Chi-square or Fisher's exact test |
|---|---|---|---|
|
| |||
| Age, mean years | 51.9 | 61.4 | p=0.035* |
|
| |||
| Gender | |||
| Male | 55.3% | 45.5% | p= 0.61 |
| Female | 44.7% | 54.5% | |
|
| |||
| ECOG PS | |||
| 0 | 53.2% | 45.5% | p=0.23 |
| 1 | 34.0% | 54.5% | |
| 2 | 10.6% | 0% | |
| 3 | 2.1% | 0% | |
|
| |||
| Paraneoplastic Syndrome | 40.4% | 27.3% | p=0.42 |
|
| |||
| WHO Histology | |||
| A | 4.3% | 27.3% | p=0.039* |
| AB | 21.2% | 31.8% | |
| B1 | 21.2% | 13.6% | |
| B2 | 31.9% | 22.7% | |
| B3 | 14.9% | 0% | |
| C | 6.4% | 4.5% | |
|
| |||
| Stage a | |||
| I | 38.7% | 71.5% | p=0.056+ |
| II | 27.2% | 14.3% | |
| III | 25.0% | 4.7% | |
| IV | 9.1% | 9.5% | |
|
| |||
| Resection Status a | |||
| R0 | 63.7% | 85.7% | p=0.053+ |
| R1 | 20.4% | 0% | |
| R2 | 15.9% | 14.3% | |
|
| |||
| Site of Biopsy | |||
| Thymus | 91.5% | 95.5% | p=1.00 |
| Other | 8.5% | 4.5% | |
|
| |||
| Age of Specimen, mean months | 109.2 +/- 47.3 | 101.2 +/- 52.1 | p=0.54 |
|
| |||
| Prior Chemotherapy to Biopsy in TMA | 21.3% | 9.1% | p=0.31 |
|
| |||
| Thymectomy a | |||
| Complete | 93.2% | 90.5% | p=0.66 |
| Partial | 6.8% | 9.5% | |
|
| |||
| Surgical Approach a | |||
| Median Sternotomy | 86.3% | 85.7% | p=1.00 |
| Other | 13.7% | 14.3% | |
Chi-square or Fisher's exact tests were performed to determine differences in characteristics between PD-L1high and PD-L1low TETs. Two-sided p-values < 0.05 are statistically significant and indicated by (*). Two-sided p-values < 0.1 indicate a trend for significance and are indicated by (+)
There were 4 cases that were not evaluable for the following characteristics because of unknown details at initial diagnosis including (3 PD-L1high and 1- PD-L1low): stage, resection status, completeness of thymectomy, and surgical approach. Regardless, all categories should add up to ∼100%.
More Intense PD-L1 Staining Associated with Higher Grade WHO Histologies
There was a statistically significant correlation between PD-L1 intensity and WHO histology (p=0.039). Histologies are listed in order from those with the greatest percentage of PD-L1high scores to those with the least: B3 (100%; n=7/7) > B1 (76.9 %; n=10/13) = B2 (75.0%; n=15/20) = C (75%; n=3/4) > AB (58.8%; n=10/17) > A (25%; n=2/8). There was also a statistically significant correlation with histology and stage (p<0.0001) in this cohort, with more aggressive histologies associated with stage III-IV disease: C (100%; n=4/4) > B3 (57.1%; n=4/7) > B2 (43.8%; n=7/16) > B1 (23.1%; n=3/13) > AB=A (0%). Of note, there were no type B3 and C TETs with stage I disease.
As expected, the more aggressive WHO type B3 and C histologies had worse outcomes compared to the other histologies. This translated into an EFS of 16.7 months vs. 92.3 months, respectively (age and gender adjusted HR 5.21, 95% CI 1.94-13.98, p=0.0011; EFS events: WHO B3/C, 8 events of 10 and WHO other, 15 events of 54) and an OS of 25.4 months vs. > 105.5 months, respectively (adjusted HR 7.60, 95% CI 2.34-24.66, p=0.0007; OS events: WHO B3/C, 7 events of 11 and WHO other, 8 events of 58). When additionally adjusting for stage, there was no difference in EFS between WHO type B3/C histologies versus other histologies (HR 2.03, 95% CI 0.56-7.36, p=0.28). However, there was a statistically significant worse OS (HR 6.24, 95% CI 1.55-25.07, p=0.0099).
PD-L1high TETs have a Worse Prognosis after Adjusting for Age and Gender
In an unadjusted analysis, PD-L1high versus PD-L1low TETs had no difference in EFS (HR 1.94, 95% CI 0.71-5.29, p=0.20) or OS (HR 1.14, 95% CI 0.36-3.64, p=0.83) (Figure 2). When adjusted for age and gender, PD-L1high TETs had a trend for worse EFS (HR 2.94, 95% CI 0.94-9.24, p=0.064) and a statistically significant worse OS (HR 5.40, 95% CI 1.13-25.89, p=0.035) compared to PD-L1low TETs. For OS, the most important adjustment was age (p=0.00069) and this result remained statistically significant after the case that was only 2-years of age was excluded in a sensitivity analysis. PD-L1high TETs had a trend for association with higher stage disease compared to PD-L1low TETs (Table 3; stage III-IV: 31.9% vs. 13.6%, respectively, p=0.056). When additionally adjusting for stage, PD-L1high TETs no longer had a trend for worse EFS (HR 1.15, 95% CI 0.26-5.08, p=0.86) but continued to have a trend for worse OS (HR 4.41, 95% CI 0.88-22.11, p=0.071). This indicates that PD-L1 intensity may be prognostic independent of stage, at least for OS. However, there were a limited number of events and high censoring in this retrospective cohort (EFS events: PD-L1high, 18 events of 44 and PD-L1low, 5 events of 20 and OS events: PD-L1high, 10 events of 47 and PD-L1low, 5 events of 22.).
Figure 2.
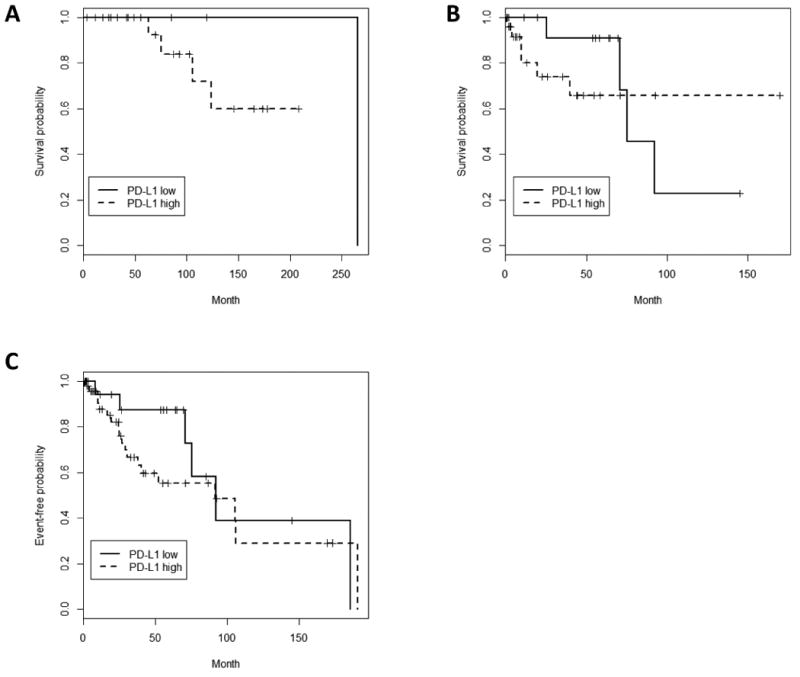
PD-L1 Intensity and Outcomes (a) Overall Survival (OS) with stratification by age < 50 years old, (b) OS with stratification by age ≥ 50 years old, (C) Event-free survival (EFS). PD-L1high TETs demonstrate no difference in EFS and OS in an unadjusted analysis. When adjusted for age and gender, PD-L1 high TETs had a statistically significant worse OS, with age being the most important adjustment. PD-L1 high TETs also had a trend for worse EFS when adjusted for age and gender, with adjustment favoring females. OS events: PD-L1high, 10 events of 47 and PD-L1low, 5 events of 22. EFS Events: PD-L1high, 18 events of 44 and PD-L1low, 5 events of 20.
In addition, PD-L1high TETs had a trend for a higher incomplete R1 or R2 resection rate compared to PD-L1low TETs (Table 3; 36.3% vs. 14.3%, respectively p=0.053). There was also a statistically significant correlation of stage and resection status in our cohort (p<0.0001), with stage III-IV disease more likely to suffer from R2 resections and stage I-II TETs having no R2 resections. Given the importance of resection status as a prognostic factor in TETs, this was built into the multivariate model. When adjusting for age, gender, and resection status, PD-L1high TETs did not have a significantly worse EFS compared to PD-L1low TETs (HR 2.05, 95% CI 0.51-8.28, p=0.32), but did have a statistically significant worse OS (HR 5.39, 95% CI 1.06-27.28, p=0.042). This indicates that PD-L1 intensity may be prognostic independent of resection status, at least for OS. Adjustment for WHO histology was not performed because of the significant correlation between PD-L1high scores and more aggressive histologies. However, since more aggressive histology was significantly correlated with stage (p<0.0001) and resection status (p<0.0001) in this cohort, adjustment for either of these variables may have attenuated the significance of the results.
We also examined the outcomes of those TETs with PD-L1+ TALs (n=8) and those without TALs (n=15) to the reference group of those with PD-L1 negative (PD-L1-) TALs (n=46). In an unadjusted analysis and an analysis adjusted for age, there was no significant difference in EFS for either TETs with PD-L1+ TALs (adjusted p=0.39) or TETs without TALs (adjusted p=0.34). In an unadjusted analysis, there was a statistically significant difference in OS, with worse OS for both those TETs with PD-L1+ TALs (HR 7.19, 95% CI 1.01-51.34, p=0.049) and those without TALs (HR 4.10, 95% CI 1.28-13.09, p=0.017). However, when adjusting for age, this difference disappeared (PD-L1+ TALs: HR 3.39, 95% CI 0.44-25.99, p=0.24 and No TALs: HR 1.39, 95% CI 0.30-6.58, p=0.68). This was most likely because age is significantly correlated with OS in our cohort and the average age between the groups differed by almost a decade: no TALs (age 67) > PD-L1+ TALs (age 57) > PD-L1- TALs (age 50). There was also no statistically significant interaction between PD-L1 staining on epithelial cells and PD-L1 staining on TALs in a proportional hazards model.
Tumor-Associated Lymphocytes (TALs) Are Not Independently Prognostic and Reflect WHO Histology
The abundance of TALs to some degree defines TET histology according to the WHO classification.23 As may be expected, there was a significant correlation between TALs and WHO histology in our cohort (p< 0.0001). Lymphhigh scores were as follows: B2 (95.0%; n=19/20) > B1 (76.9%; n=10/13) > AB (47.1%; n=8/17) > A (12.5%; n=1/8) > B3=C (0%). Also as expected, thymic controls had a higher proportion of Lymphhigh scores than TETs (94.1% vs. 55.1%, respectively, p=0.0084). In an unadjusted analysis, there was a trend for improved clinical outcomes for Lymphhigh TETs compared to Lymphlow TETs (EFS: HR 0.48, 95% CI 0.20-1.16, p=0.10; EFS events: Lymphhigh, 11 events of 34 and Lymphlow, 12 events of 30/ OS: HR 0.26, 95% CI 0.08-0.83, p=0.023; OS events: Lymphhigh , 5 events of 38 and Lymphlow, 10 events of 31). When adjusting for age, gender, and stage, this trend was attenuated (EFS: HR 0.70, 95% CI 0.26-1.88, p=0.48 and OS: HR 0.37, 95% CI 0.097-1.40, p=0.14). However, the trend disappeared after adjusting for WHO histology along with age and gender (EFS: HR 1.68, 95% CI 0.46-6.12, p=0.43 and OS: HR 1.38, 95% CI 0.27-7.17, p=0.70).
Discussion
Immune checkpoint blockade of PD-1 or PD-L1 is very promising, with activity across many tumor types including melanoma, renal cell carcinoma, and lung cancer.12,24,25 PD-L1 expression by IHC is emerging as a potential predictive marker of response to these therapies. In our study, we found diffuse PD-L1 protein expression on epithelial cells of all TETs, with higher intensity staining associated with more aggressive histologies and worse clinical outcomes. In our series, the intensity of membranous or cytoplasmic epithelial staining was most important. To our knowledge, this is the largest set of TETs examined for PD-L1 expression and the first to study the impact of PD-L1 expression on clinical outcomes in this rare tumor type. Expression of PD-L1 in TETs is intriguing because TETs are frequently associated with autoimmune conditions and immune dysfunction4,7, and in the normal thymus, the PD-1/PD-L1 interaction is critical for thymocyte selection.16,17
In our series, PD-L1high expression was a poor prognostic risk factor. This was most likely because of its significant correlation with WHO histology, with PD-L1high TETs associated with more aggressive histologies including type B3 thymomas and thymic carcinomas. This was not a perfect correlation, with type B1, B2, and C TETs containing a similar percentage of PD-L1high scores. In this cohort, PD-L1high TETs also had a trend for association with other poor prognostic features including higher stage (p=0.056) and incomplete resection status (p=0.053). In addition, more aggressive WHO histologies had a statistically significant correlation with worse pathologic Masaoka-Koga stage (p<0.0001) and incomplete resection status (p<0.0001). In the multivariate models adjusting for stage or resection status, the PD-L1 intensity score had a trend for being an independent prognostic effect, at least for overall survival.
This association with PD-L1 expression and more aggressive histology has been shown in other tumor types including non-small cell lung cancer, where those with sarcomatoid features had a higher percentage of PD-L1 expression and intensity compared to other subtypes.26 This has also been shown in sarcomatoid malignant mesothelioma27 and higher grades of bladder cancer.28 PD-L1 expression in many series has a variable impact on prognosis depending on the cancer type and the study. For example, PD-L1 expression has been associated with a poor prognosis in breast cancer29 and improved prognosis in mismatch-repair proficient colorectal cancer 30 and lung cancer.31 However, even within a cancer type, PD-L1 expression may have a contradictory impact on prognosis.32 There are currently several variables in PD-L1 testing including: 1) the type of tissue stained (i.e. formalin-fixed paraffin-embedded versus fresh tissue); 2) the quantity of sample stained (i.e. small TMA sections versus tissue blocks); 3) testing of RNA versus protein; 4) and definitions of PD-L1 positivity used. For testing of PD-L1 protein by IHC, there are also several variables, including the antibodies used and automated versus manual IHC methods. There have now been several reports of the difficulty in validating commercially available PD-L1 antibodies and even poor concordance among performance of PD-L1 antibodies within a single institution.31,33 This was confirmed in our experience. A specific limitation in our study was that only one pathologist reviewed the PD-L1 score; however, the pathologist was blinded to both clinical outcomes and sample identity.
The majority of the PD-1 and PD-L1 inhibitors in development are also co-developing a companion diagnostic test of PD-L1 by IHC, as this is emerging as a potential predictor of response to these therapies.12,34-37 The predictive ability of PD-L1 by IHC has mainly been explored in relation to objective response rate (ORR) by RECIST 1.1 criteria. For each company, there are different definitions of positivity for PD-L1 being used, including staining on tumors cells, TILs, or both along with various thresholds for percentage of positive cells and the use of different antibodies and IHC platforms. In the first reporting of the phase 1 study with nivolumab, a fully human IgG4 PD-1 inhibitor, PD-L1 (IHC) appeared to be a very promising biomarker, with no responses in PD-L1- tumors and a 36% ORR in PD-L1+ tumors.12 Since that time, responses have been also noted in PD-L1- tumors, although many studies have reported differential benefit in PD-L1+ tumors. Of note, a single definition of PD-L1 positivity may be predictive in only some tumor types34,35, and its predictive capability can vary depending if positivity is defined on tumor cells or TILs.36,37 Many of these studies suffer from examining tumors that have been pre-treated, are retrospectively collected, and only represent a subset of the cohort. Therefore, this biomarker is being validated prospectively in clinical trials. Unlike the current definitions of PD-L1 positivity being employed in clinical trials, given the diffuse staining we observed on TETs, our scoring system heavily relied on staining intensity rather than a threshold percentage of cells staining positive. Despite finding epithelial cell/tumor cell PD-L1 staining of TETs to be most important in our study, our ability to evaluate the prognostic significance of PD-L1 staining on TALs was limited by the small sample size and the high rate of censoring for survival outcomes.
Unlike other solid tumors such as ovarian and colorectal cancer where TILs have prognostic value38,39, TETs are defined histologically by their epithelial atypia and abundance of lymphocytes. Abundant lymphocytes are seen in type AB, B1, and B2 TETs and are a minor component in type A, B3, and most C TETs, with type B3 and C being more aggressive histologies.23 In our series, not surprisingly, there was a strong correlation between TALs and histology in a mostly expected distribution. TALs were not an independent prognostic feature in a proportional hazards model that adjusted for WHO histology.
Unfortunately, the standard of care in the treatment of TETs is relatively unrefined due to the rare nature of these diseases. Generally, when resectable, complete resections predict for the longest survival.40 In the locally advanced/unresectable or metastatic first-line setting, platinum-based therapies are used with palliative intent only41,42, and there has been limited utility of novel targeted therapies to date. Given the emergence of PD-L1 as a promising predictive biomarker and the diffuse staining of PD-L1 seen in TETs in our study, the next step is to conduct a clinical trial with anti-PD-1 or anti-PD-L1 therapy in this rare tumor type. Generally, anti-PD-1 and anti-PD-L1 therapies are well tolerated, with a unique side effect of immune-related adverse events (iAEs).12,24,43 However, when considering this therapy in TETs, caution should be taken given the high burden of associated autoimmune disorders such as myasthenia gravis.4
In conclusion, our study showed high PD-L1 expression in TETs, with higher staining intensity seen in TETs than controls and PD-L1high TETs associated with a worse prognosis. PD-L1 by IHC is evolving as a predictive biomarker, with various antibodies and definitions of positivity being used. Despite this variety, across many trials, PD-L1+ tumors appear to have a differential benefit with PD-1 and PD-L1 targeted immunotherapies. Further validation of this biomarker and standardization needs to be performed. However, diffuse and intense PD-L1 expression in TETs lends rationale to a trial with this therapy for this rare tumor type. Caution will need to be heeded since TETs are associated with autoimmune conditions.
Acknowledgments
The authors acknowledge Shirley S. Kwok who helped with titration of the immunohistochemistry antibodies. This work was conducted with support from the TL1 Clinical Research Training Program of the Stanford Clinical and Translational Science Award to Spectrum (NIH TL1 TR 001084) (SKP); the Stanford Cancer Institute Fellowship Award (SKP); the Stanford Translational and Applied Medicine Pilot Grant (JWR); and the National Center for Research Resources and the National Center for Advancing Translational Sciences, National Cancer Institute and National Institutes of Health through grants 5 KL2 RR025743 and 5 K12 CA 138464 (JWR). The content is solely the responsibility of the authors and does not necessarily represent the official views of the National Institutes of Health.
Footnotes
Conflicts of Interests and Sources of Funding: No COI related to this submitted work for the following authors: Sukhmani K. Padda, Jonathan W. Riess, Erich J. Schwartz, Lu Tian, Holbrook E. Kohrt, Joel W. Neal, Robert B. West, Heather A. Wakelee
Heather A. Wakelee: No disclosures in relation to this submitted work. Disclosures outside the submitted work include consultancy to Peregrine [money paid to author] and grants from Celgene, Genentech/Roche, Lilly, Pfizer, MedImmune, AstraZeneca, Novartis, BMS, Clovis, Exelixis, Regeneron, Xcovery [money paid to institution].
Joel W. Neal: No disclosures in relation to this submitted work. Disclosures outside of the submitted work include grants paid to author and/or institution [Merck, ArQule, Genentech/Roche].
References
- 1.Engels EA. Epidemiology of thymoma and associated malignancies. J Thorac Oncol. 2010;5:S260–265. doi: 10.1097/JTO.0b013e3181f1f62d. [DOI] [PMC free article] [PubMed] [Google Scholar]
- 2.Miller JF. The golden anniversary of the thymus. Nat Rev Immunol. 2011;11:489–495. doi: 10.1038/nri2993. [DOI] [PubMed] [Google Scholar]
- 3.Hsieh CS, Lee HM, Lio CW. Selection of regulatory T cells in the thymus. Nat Rev Immunol. 2012;12:157–167. doi: 10.1038/nri3155. [DOI] [PubMed] [Google Scholar]
- 4.Margaritora S, Cesario A, Cusumano G, et al. Thirty-five-year follow-up analysis of clinical and pathologic outcomes of thymoma surgery. Ann Thorac Surg. 2010;89:245–252. doi: 10.1016/j.athoracsur.2009.08.074. discussion 252. [DOI] [PubMed] [Google Scholar]
- 5.Thompson CA, Steensma DP. Pure red cell aplasia associated with thymoma: clinical insights from a 50-year single-institution experience. Br J Haematol. 2006;135:405–407. doi: 10.1111/j.1365-2141.2006.06295.x. [DOI] [PubMed] [Google Scholar]
- 6.Weksler B, Nason KS, Mackey D, et al. Thymomas and extrathymic cancers. Ann Thorac Surg. 2012;93:884–888. doi: 10.1016/j.athoracsur.2011.05.089. [DOI] [PubMed] [Google Scholar]
- 7.Hoffacker V, Schultz A, Tiesinga JJ, et al. Thymomas alter the T-cell subset composition in the blood: a potential mechanism for thymoma-associated autoimmune disease. Blood. 2000;96:3872–3879. [PubMed] [Google Scholar]
- 8.Luther C, Poeschel S, Varga M, et al. Decreased frequency of intrathymic regulatory T cells in patients with myasthenia-associated thymoma. J Neuroimmunol. 2005;164:124–128. doi: 10.1016/j.jneuroim.2005.03.011. [DOI] [PubMed] [Google Scholar]
- 9.Strobel P, Helmreich M, Menioudakis G, et al. Paraneoplastic myasthenia gravis correlates with generation of mature naive CD4(+) T cells in thymomas. Blood. 2002;100:159–166. doi: 10.1182/blood.v100.1.159. [DOI] [PubMed] [Google Scholar]
- 10.Pardoll DM. The blockade of immune checkpoints in cancer immunotherapy. Nat Rev Cancer. 2012;12:252–264. doi: 10.1038/nrc3239. [DOI] [PMC free article] [PubMed] [Google Scholar]
- 11.Taube JM, Klein AP, Brahmer JR, et al. Association of PD-1, PD-1 ligands, and other features of the tumor immune microenvironment with response to anti-PD-1 therapy. Clin Cancer Res. 2014 doi: 10.1158/1078-0432.CCR-13-3271. [Epub ahead of print] [DOI] [PMC free article] [PubMed] [Google Scholar]
- 12.Topalian SL, Hodi FS, Brahmer JR, et al. Safety, activity, and immune correlates of anti-PD-1 antibody in cancer. N Engl J Med. 2012;366:2443–2454. doi: 10.1056/NEJMoa1200690. [DOI] [PMC free article] [PubMed] [Google Scholar]
- 13.Ishida M, Iwai Y, Tanaka Y, et al. Differential expression of PD-L1 and PD-L2, ligands for an inhibitory receptor PD-1, in the cells of lymphohematopoietic tissues. Immunol Lett. 2002;84:57–62. doi: 10.1016/s0165-2478(02)00142-6. [DOI] [PubMed] [Google Scholar]
- 14.Bleul CC, Boehm T. Laser capture microdissection-based expression profiling identifies PD1-ligand as a target of the nude locus gene product. Eur J Immunol. 2001;31:2497–2503. doi: 10.1002/1521-4141(200108)31:8<2497::aid-immu2497>3.0.co;2-j. [DOI] [PubMed] [Google Scholar]
- 15.Brown JA, Dorfman DM, Ma FR, et al. Blockade of programmed death-1 ligands on dendritic cells enhances T cell activation and cytokine production. J Immunol. 2003;170:1257–1266. doi: 10.4049/jimmunol.170.3.1257. [DOI] [PubMed] [Google Scholar]
- 16.Nishimura H, Honjo T, Minato N. Facilitation of beta selection and modification of positive selection in the thymus of PD-1-deficient mice. J Exp Med. 2000;191:891–898. doi: 10.1084/jem.191.5.891. [DOI] [PMC free article] [PubMed] [Google Scholar]
- 17.Keir ME, Latchman YE, Freeman GJ, et al. Programmed death-1 (PD-1):PD-ligand 1 interactions inhibit TCR-mediated positive selection of thymocytes. J Immunol. 2005;175:7372–7379. doi: 10.4049/jimmunol.175.11.7372. [DOI] [PMC free article] [PubMed] [Google Scholar]
- 18.Tsushima F, Yao S, Shin T, et al. Interaction between B7-H1 and PD-1 determines initiation and reversal of T-cell anergy. Blood. 2007;110:180–185. doi: 10.1182/blood-2006-11-060087. [DOI] [PMC free article] [PubMed] [Google Scholar]
- 19.Zucchelli S, Holler P, Yamagata T, et al. Defective central tolerance induction in NOD mice: genomics and genetics. Immunity. 2005;22:385–396. doi: 10.1016/j.immuni.2005.01.015. [DOI] [PubMed] [Google Scholar]
- 20.Kononen J, Bubendorf L, Kallioniemi A, et al. Tissue microarrays for high-throughput molecular profiling of tumor specimens. Nat Med. 1998;4:844–847. doi: 10.1038/nm0798-844. [DOI] [PubMed] [Google Scholar]
- 21.Nielsen TO, Hsu FD, O'Connell JX, et al. Tissue microarray validation of epidermal growth factor receptor and SALL2 in synovial sarcoma with comparison to tumors of similar histology. Am J Pathol. 2003;163:1449–1456. doi: 10.1016/S0002-9440(10)63502-X. [DOI] [PMC free article] [PubMed] [Google Scholar]
- 22.Bigelow E, Bever KM, Xu H, et al. Immunohistochemical staining of B7-H1 (PD-L1) on paraffin-embedded slides of pancreatic adenocarcinoma tissue. J Vis Exp. 2013 doi: 10.3791/4059. [DOI] [PMC free article] [PubMed] [Google Scholar]
- 23.Kondo K, Yoshizawa K, Tsuyuguchi M, et al. WHO histologic classification is a prognostic indicator in thymoma. Ann Thorac Surg. 2004;77:1183–1188. doi: 10.1016/j.athoracsur.2003.07.042. [DOI] [PubMed] [Google Scholar]
- 24.Herbst RS, Gordon MS, Fine GD, et al. A study of MPDL3280A, an engineered PD-L1 antibody in patients with locally advanced or metastatic tumors. J Clin Oncol. 2013;31 (suppl; abstr 3000) [Google Scholar]
- 25.Hamid O, Robert C, Daud A, et al. Safety and tumor responses with lambrolizumab (anti-PD-1) in melanoma. N Engl J Med. 2013;369:134–144. doi: 10.1056/NEJMoa1305133. [DOI] [PMC free article] [PubMed] [Google Scholar]
- 26.Velcheti V, Rimm DL, Schalper KA. Sarcomatoid lung carcinomas show high levels of programmed death ligand-1 (PD-L1) J Thorac Oncol. 2013;8:803–805. doi: 10.1097/JTO.0b013e318292be18. [DOI] [PMC free article] [PubMed] [Google Scholar]
- 27.Mansfield AS, Roden AC, Peikert T, et al. B7-H1 Expression in Malignant Pleural Mesothelioma is Associated with Sarcomatoid Histology and Poor Prognosis. J Thorac Oncol. 2014;9:1036–1040. doi: 10.1097/JTO.0000000000000177. [DOI] [PMC free article] [PubMed] [Google Scholar]
- 28.Nakanishi J, Wada Y, Matsumoto K, et al. Overexpression of B7-H1 (PD-L1) significantly associates with tumor grade and postoperative prognosis in human urothelial cancers. Cancer Immunol Immunother. 2007;56:1173–1182. doi: 10.1007/s00262-006-0266-z. [DOI] [PMC free article] [PubMed] [Google Scholar]
- 29.Muenst S, Schaerli AR, Gao F, et al. Expression of programmed death ligand 1 (PD-L1) is associated with poor prognosis in human breast cancer. Breast Cancer Res Treat. 2014;146:15–24. doi: 10.1007/s10549-014-2988-5. [DOI] [PMC free article] [PubMed] [Google Scholar]
- 30.Droeser RA, Hirt C, Viehl CT, et al. Clinical impact of programmed cell death ligand 1 expression in colorectal cancer. Eur J Cancer. 2013;49:2233–2242. doi: 10.1016/j.ejca.2013.02.015. [DOI] [PubMed] [Google Scholar]
- 31.Velcheti V, Schalper KA, Carvajal DE, et al. Programmed death ligand-1 expression in non-small cell lung cancer. Lab Invest. 2014;94:107–116. doi: 10.1038/labinvest.2013.130. [DOI] [PMC free article] [PubMed] [Google Scholar]
- 32.Zhang Y, Wang L, Li Y, et al. Protein expression of programmed death 1 ligand 1 and ligand 2 independently predict poor prognosis in surgically resected lung adenocarcinoma. Onco Targets Ther. 2014;7:567–573. doi: 10.2147/OTT.S59959. [DOI] [PMC free article] [PubMed] [Google Scholar]
- 33.McLaughlin J, Schalper KA, Carvajal-Hausdorf DE, et al. Quantitative Measurement of PD-L1 Protein in Non-Small Cell Lung Cancer Using Different Antibodies. Presented at the IASLC 14th Annual Targeted Therapies of the Treatment of Lung Cancer Meeting; Santa Monica, CA. 2014. [Google Scholar]
- 34.Brahmer JR, Horn L, Gandhi L, et al. Nivolumab (anti-PD-1, BMS-936558, ONO-4538) in patients (pts) with advanced non-small-cell lung cancer (NSCLC): Survival and clinical activity by subgroup analysis. J Clin Oncol. 2014;32:5s. (suppl; abstr 8112ˆ) [Google Scholar]
- 35.Hodi FS, Sznol M, Kluger H, et al. Long-term survival of ipilimumab-naive patients (pts) with advanced melanoma (MEL) treated with nivolumab (anti-PD-1, BMS-936558, ONO-4538) in a phase I trial. J Clin Oncol. 2014;32:5s. (suppl; abstr 9002) [Google Scholar]
- 36.Rizvi NA, Chow LQM, Dirix LY, et al. Clinical trials of MPDL3280A (anti-PDL1) in patients (pts) with non-small cell lung cancer (NSCLC) J Clin Oncol. 2014;32:5s. (suppl; abstr TPS8123) [Google Scholar]
- 37.Powles T, Vogelzang NJ, Fine GD, et al. Inhibition of PD-L1 by MPDL3280A and clinical activity in pts with metastatic urothelial bladder cancer (UBC) J Clin Oncol. 2014;32:5s. (suppl; abstr 5011) [Google Scholar]
- 38.Zhang L, Conejo-Garcia JR, Katsaros D, et al. Intratumoral T cells, recurrence, and survival in epithelial ovarian cancer. N Engl J Med. 2003;348:203–213. doi: 10.1056/NEJMoa020177. [DOI] [PubMed] [Google Scholar]
- 39.Galon J, Costes A, Sanchez-Cabo F, et al. Type, density, and location of immune cells within human colorectal tumors predict clinical outcome. Science. 2006;313:1960–1964. doi: 10.1126/science.1129139. [DOI] [PubMed] [Google Scholar]
- 40.Detterbeck FC, Zeeshan A. Thymoma: current diagnosis and treatment. Chin Med J (Engl) 2013;126:2186–2191. [PubMed] [Google Scholar]
- 41.Loehrer PJ, Sr, Chen M, Kim K, et al. Cisplatin, doxorubicin, and cyclophosphamide plus thoracic radiation therapy for limited-stage unresectable thymoma: an intergroup trial. J Clin Oncol. 1997;15:3093–3099. doi: 10.1200/JCO.1997.15.9.3093. [DOI] [PubMed] [Google Scholar]
- 42.Lemma GL, Lee JW, Aisner SC, et al. Phase II study of carboplatin and paclitaxel in advanced thymoma and thymic carcinoma. J Clin Oncol. 2011;29:2060–2065. doi: 10.1200/JCO.2010.32.9607. [DOI] [PMC free article] [PubMed] [Google Scholar]
- 43.Topalian SL, Sznol M, McDermott DF, et al. Survival, durable tumor remission, and long-term safety in patients with advanced melanoma receiving nivolumab. J Clin Oncol. 2014;32:1020–1030. doi: 10.1200/JCO.2013.53.0105. [DOI] [PMC free article] [PubMed] [Google Scholar]