Significance
Dimerization of the RNA genome is a key event in HIV-1 virion assembly and has a strong impact in viral replication and evolution. Packaging the dimeric genome allows frequent recombination to rescue genetic information in damaged RNAs and to generate variants that can evade the host immune response or resist antiviral treatments. Furthermore, genome packaging is regulated by recognition of dimeric RNA. Our studies demonstrate that HIV-1 RNAs dimerize not in the cytoplasm but on the plasma membrane, often early during the assembly process, and that Gag protein is required for maintenance of the RNA dimer. These studies address the timing, location, and partners involved in RNA dimerization, an important process for HIV-1 replication.
Keywords: retrovirus, RNA genome, Gag–RNA complex, virus assembly, RNA-binding protein
Abstract
Retroviruses package a dimeric genome comprising two copies of the viral RNA. Each RNA contains all of the genetic information for viral replication. Packaging a dimeric genome allows the recovery of genetic information from damaged RNA genomes during DNA synthesis and promotes frequent recombination to increase diversity in the viral population. Therefore, the strategy of packaging dimeric RNA affects viral replication and viral evolution. Although its biological importance is appreciated, very little is known about the genome dimerization process. HIV-1 RNA genomes dimerize before packaging into virions, and RNA interacts with the viral structural protein Gag in the cytoplasm. Thus, it is often hypothesized that RNAs dimerize in the cytoplasm and the RNA–Gag complex is transported to the plasma membrane for virus assembly. In this report, we tagged HIV-1 RNAs with fluorescent proteins, via interactions of RNA-binding proteins and motifs in the RNA genomes, and studied their behavior at the plasma membrane by using total internal reflection fluorescence microscopy. We showed that HIV-1 RNAs dimerize not in the cytoplasm but on the plasma membrane. Dynamic interactions occur among HIV-1 RNAs, and stabilization of the RNA dimer requires Gag protein. Dimerization often occurs at an early stage of the virus assembly process. Furthermore, the dimerization process is probably mediated by the interactions of two RNA–Gag complexes, rather than two RNAs. These findings advance the current understanding of HIV-1 assembly and reveal important insights into viral replication mechanisms.
All viruses must encapsidate their genomes into virions to ensure that their genetic information is transferred to the new target cells. In most, if not all, retroviruses, the virion RNA genomes are dimeric, although each RNA encodes all of the genetic information required for replication. Most HIV-1 particles contain two copies of genomes (1), indicating that RNA encapsidation is a highly regulated process. This regulation is achieved by recognizing a dimeric RNA, and not by packaging a certain mass of viral genome (2).
Our previous studies showed that HIV-1 RNA dimerization is a critical step in viral RNA genome packaging and virus assembly and that the two copies of copackaged RNA genomes are dimerized before encapsidation (1, 3, 4). The dimerization initiation signal (DIS), a 6-nt palindromic sequence located at the 5′ UTR of the HIV-1 RNA genome (5), most likely initiates the interaction between two HIV-1 RNA genomes (3, 4). When two HIV-1 RNAs contain similar sequences including the same DIS, they are copackaged efficiently at a rate similar to that predicted from random distribution (1, 2). In contrast, when two HIV-1 RNAs contain discordant palindromic sequences that cannot form perfect base pairing, they are not copackaged efficiently into the same viral particle (1, 2). The ability of RNA genomes from different HIV-1 variants to dimerize has important biological consequences. For example, inefficient copackaging is known to be a major barrier for intersubtype HIV-1 recombination (4). Although DIS plays a key role in RNA dimerization, virion RNAs isolated from mutants with DIS deletions remained dimeric, suggesting that other cis-acting element(s) are also involved in the dimerization (6).
Despite the importance of RNA dimerization for HIV-1 replication, many aspects of this process are unknown, including the location at which dimerization occurs. Previously, we showed that RNA dimerization leading to HIV-1 genome packaging occurs after viral RNA is exported from the nucleus (7). The viral protein Gag is known to have chaperone activity (8). Additionally, biochemical experiments showed that HIV-1 Gag can interact with viral RNAs in the cytoplasm (9, 10). Thus, it is often hypothesized that two copies of HIV-1 RNAs dimerize in the cytoplasm and that this dimeric RNA is complexed with Gag and travels to the plasma membrane (7, 11–15), the major assembly site for virus assembly. The assembly of HIV-1 RNA and Gag was demonstrated in an elegant study using total internal reflection fluorescence (TIRF) microscopy (14), which illuminates a shallow volume near the glass/cell interface and is ideal for studying events near the plasma membrane (16). However, it was difficult to address the monomeric/dimeric state of the viral RNA in this previous study because the RNA was labeled with a single type of fluorescent protein.
In the present study, we sought to delineate the location at which HIV-1 RNA dimerization occurs, which leads to genome encapsidation, and whether Gag is required for RNA dimerization. We used a previously described method to label HIV-1 RNA with fluorescent proteins through interactions of sequence-specific RNA-binding proteins. We engineered HIV-1 genomes to contain RNA stem-loops that are recognized by the Escherichia coli BglG protein or the bacteriophage MS2 coat protein; because these sequences are located in the pol gene, they are present only in full-length unspliced HIV-1 RNAs. When introduced into human cells, these constructs express full-length RNAs that can serve as templates for the translation of Gag proteins and as genomes in the viral particles. Most (>90%) of the particles contain RNA genomes, indicating that the full-length viral RNAs derived from these constructs are efficiently packaged. Furthermore, RNAs derived from different constructs can dimerize and copackage at a rate close to random distribution (1), consistent with the genetic analyses from recombination studies (4, 17, 18). By using this method, we were able to detect HIV-1 RNA with single-RNA-molecule sensitivity (1) and tracked HIV-1 RNA movement in the cytoplasm by using live-cell imaging (19). In this report, we tagged two HIV-1 RNAs and Gag, each with a different fluorescent protein, and studied the RNA:RNA and RNA:Gag interactions on the plasma membrane. We found that HIV-1 RNA dimerizes on the plasma membrane and that Gag protein is required for stabilization of the dimer.
Results
Detection of Dual-Labeled HIV-1 RNA.
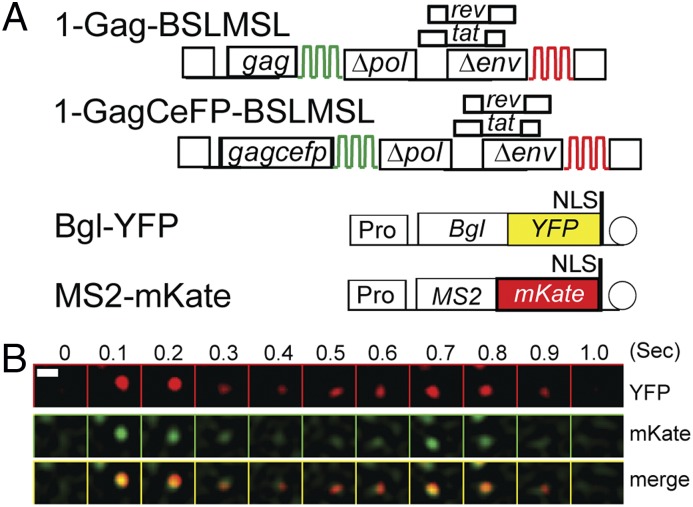
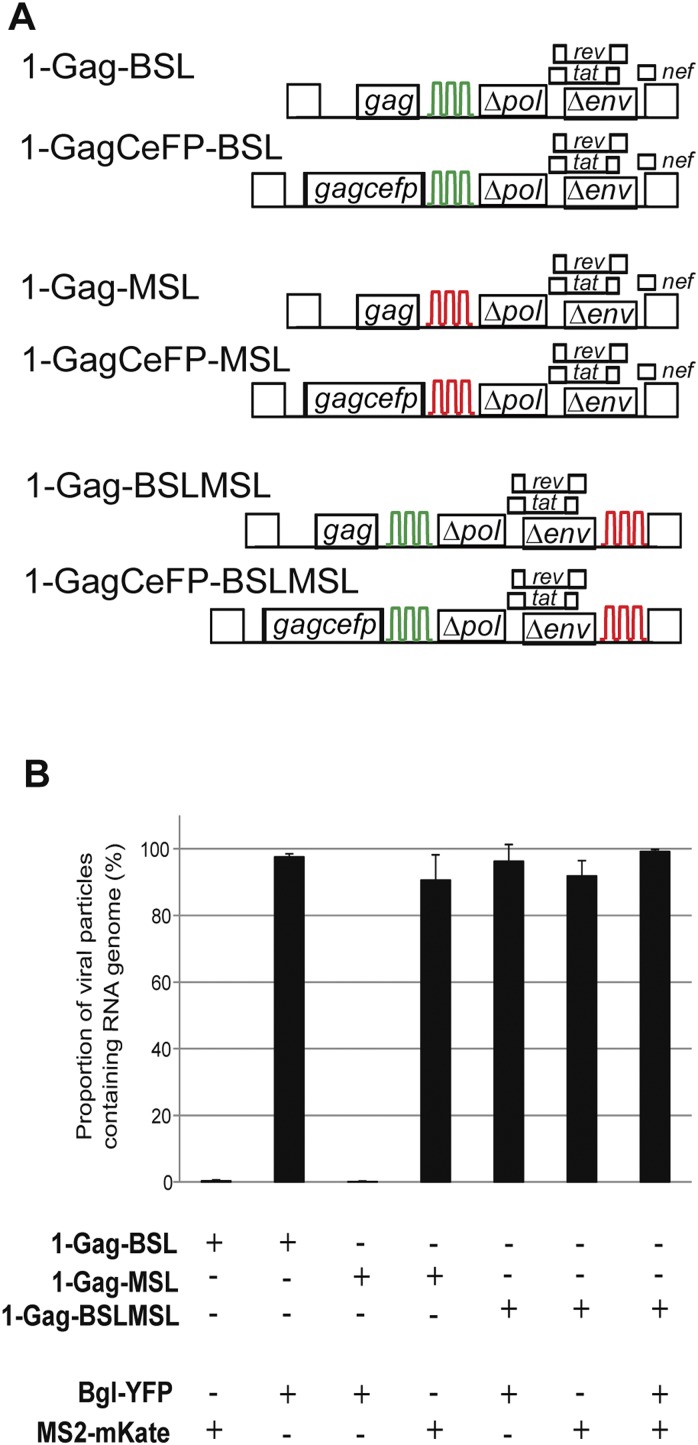
To determine whether we could reliably detect HIV-1 RNAs by using two different fluorescent protein labels in our live-cell imaging system, we generated two HIV-1 constructs (Fig. 1A) that each contain two sets of stem-loop sequences, BSL and MSL, which are specifically recognized by RNA-binding proteins BglG and MS2 coat protein, respectively. Constructs 1-Gag-BSLMSL and 1-GagCeFP-BSLMSL are derived from the NL4-3 molecular clone; they contain cis-acting elements required for viral genome replication and encode Gag or Gag fused to cerulean fluorescent protein (CeFP), respectively. Additionally, these constructs express Tat and Rev, and have inactivating deletions in the polymerase gene (pol) and the envelope gene (env). The BSL stem-loop is located in the pol gene, whereas the MSL stem-loop is located in negative regulatory factor (nef). Most of the viral particles derived from these constructs contained viral RNA genomes (Fig. S1B), indicating that full-length RNAs expressed from these constructs are packaged efficiently.
Fig. 1.
Detection of an HIV-1 RNA labeled with two different fluorescent proteins by using live-cell TIRF microscopy. (A) General structures of constructs used to detect HIV-1 RNA. HIV-1 constructs contain two sets of stem-loop sequences, BSL (green) and MSL (red), recognized by RNA-binding proteins BglG and MS2 coat protein, respectively. 1-GagCeFP-BSLMSL expresses a Gag-CeFP fusion protein, whereas 1-Gag-BSLMSL expresses an untagged Gag. Bgl-YFP and MS2-mKate are plasmids encoding fusions of RNA-binding proteins and fluorescent proteins. NLS, nuclear localization signal; Pro, RNA polymerase II promoter. Circle represents polyA signal. (B) A montage of selected frames from a movie showing simultaneous arrival and disappearance of YFP and mKate signals on the plasma membrane. (Upper) Signals detected in the YFP channel, (Middle) signals detected in the mKate channel, and (Lower) merged images of the YFP and mKate channels. Numbers on top indicate the imaged time in seconds. An LoG filter was applied by using ImageJ. (Scale bar, 1 μm.)
Fig. S1.
Detection of HIV-1 RNA genomes in viral particles by single-virion analysis. (A) General structures of the HIV-1 constructs. Stem-loop sequences BSL (green) and MSL (red) are recognized by RNA-binding protein BglG and MS2 coat protein, respectively. (B) Proportion of HIV-1 particles containing RNA genomes. Constructs were transfected into human 293T cells, and viral particles were harvested and imaged by fluorescence microscopy as previously described (1). For simplicity, only the names of the constructs expressing untagged Gag proteins are shown; however, for each experiment, two viral constructs, one expressing untagged Gag and the other expressing Gag-CeFP fusion protein, were used in an equal-weight ratio in all experiments. Results summarized from three experiments are shown; error bars represent SD.
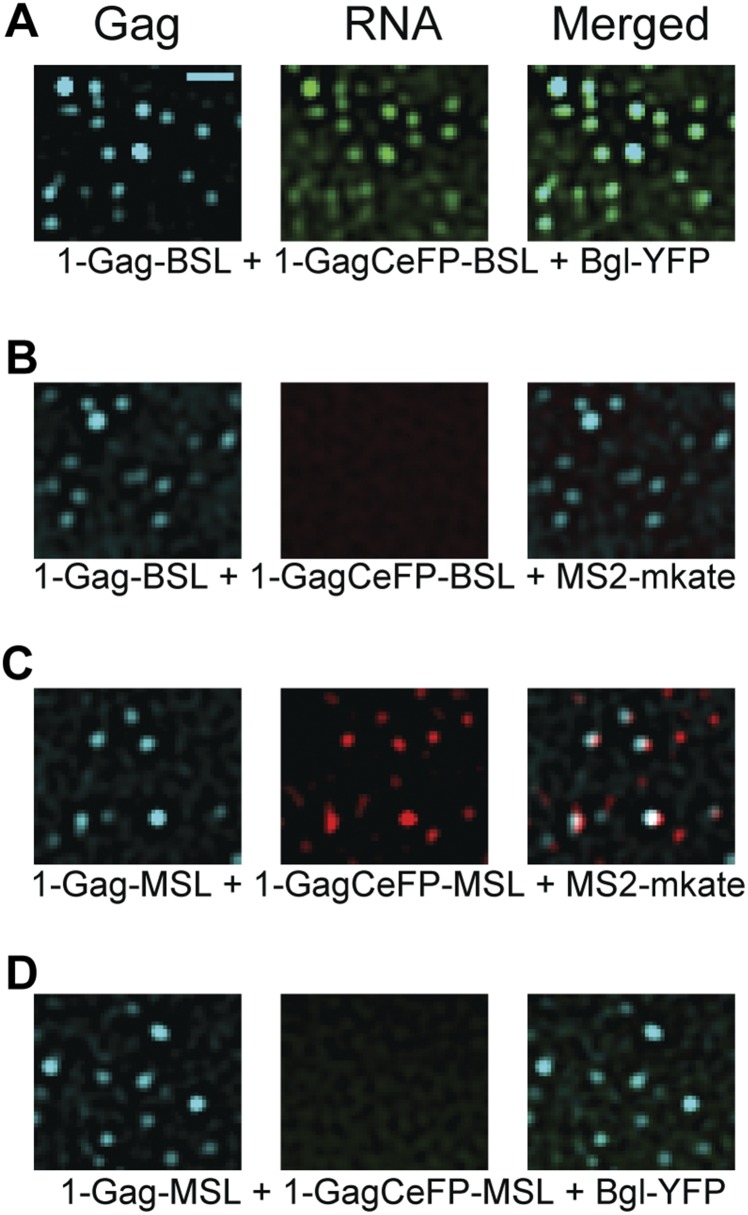
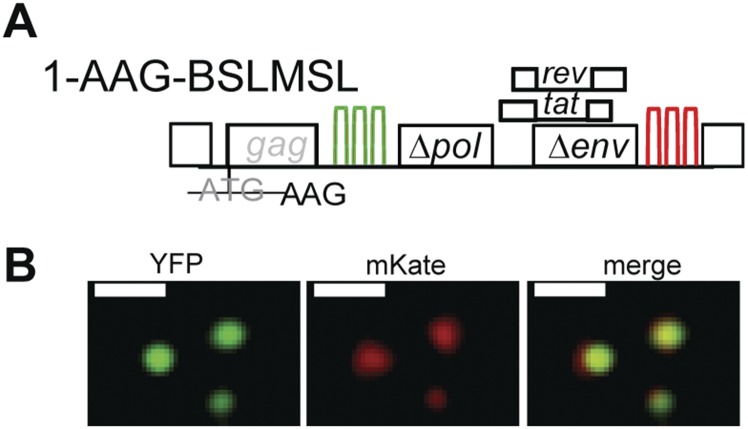
We transfected HeLa cells with 1-Gag-BSLMSL, 1-GagCeFP-BSLMSL, and two plasmids, Bgl-YFP and MS2-mKate, which express a truncated BglG fused to YFP and an MS2 coat protein fused to mKate, respectively. We then observed the RNA signals near the plasma membrane by TIRF microscopy. Because of the locations of the stem-loop sequences in the viral genome, BSL is present only in full-length HIV-1 RNA, whereas MSL is present in spliced and unspliced RNAs. In this study, we found that most (82–90%) of the YFP signals colocalized with mKate signals (YFP+/mKate+). Some of the RNA signals were associated with the Gag-CeFP signals and remained relatively immobile. However, some of the dual-colored signals were not associated with CeFP; these signals appeared on the plasma membrane together and disappeared from the TIRF field of view at the same time (Fig. 1B), indicating that we can detect both fluorescent tags on the RNA simultaneously. By using HIV-1 constructs containing BSL or MSL, we have shown that labeling via RNA-binding protein is specific; Bgl-YFP proteins label viral RNAs containing BSL whereas MS2-mKate proteins label viral RNAs containing MSL (Figs. S1 and S2). We also examined dual-labeled HIV-1 RNA signals by structured illumination microscopy at ∼100–150-nm resolution and found that the dual-colored signals were colocalized (Fig. S3). The HIV-1 sequence between BSL and MSL is ∼2.5 kb and a linear RNA of ∼2.5 kb would be ∼0.8 μm. Therefore, these results suggest that HIV-1 RNAs are folded in a compact form in the cytoplasm.
Fig. S2.
The specificity of HIV-1 RNA detection in living cells by using TIRF microscopy. Constructs 1-Gag-BSL and 1-GagCeFP-BSL were cotransfected into human cells with Bgl-YFP (A) or MS2-mKate (B), followed by TIRF microscopy. Gag signals were detected in the CeFP channel whereas RNA signals were detected in the YFP channel (A) or the mKate channel (B). Similarly, 1-Gag-MSL and 1-GagCeFP-MSL were cotransfected with MS2-mKate (C) or Bgl-YFP (D); RNA signals were detected in mKate channel (C) or YFP channel (D). An LoG filter was applied by using ImageJ. (Scale bar, 2 μm.)
Fig. S3.
Detection of an HIV-1 RNA labeled with two different fluorescent proteins in the presence of Gag using structured illumination microscopy. (A) General structure of the HIV-1 construct. Construct 1-AAG-BSLMSL contains two sets of stem-loop sequences, BSL and MSL. The distance from the beginning of BSL to the end of MSL is ∼4.5 kb. The HIV-1 sequence between BSL and MSL is ∼2.5 kb. A linear RNA of ∼2.5 kb would be ∼0.8 μm. The translation start codon in the gag gene was mutated from ATG to AAG; thus, this construct does not express functional Gag. (B) Structured illumination microscopy images of the YFP and mKate signals from 1-AAG-BSLMSL RNA. (Scale bar, 0.5 μm.)
In the Absence of Gag, Most HIV-1 RNAs Appear on the Plasma Membrane as Monomers.
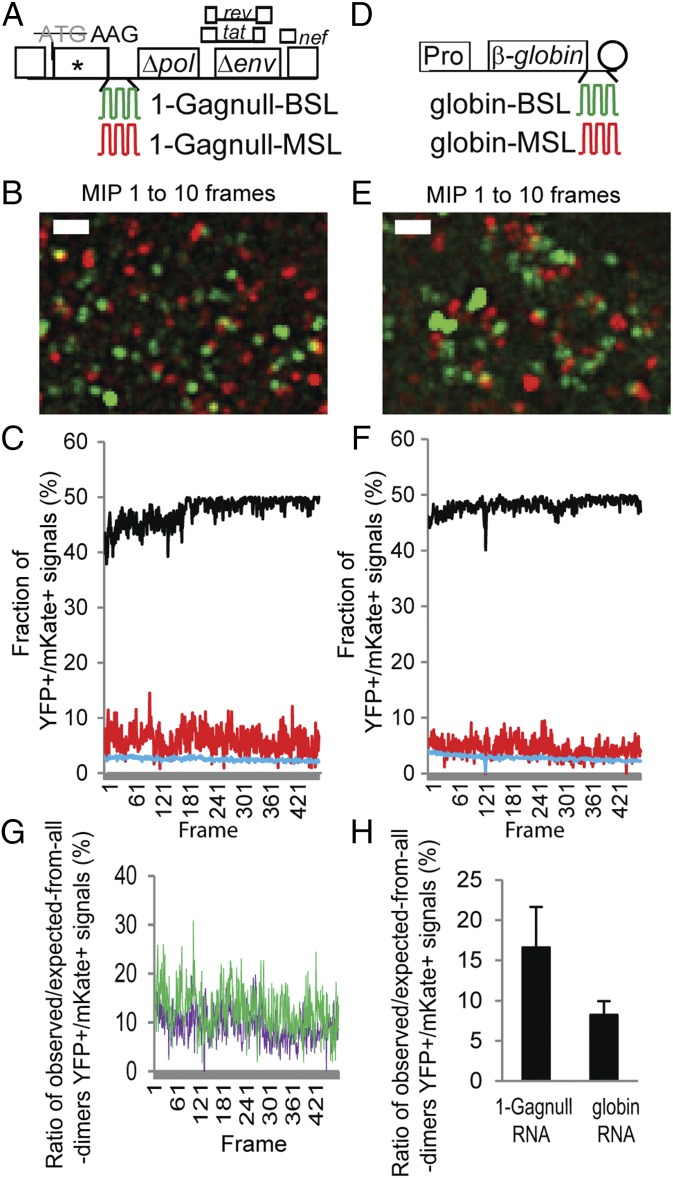
HIV-1 RNAs can reach the plasma membrane in the absence of Gag protein. To examine whether these HIV-1 RNAs are in monomeric or dimeric form, we coexpressed Bgl-YFP and MS2-mKate with two HIV-1 constructs, 1-Gagnull-BSL and 1-Gagnull-MSL (Fig. 2A), which contain stem-loop sequences in pol that are recognized by BglG protein and MS2 coat protein, respectively. These constructs each contain two mutations in gag: the translation start codon was changed to AAG and a frame-shift mutation in the capsid region generated a premature stop codon. HIV-1 RNA with the AUG-to-AAG mutation can be efficiently packaged and can undergo replication when viral proteins are supplemented in trans (20). We then performed TIRF microscopy and captured images of signals near the plasma membrane by using a frame rate of 102 ms for 50 s. As demonstrated in Movie S1 and a representative image of 10-frame maximum-intensity projection (MIP) shown in Fig. 2B, most of the RNA signals that appeared near the plasma membrane were YFP or mKate, and only a very small portion of the signals were YFP+/mKate+.
Fig. 2.
Simultaneous detection of two RNAs labeled with YFP and mKate. General structures of the HIV-1 constructs (A) and plasmids expressing human β-globin RNAs (D) that contain stem-loop sequences recognized by BglG (green) or MS2 coat protein (red). Pro, c-fos promoter; rev, regulator of expression of viral proteins; tat, transactivator of transcription. Circle represents polyA signal. For clarity, introns within the β-globin gene are not illustrated. Image of a 10-frame MIP from a movie showing detection of two HIV-1 RNAs (B) and two β-globin RNAs (E) labeled with YFP or mKate. Corresponding movies are shown in Movies S1 and S2, respectively. A LoG filter was applied by using ImageJ. (Scale bar, 2 μm.) Frame-by-frame analyses of the fraction of colocalized YFP and mKate (YFP+/mKate+) signals from two HIV-1 RNAs (C) and two β-globin RNAs (F). Red line represents observed YFP+/mKate+ signals; black line represents expected YFP+/mKate+ signals assuming that all RNAs are randomly assorted dimers; blue line represents expected colocalization of YFP+ and mKate+ signals assuming all RNAs are randomly distributed monomers. (G) Comparison of the ratios of observed/expected-from-all-dimer YFP+/mKate+ signals in HIV-1 RNAs and β-globin RNAs. For each frame, the fraction of the observed YFP+/mKate+ signals was divided by the fraction of the expected YFP+/mKate+ signals assuming that all RNAs are randomly assorted dimers. The ratios of the HIV-1 RNAs from Fig. 2C are shown in green, and the ratios of β-globin RNAs from Fig. 2F are shown in purple. (H) Ratios of observed/expected-from-all-dimer YFP+/mKate+ signals in HIV-1 RNAs and β-globin RNAs. Results from each cell were first analyzed by frame-by-frame comparison, and the mean was calculated. Results from six cells are shown; error bars represent SD.
We postulated that the small portion of YFP+/mKate+ signals detected in our experiments could be from colocalization of two monomeric RNAs by random distribution or from a small population of dimeric HIV-1 RNAs. To distinguish between these two possibilities, we identified the number of YFP signals and mKate signals in each frame of the captured movie, along with the outline of the cell as the spatial information, and made the following two calculations. First, based on the assumption that all HIV-1 RNAs are monomers that are randomly distributed, we calculated the expected fraction of YFP+/mKate+ signals in the viral RNA population. An example is shown as the blue line in Fig. 2C. As the numbers of detected YFP signals and mKate signals varied in each frame, the expected fraction of YFP+/mKate+ in the population also varied, and the average is 2.5 ± 0.3% (mean ± SD). We also used the assumption that all HIV-1 RNAs are randomly assorted dimers, and calculated the expected fractions of YFP+/mKate+ signals in the population; an example is shown as the black line in Fig. 2C, and the average is 47.8 ± 2.3%. During random assortment of RNA dimerization, homodimers and heterodimers are formed, and the maximum fraction of heterodimers is 50%. A homodimer that contains two copies of 1-Gagnull-BSL RNA is labeled with one type of fluorescent protein, such as YFP. In contrast, a heterodimer that contains one 1-Gagnull-BSL RNA and one 1-Gagnull-MSL RNA is YFP+/mKate+. Our observed YFP+/mKate+ signals are shown as the red line in Fig. 2C, with an average of 5.8 ± 2.2%, which is much lower than the expected values from all RNAs being dimeric (47.8 ± 2.3%; Fig. 2C, black line), indicating that most of the RNAs were not in dimeric form. However, the observed values were higher than those expected from all RNAs being monomeric (2.5 ± 0.3%; Fig. 2C, blue line), suggesting that some RNAs were dimeric.
In the Absence of Gag, HIV-1 RNAs Have a Slightly Higher Propensity to Form Dimers than β-Globin RNAs.
To examine the behavior of a nonviral RNA, we labeled and tracked exogenous human β-globin RNAs. Constructs used to express human β-globin RNAs contain c-fos promoters, BSL or MSL sequences at the 3′ UTR of the RNA, followed by bovine growth hormone polyadenylation signal (Fig. 2D). These two constructs were cotransfected into cells with Bgl-YFP and MS2-mKate, the β-globin RNAs were visualized by using TIRF microscopy, and very few colocalized YFP+/mKate+ signals were observed (Fig. 2E and Movie S2). By using the β-globin RNA data, we performed the aforementioned analyses, and the results are shown in Fig. 2F. With the assumption that all β-globin RNAs are dimers, 48 ± 1.2% of the signals (Fig. 2F, black line) would be YFP+/mKate+, whereas, with the assumption that all RNAs are monomers, 2.7 ± 0.5% of the signals (Fig. 2F, blue line) would be dual-positive because of random colocalization. The observed YFP+/mKate+ signals are shown in red in Fig. 2F (4.2 ± 1.6%).
To directly compare the results from the HIV-1 RNAs and β-globin RNAs, we performed the following analyses. Because the numbers of YFP and mKate signals varied in each experiment, this variation results in different values of expected YFP+/mKate+ frequencies. For example, the expected fractions of YFP+/mKate+ signals assuming that all RNAs are dimers (shown as black lines in Fig. 2C) are different in each experiment; the averages of the black lines in Fig. 2 C and F are 47.8% and 48.1%, respectively. To take this variable into consideration, and to directly compare these two sets of results, we divided the observed YFP+/mKate+ signals by the expected YFP+/mKate+ signals assuming that all RNAs are dimers (red line value/black line value in Fig. 2C) to generate the observed/expected-from-all-dimers ratio. Examples of the observed/expected-from-all-dimers ratios for the data presented in Fig. 2 C and F are shown in Fig. 2G; the average value for HIV-1 RNAs (Fig. 2G, green line) is 12.1 ± 4.7%, whereas the average value for β-globin RNAs (Fig. 2G, purple line) is 8.8 ± 3.3%. The observed/expected-from-all-dimers ratios of HIV-1 RNAs from six cells and the ratios of β-globin RNAs from six cells are summarized in Fig. 2H; these results suggest that HIV-1 RNAs have slightly more colocalized YFP+/mKate+ signals than β-globin RNAs (P = 0.01, Student t test). Therefore, in the absence of Gag, HIV-1 RNAs have a slightly higher propensity for dimerization than β-globin RNAs. However, this property does not result in a drastic increase in the colocalized YFP+/mKate+ RNAs; most of the HIV-1 and β-globin RNAs near the plasma membrane are monomeric.
The Proportion of Dimeric HIV-1 RNA Increases with Gag Association.
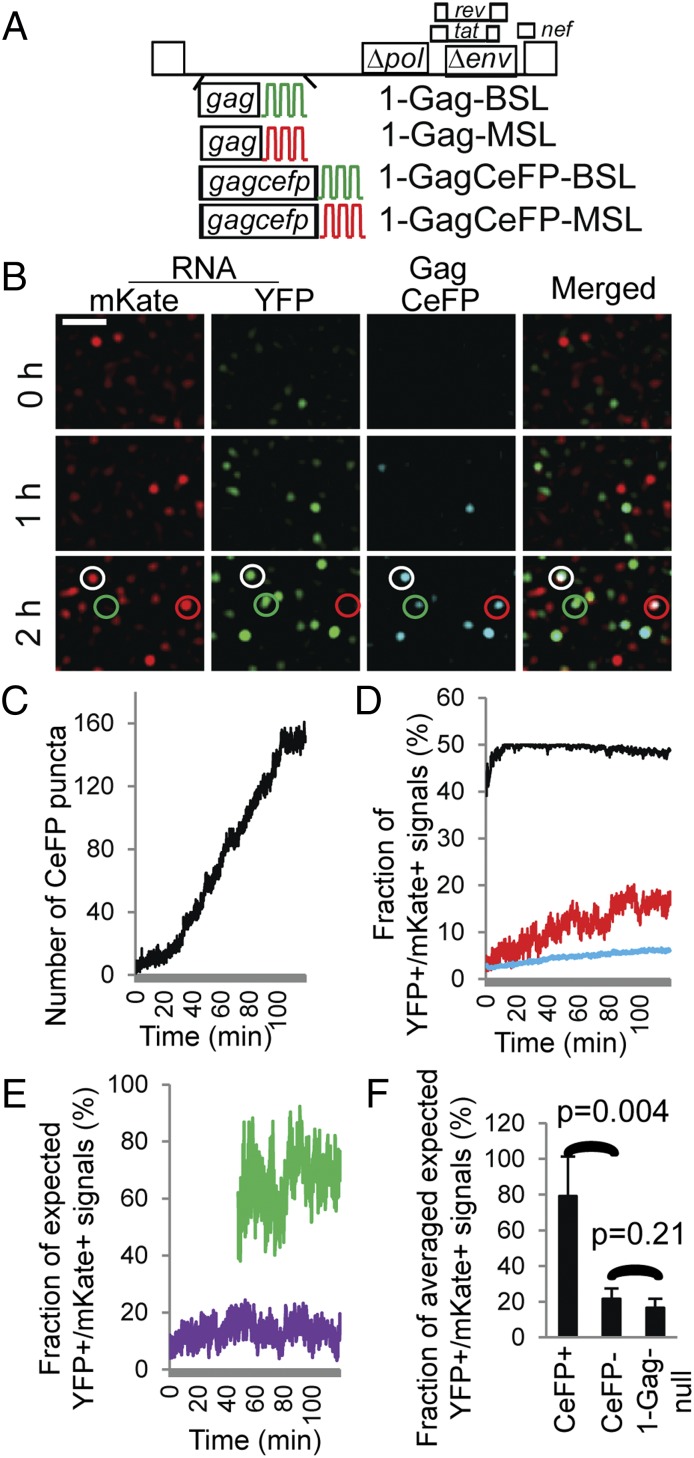
During virus assembly, dimeric RNA is encapsidated. To gain a better understanding of how two copies of viral RNA become associated with a viral complex, we labeled and followed HIV-1 RNA in the presence of Gag. For this purpose, we coexpressed Bgl-YFP and MS2-mKate with four HIV-1 constructs that express an untagged Gag or a GagCeFP fusion protein (1) (Fig. 3A). We selected cells that had YFP and mKate signals, but lacked or had only a few CeFP puncta at the beginning of the observation time; we tracked the viral RNAs by their YFP and mKate signals and the multimerization of Gag proteins on the plasma membrane by their CeFP signals. A set of representative images is shown in Fig. 3B and Movie S3. At the beginning of the imaging time (Fig. 3B and Movie S3, “0 h”), there were a few mKate or YFP signals; at 2 h, there were significantly more RNA signals and multiple Gag puncta. The number of Gag puncta increased with time (Fig. 3C); however, there were more RNA signals than Gag puncta (Fig. 3B). Most Gag puncta were associated with RNA signals, whereas some were colocalized with only the mKate signals, only the YFP signals, or both signals; examples are indicated by red, green, and white circles in the bottom panels of Fig. 3B, respectively.
Fig. 3.
The effects of Gag on the colocalization of HIV-1 RNAs labeled with YFP or mKate. (A) General structures of HIV-1 constructs that contain BSL or MSL and express untagged or CeFP-tagged Gag proteins. (B) Representative images showing RNA and Gag signals detected at 0, 1, and 2 h of the experiment. An LoG filter was applied by using ImageJ. (Scale bar, 5 μm.) Red, green, and white circles indicate CeFP puncta that colocalize with mKate+, YFP+, and YFP+/mKate+ RNA signals, respectively. A corresponding movie is shown in Movie S3. (C) Number of CeFP puncta detected in each frame over time. (D) Frame-by-frame analyses of the observed and expected fractions of YFP+/mKate+ signals. Line colors are the same as in Fig. 2C: red, observed; black and blue, expected assuming that all RNAs are dimers and monomers. (E) Comparison of the ratios of observed/expected-from-all-dimer YFP+/mKate+ signals in CeFP+ (green line) and CeFP− (purple line) populations. Results from the same cell are shown in C–E. (F) The effect of detectable Gag on the ratios of observed/expected-from-all-dimer YFP+/mKate+ signals. Results from five cells are shown. HIV-1 1-Gagnull results from Fig. 2H are shown here for comparison; error bars represent SD.
We then analyzed the fraction of YFP+/mKate+ signals among all RNA signals; a representative analysis from one cell is shown in Fig. 3D. The observed fraction of YFP+/mKate+ signals is shown as the red line (Fig. 3D), whereas the expected fractions of YFP+/mKate+ signals with the assumption that HIV-1 RNAs on the plasma membrane are dimers and monomers are shown as the black and blue lines (Fig. 3D), respectively. Our results indicate that there were more colocalized signals at later time points compared with those from the earlier time points (Fig. 3D). For example, toward the end of the observation time, ∼15–20% of the RNA signals were YFP+/mKate+, which far exceeded those expected for random distribution of two monomeric RNAs (Fig. 3D, blue line) but were still much lower than those expected for all dimeric RNAs (Fig. 3D, black line), suggesting that monomeric and dimeric RNAs were present in the population.
To gain a better understanding of the mixed monomeric/dimeric RNA population, we analyzed two different groups of the population: those RNA signals that colocalized with CeFP puncta (CeFP+) and those that did not (CeFP−). The aforementioned observed/expected-from-all-dimers ratios of the CeFP+ and CeFP− populations are shown in Fig. 3E as green and purple lines, respectively; because there were very few Gag puncta at the earlier frames, only analyses from later frames that each contained ≥50 CeFP puncta are shown. Data summarized from five cells (Fig. 3F) showed that the Gag-associated RNAs were enriched with YFP+/mKate+ signals; in contrast, RNAs that were not colocalized with CeFP puncta had a lower level of YFP+/mKate+ signals, at a range similar to that of HIV-1 RNAs without Gag expression (1-Gagnull). Thus, Gag association is an important determinant for the monomeric/dimeric state of HIV-1 RNA near the plasma membrane.
HIV-1 and HIV-2 RNAs Colocalize Less Frequently than Two HIV-1 RNAs in the Presence of HIV-1 Gag.
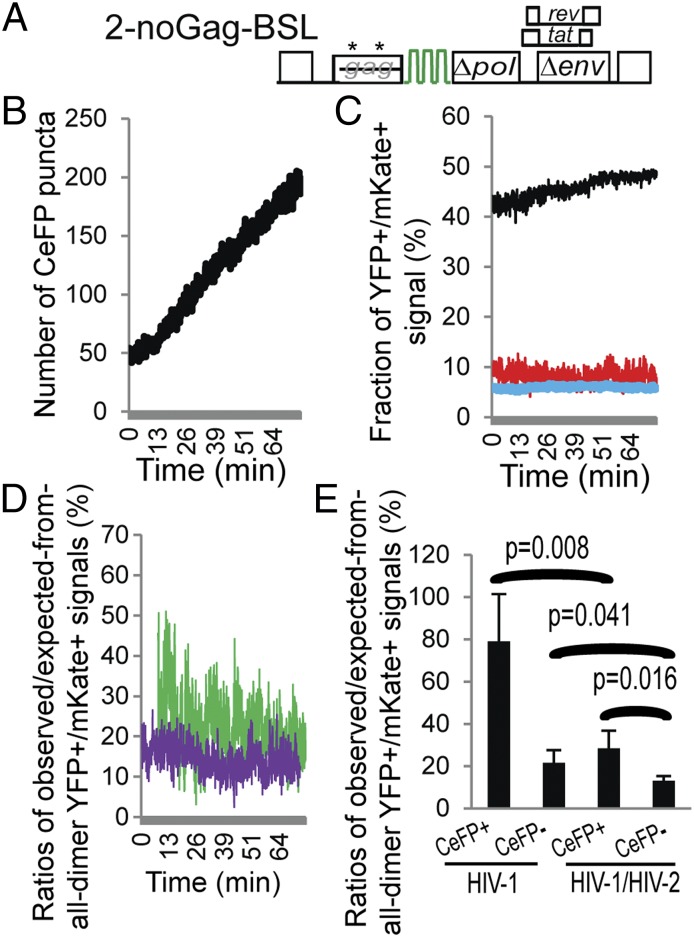
To verify our experiments and analyses, we examined the interactions between an HIV-1 RNA and an HIV-2 RNA. We previously showed that HIV-1 and HIV-2 RNAs are inefficiently copackaged compared with the copackaging of two HIV-1 RNAs (21). Additionally, HIV-1 and HIV-2 RNA copackaging is dependent on the presence of HIV-1 Gag (21) because HIV-2 Gag does not package HIV-1 RNA (22). Thus, we coexpressed Bgl-YFP, MS2-mKate, 1-GagCeFP-MSL, 1-Gag-MSL, and the HIV-2 construct 2-noGag-BSL (21) (Fig. 4A) and examined the behaviors of the viral RNAs and Gag signals by TIRF microscopy. Construct 2-noGag-BSL contains all of the cis-acting elements critical for HIV-2 replication but encodes defective gag, pol, and env; specifically, two insertions in the gag reading frame generated two sets of premature termination codons.
Fig. 4.
Detection of HIV-1 and HIV-2 RNA colocalization in the presence of HIV-1 Gag. (A) General structure of the HIV-2 construct containing BSL with inactivating mutations in gag (asterisks). (B) Number of CeFP puncta detected in each frame over time. (C) Frame-by-frame analyses of the observed and expected fractions of YFP+/mKate+ signals. Line colors are the same as in Fig. 2C: red, observed; black and blue, expected assuming that all RNAs are dimers and monomers. (D) Comparison of the ratios of observed/expected-from-all-dimer YFP+/mKate+ signals in CeFP+ (green line) and CeFP− (purple line) populations. Results from the same cell are shown in B–D. (E) The effect of detectable Gag on the ratios of observed/expected from-all-dimer YFP+/mKate+ signals. Results from five cells are shown. Results from Fig. 3F are shown here for comparison (labeled as HIV-1); error bars represent SD.
We selected cells that expressed HIV-1 and HIV-2 RNAs and followed the progression of the viral RNA and Gag signals. Similar to experiments described in Fig. 3, CeFP puncta increased with time (Fig. 4B). When we analyzed the colocalization of YFP (HIV-2 RNA) and mKate (HIV-1 RNA) signals, we found that there were fewer YFP+/mKate+ signals (8.3%; Fig. 4C, red line) compared with those from two HIV-1 RNAs (11.4%; Fig. 3D, red line). The expected fractions of the YFP+/mKate+ signals assuming that RNAs are dimers and monomers are shown in Fig. 4C as black and blue lines, respectively. We further determined the fractions of the YFP+/mKate+ signals in the CeFP+ and CeFP− populations, shown as green and purple lines in Fig. 4D, respectively. Although there appeared to be a higher fraction of the YFP+/mKate+ signals in the CeFP+ population compared with those in the CeFP− population, these results are distinct from those of two HIV-1 RNAs (Fig. 3E), which indicate a substantial increase of the YFP+/mKate+ signals. We summarized results from five cells in Fig. 4E (marked “HIV-1/HIV-2”); results from Fig. 3F are shown on the side for comparison (marked “HIV-1”). Our results indicate that HIV-1 and HIV-2 RNAs were colocalized more frequently in the CeFP+ population than in the CeFP− population. However, in CeFP+ and CeFP− populations, there were significantly less YFP+/mKate+ signals in the HIV-1 and HIV-2 RNA studies compared with those from two HIV-1 RNAs (Fig. 4E). These results are consistent with our previous observation that HIV-1 and HIV-2 RNAs can copackage at a low efficiency (21).
Taken together, our results show that HIV-1 RNAs exist as a mixed population on the plasma membrane. Dimeric RNAs are enriched in the population that associates with detectable Gag (CeFP+). However, most of the HIV-1 RNAs remain monomeric when not associated with detectable Gag. We envisioned two possible scenarios by which such a mixed population can occur; one possibility is that HIV-1 RNAs interact with one another and dimerize on the plasma membrane, followed by Gag multimerization/virus assembly. Alternatively, it is possible that some HIV-1 RNAs form dimers in the cytoplasm and dimeric and monomeric RNAs reach the plasma membrane; however, only dimeric RNAs are selected for packaging. We performed further analyses to test these two possibilities.
Analysis of Individual RNA Tracks Revealed That HIV-1 RNA Dimerizes on the Plasma Membrane.
To distinguish between the two aforementioned possibilities, we tracked individual RNA signals to determine the order in which viral RNAs and Gag signals appear on the plasma membrane. We reasoned that, if HIV-1 RNAs dimerize on the plasma membrane, we should observe the merging of two RNA signals. In contrast, if cytoplasmically formed RNA dimers are selected for packaging, we should observe YFP and mKate signals appearing on the plasma membrane at the same time and comigrating during their detection time.
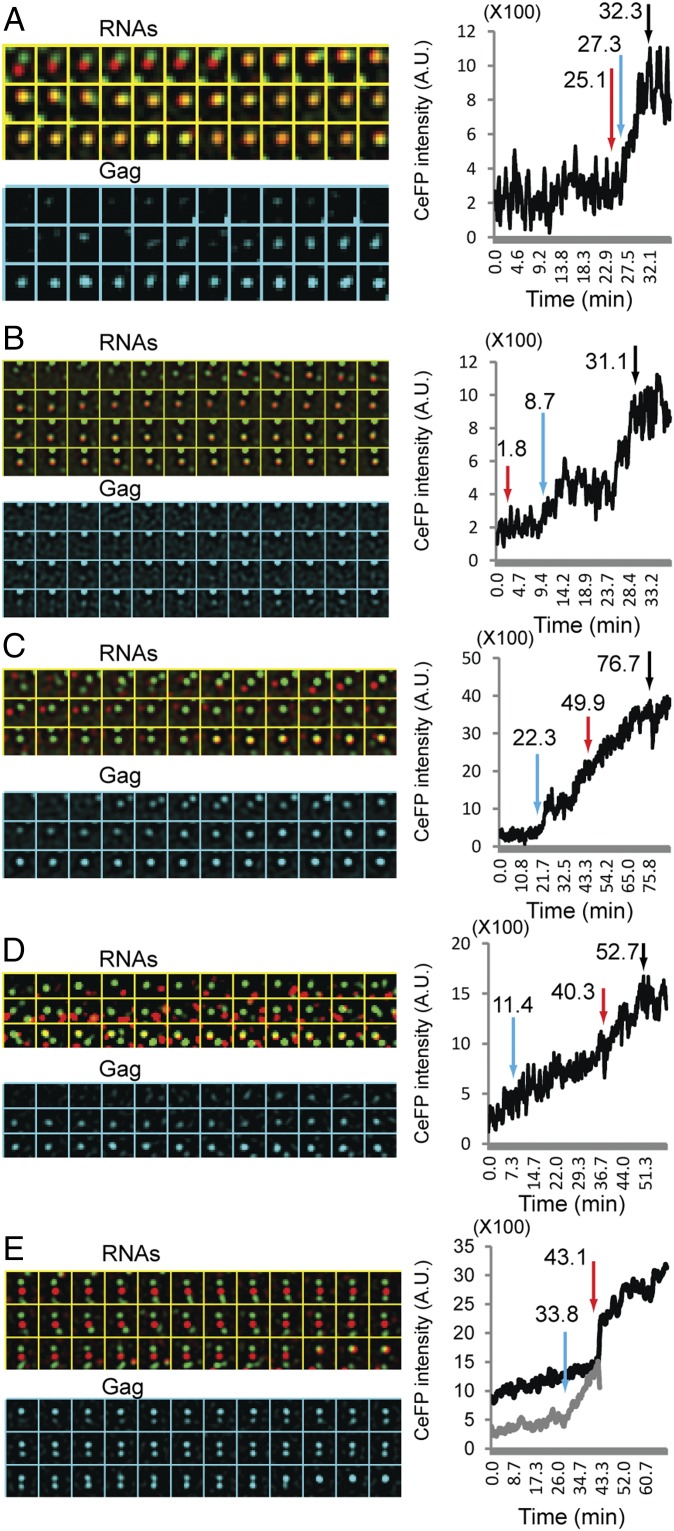
In our experiments, we did not observe simultaneous appearance and departure of colocalized YFP and mKate RNA signals, as one would expect from the hypothesis on the selection of cytoplasmically formed RNA dimers. In contrast, we observed that HIV-1 RNAs interact with one another dynamically on the plasma membrane. We have delineated the RNA–RNA interactions and Gag accumulations in 23 events; in all of these events, merging of the RNA signals was observed, indicating that HIV-1 RNAs dimerize on the plasma membrane. Representative events are shown in Fig. 5. In each event, time-lapse images of RNAs and Gag are shown in marked panels in Fig. 5; the intensity of the Gag signals is shown on the right (Fig. 5), with the red arrow indicating the merging of the RNA signals, the blue arrow indicating the detection of the Gag signal, and the black arrow indicating the Gag signal reaching a plateau (Fig. 5).
Fig. 5.
HIV-1 RNA–RNA interactions and Gag accumulation on the plasma membrane. Representative events are shown in A–E. In the events shown in A and B, RNA-merging events were detected before the detection of GagCeFP signals; corresponding movies are shown in Movies S4 and S5, respectively. In events shown in C and D, one of the RNAs was colocalized with Gag signal before merging with the other RNA; corresponding movies are shown in Movies S6 and S7, respectively. In events shown in E, both RNA signals were associated with Gag signals before merging; corresponding movies are shown in Movie S8. YFP and mKate signals are shown in panels marked RNAs, whereas CeFP signals are shown in panels marked Gag. (Right) CeFP intensity plots; y axis, CeFP intensity shown in arbitrary units (A.U.). Labels in the y axis are shown in 1/100 (values are ×100); x axis, time in minutes. Red arrows indicate merging of the RNA signals, blue arrows indicate detection of the CeFP signals, and black arrows indicate the plateau of CeFP intensity. An LoG filter (time averaging over three frames) was applied by using ImageJ.
In 12 of the 23 events, we observed that two RNA signals colocalized before the detection of CeFP signals; two examples are shown in Fig. 5 A and B. In the example shown in Fig. 5A and Movie S4, two RNA signals merged and stayed together, Gag signals were detected after the merging of the RNA signals, and the GagCeFP intensity increased with time for ∼5 min and reached a plateau (Gag panels and intensity plot). In the example shown in Fig. 5B and Movie S5, a stable Gag–RNA (YFP) complex was detected on the upper middle part of the image in all frames; this complex is not the focus of these panels. Rather, a YFP signal was first detected and then merged with an mKate signal; a CeFP signal was detected many frames later. As shown in the CeFP intensity plot, a pause in CeFP intensity was observed before the increase of the CeFP intensity resumed and reached a plateau. This pause is reminiscent of the previously described pausing events during HIV-1 assembly (23).
In 8 of the 23 identified events, we observed that one RNA signal with colocalized Gag signals was joined with an RNA signal without detectable Gag; two examples are shown in Fig. 5 C and D and in Movies S6 and S7. In both cases, the second RNA signal was detected much later (more than 20 min) after the detection of the first signal. After the merging of the RNA signals, the CeFP signal intensity increased and reached a plateau. We determined the assembly time of 50 HIV-1 particles (Fig. S4) and found that the general distribution is similar to that described in a previous report (23). The assembly duration for both examples shown in Fig. 5 C and D is exceedingly long (∼40–50 min) among the observed assembly times.
Fig. S4.
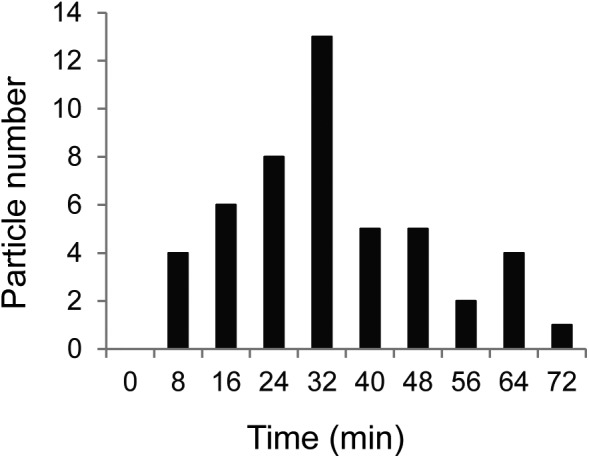
The distribution of time required to complete HIV-1 assembly. A summary from 50 HIV-1 particles is shown. The time required to complete HIV-1 assembly is measured from the first detection of the CeFP signal to the point when the intensity of the CeFP signal reaches a plateau.
In three of the 23 identified events, we observed the merging of two RNA signals, each with detectable colocalized Gag signals. This example is shown in Fig. 5E and Movie S8.
In summary, we sought to delineate a critical step in HIV-1 RNA encapsidation, the dimerization of the viral RNA genome. Our results indicate that HIV-1 RNA dimerization occurs on the plasma membrane and that Gag protein is required to stabilize the RNA dimer.
Discussion
HIV-1 packages a dimeric RNA, and this replication strategy affects multiple aspects of viral replication. For example, frequent recombination occurs during reverse transcription, using genetic information encoded in the two copackaged RNA genomes. Thus, the ability of two viruses to interact genetically is directly affected by the frequency of their RNAs copackaging into a virion. Additionally, recent studies demonstrated that HIV-1 RNA packaging is regulated by the recognition of a dimeric RNA; thus, RNA dimerization is an integral part of virus assembly.
The participating partners required for HIV-1 RNA dimerization have not been well defined. In vitro-transcribed short RNAs containing the 5′ UTR of HIV-1 sequences can form a dimer in test tubes without viral protein, although dimerization efficiency is enhanced by the presence of Gag or nucleocapsid protein (8, 24). However, whether HIV-1 RNAs can form dimers in vivo without the presence of Gag was unknown. The present results indicate that, in the absence of Gag proteins, HIV-1 RNAs are mostly monomers and colocalize at a rate slightly higher than that of two globin RNAs (Fig. 2). Our experiments also reveal that Gag plays a major role in RNA genome dimerization. We envision that Gag may promote RNA dimerization and/or stabilize RNA dimers: the chaperone activity of Gag may promote RNA dimerization, and the Gag binding to RNA may stabilize RNA dimers. Future experiments are needed to distinguish the contribution of each activity, and whether they act independently or in concert.
The location(s) at which retroviral RNA dimerizes is a long-standing question in retrovirology. In the present report, we demonstrate that HIV-1 RNA dimerization occurs on the plasma membrane. Our results also shed light on the time frame in which RNA dimerization occurs during virus assembly. In the presence of sufficient Gag proteins for virus assembly, it is likely that most HIV-1 RNAs are associated with some Gag proteins, because the overall dynamics of the viral RNA is altered (25). Thus, the RNA dimerization process is likely to be the merging of two Gag–RNA complexes, regardless of whether the Gag signal is detected. We observed the merging of two RNA signals when neither, one, or both were associated with detectable Gag signals. The precise number of Gag proteins associated with a given RNA is difficult to determine because untagged and CeFP-tagged Gag proteins were used in this study. Additionally, similar to other groups that used the TIRF microscopy approach (14, 23, 26), we cannot detect signal from a single fluorescent protein, and multiple (∼20–30) proteins need to colocalize to be detected. However, most of the RNA dimerization events were observed when both viral RNAs lack Gag signals, and Gag signal intensity increases after the observed dimerization event, indicating that most RNA dimerization occurs early in the assembly process. We also observed that RNA dimerization occurs, albeit less frequently, when one or both RNAs are associated with Gag signal, suggesting that RNA dimerization can occur at a later stage in virus assembly.
The transfer of genetic materials is a key feature of replication. Retroviral genomes in the virions are dimers that consist of two full-length viral RNAs. In the present report, we have shown that HIV-1 RNA genomes dimerize on the plasma membrane in the presence of Gag, often at an early stage in particle assembly. Although this study provides the first glimpse of such events as far as we are aware, many questions remain. For example, where does RNA genome dimerization occur for other retroviruses, and is Gag involved in those processes? Future studies are needed to understand these biologically important events.
Materials and Methods
Plasmid Construction and Cell Culture.
Previously described HIV-1 constructs GagCeFP-BglSL, Gag-BglSL, GagCeFP-MS2SL, and Gag-MS2SL (1) are referred to as 1-GagCeFP-BSL, 1-Gag-BSL, 1-GagCeFP-MSL, and 1-Gag-MSL, respectively, for clarity in the present report. Constructs 1-Gagnull-BSL and 1-Gagnull-MSL have structures similar to those of 1-Gag-BSL and 1-Gag-MSL, respectively, with the Gag translational start codon ATG mutated to AAG and an 8-bp deletion in the capsid-encoding sequence that leads to a premature stop codon 693 bp downstream of the AAG mutation. The general structures of constructs 1-Gag-BSLMSL and 1-GagCeFP-BSLMSL are similar to those of 1-Gag-BSL and 1-GagCeFP-BSL, respectively, except for the addition of 24 copies of the MS2 stem-loop sequence inserted in the nef gene. Construct 1-AAG-BSLMSL is similar to 1-Gag-BSLMSL except that the Gag translational start codon was changed from AUG to AAG to abolish the translation of functional Gag. The previously described construct HIV-2-noGag-BglSL (21) is referred to as 2-noGag-BSL for clarity in the present report; this HIV-2–based construct contains two stop-codon mutations in the gag gene—one at codon 17 of Gag in MA and one at codon 171 of CA—to abolish Gag expression (21). Construct globin-MSL was modified from r-Cfp-betaglobin (27), which encodes a β-globin gene under the control of the tet promoter. The β-globin gene includes introns, and a CeFP gene was fused to the end of exon 3; additionally, intron 2 and 3′ UTR contain stem-loop sequences recognized by bacteriophage PP7 and MS2 coat proteins, respectively. To generate globin-MSL, the tet promoter was replaced with a c-fos promoter, and the CeFP gene at the end of exon 3 was deleted. Globin-BSL was derived from globin-MSL by replacing 24 copies of MS2 stem-loop sequences in the 3′ UTR with 18 copies of stem-loop sequences recognized by BglG proteins (28). Both globin-MSL and globin-BSL constructs contain introns. Because introns are removed by splicing before RNA export from the nucleus, they are not expected to be present in RNAs near the plasma membrane; for clarity, the introns are not illustrated in the general structures. Plasmid Bgl-YFP has been reported previously (19). Plasmid MS2-mKate was derived from MS2-YFP (29) by replacing the YFP gene with the mKate gene (30).
Human HeLa cells were maintained at 37 °C with 5% CO2 in DMEM supplemented with 10% FCS, penicillin (50 U/mL), and streptomycin (50 μg/mL). Transfections were performed by using FuGENE HD (Roche) according to the manufacturer’s recommendation.
Microscopy, Image Acquisition, and Processing.
TIRF microscopy was performed with an inverted Nikon Ti microscope and a 100 × 1.45 N.A. TIRF oil objective. Digital images were acquired by using an Andor iXon3 897 camera and NIS-element software (Nikon). Simultaneous imaging of YFP and mKate signals was performed by using an image splitter (QV2; Photometrics); alignment of CeFP, YFP, and mKate channels was performed before and after imaging by using custom triple-color fiduciary markers and custom Matlab programs (Mathworks). The CeFP, YFP, and mKate fluorophores were excited with 440-, 514-, and 594-nm lasers, respectively, whereas emission was detected by using 480/40-nm, 542/27-nm, and 650/75-nm filters, respectively. Rapid HIV-1 RNA movement was acquired by using RAM capture with a 100-ms integration time and ∼2-ms overhead between frames, resulting in an overall 102-ms frame time. Long-term imaging of HIV-1 particle assembly was performed every 5 s with a 100-ms acquisition time for 1–2 h. Structured illumination microscopy was performed with the N-SIM system (Nikon) in 3D SIM mode with a resolution of ∼115 nm (Nikon). Subsequent image processing and analysis, including Laplacian of Gaussian (LoG) filtering, frame averaging, MIP, quantification of CeFP intensity, and movie encoding, were performed with ImageJ software.
Data Analysis and Simulations.
To calculate the fraction of colocalized YFP+/mKate+ signals among all RNA signals, we first determined the positions of the diffraction-limited spots of all of the YFP and mKate signals in each frame of the movie by using Localize software (31). YFP and mKate signals are defined as colocalized when these two signals are located less than 3 pixels apart, and the fraction of colocalized YFP+/mKate+ signals was calculated in each frame. We performed the following calculation to obtain the expected fraction of YFP+/mKate+ signals assuming that all RNAs are dimers or monomers. We first identified the numbers of single-colored YFP or mKate RNA signals in each frame, referred to as Y and M, respectively, and the number of double-colored (i.e., YFP+/mKate+) signals, referred to as D. Under the assumption that all RNAs are dimers, the single-colored RNA signals represent homodimers; therefore, the total number of YFP RNA is (2Y + D) and the total number of mKate RNA is (2M + D). These two total numbers of YFP or mKate RNA, and the assumption of random assortment based on Hardy–Weinberg distribution, were used to calculate the expected fraction of YFP+/mKate+ signals assuming that all RNAs are dimers. Under the assumption that all RNAs are monomers, the total numbers of YFP and mKate RNAs are (Y + D) and (M + D), respectively. The area of each cell was determined from the signals of the fluorescent proteins, and a mask of the area was generated. Using the aforementioned mask, the total numbers of YFP and mKate RNAs, and the assumption of random distribution of RNAs within the mask, 100 simulation sets were generated. From these simulations, we calculated the average fraction of YFP+/mKate+ signals (Figs. 2–4, blue lines). All calculations and simulations were carried out with custom Matlab programs.
Supplementary Material
Acknowledgments
We thank Anne Arthur for expert editorial help; Eric Freed, Steve Hughes, and John Coffin for discussions and critical reading of the manuscript; and Dan Larson for the β-globin plasmid and Localize software. This research was supported in part by the Intramural Research Program of the National Institutes of Health, National Cancer Institute, Center for Cancer Research, and by Intramural AIDS Targeted Antiviral Program grant funding (to W.-S.H. and V.K.P.).
Footnotes
The authors declare no conflict of interest.
This article is a PNAS Direct Submission.
This article contains supporting information online at www.pnas.org/lookup/suppl/doi:10.1073/pnas.1518572113/-/DCSupplemental.
References
- 1.Chen J, et al. High efficiency of HIV-1 genomic RNA packaging and heterozygote formation revealed by single virion analysis. Proc Natl Acad Sci USA. 2009;106(32):13535–13540. doi: 10.1073/pnas.0906822106. [DOI] [PMC free article] [PubMed] [Google Scholar]
- 2.Nikolaitchik OA, et al. Dimeric RNA recognition regulates HIV-1 genome packaging. PLoS Pathog. 2013;9(3):e1003249. doi: 10.1371/journal.ppat.1003249. [DOI] [PMC free article] [PubMed] [Google Scholar]
- 3.Moore MD, et al. Dimer initiation signal of human immunodeficiency virus type 1: Its role in partner selection during RNA copackaging and its effects on recombination. J Virol. 2007;81(8):4002–4011. doi: 10.1128/JVI.02589-06. [DOI] [PMC free article] [PubMed] [Google Scholar]
- 4.Chin MP, Rhodes TD, Chen J, Fu W, Hu WS. Identification of a major restriction in HIV-1 intersubtype recombination. Proc Natl Acad Sci USA. 2005;102(25):9002–9007. doi: 10.1073/pnas.0502522102. [DOI] [PMC free article] [PubMed] [Google Scholar]
- 5.Skripkin E, Paillart JC, Marquet R, Ehresmann B, Ehresmann C. Identification of the primary site of the human immunodeficiency virus type 1 RNA dimerization in vitro. Proc Natl Acad Sci USA. 1994;91(11):4945–4949. doi: 10.1073/pnas.91.11.4945. [DOI] [PMC free article] [PubMed] [Google Scholar]
- 6.Hill MK, et al. The dimer initiation sequence stem-loop of human immunodeficiency virus type 1 is dispensable for viral replication in peripheral blood mononuclear cells. J Virol. 2003;77(15):8329–8335. doi: 10.1128/JVI.77.15.8329-8335.2003. [DOI] [PMC free article] [PubMed] [Google Scholar]
- 7.Moore MD, et al. Probing the HIV-1 genomic RNA trafficking pathway and dimerization by genetic recombination and single virion analyses. PLoS Pathog. 2009;5(10):e1000627. doi: 10.1371/journal.ppat.1000627. [DOI] [PMC free article] [PubMed] [Google Scholar]
- 8.Rein A. Nucleic acid chaperone activity of retroviral Gag proteins. RNA Biol. 2010;7(6):700–705. doi: 10.4161/rna.7.6.13685. [DOI] [PMC free article] [PubMed] [Google Scholar]
- 9.Kutluay SB, Bieniasz PD. Analysis of the initiating events in HIV-1 particle assembly and genome packaging. PLoS Pathog. 2010;6(11):e1001200. doi: 10.1371/journal.ppat.1001200. [DOI] [PMC free article] [PubMed] [Google Scholar]
- 10.Kutluay SB, et al. Global changes in the RNA binding specificity of HIV-1 gag regulate virion genesis. Cell. 2014;159(5):1096–1109. doi: 10.1016/j.cell.2014.09.057. [DOI] [PMC free article] [PubMed] [Google Scholar]
- 11.D’Souza V, Summers MF. How retroviruses select their genomes. Nat Rev Microbiol. 2005;3(8):643–655. doi: 10.1038/nrmicro1210. [DOI] [PubMed] [Google Scholar]
- 12.Lu K, Heng X, Summers MF. Structural determinants and mechanism of HIV-1 genome packaging. J Mol Biol. 2011;410(4):609–633. doi: 10.1016/j.jmb.2011.04.029. [DOI] [PMC free article] [PubMed] [Google Scholar]
- 13.Jouvenet N, Lainé S, Pessel-Vivares L, Mougel M. Cell biology of retroviral RNA packaging. RNA Biol. 2011;8(4):572–580. doi: 10.4161/rna.8.4.16030. [DOI] [PMC free article] [PubMed] [Google Scholar]
- 14.Jouvenet N, Simon SM, Bieniasz PD. Imaging the interaction of HIV-1 genomes and Gag during assembly of individual viral particles. Proc Natl Acad Sci USA. 2009;106(45):19114–19119. doi: 10.1073/pnas.0907364106. [DOI] [PMC free article] [PubMed] [Google Scholar]
- 15.Keane SC, et al. RNA structure. Structure of the HIV-1 RNA packaging signal. Science. 2015;348(6237):917–921. doi: 10.1126/science.aaa9266. [DOI] [PMC free article] [PubMed] [Google Scholar]
- 16.Axelrod D. Total internal reflection fluorescence microscopy in cell biology. Traffic. 2001;2(11):764–774. doi: 10.1034/j.1600-0854.2001.21104.x. [DOI] [PubMed] [Google Scholar]
- 17.Rhodes T, Wargo H, Hu WS. High rates of human immunodeficiency virus type 1 recombination: Near-random segregation of markers one kilobase apart in one round of viral replication. J Virol. 2003;77(20):11193–11200. doi: 10.1128/JVI.77.20.11193-11200.2003. [DOI] [PMC free article] [PubMed] [Google Scholar]
- 18.Rhodes TD, Nikolaitchik O, Chen J, Powell D, Hu WS. Genetic recombination of human immunodeficiency virus type 1 in one round of viral replication: Effects of genetic distance, target cells, accessory genes, and lack of high negative interference in crossover events. J Virol. 2005;79(3):1666–1677. doi: 10.1128/JVI.79.3.1666-1677.2005. [DOI] [PMC free article] [PubMed] [Google Scholar]
- 19.Chen J, et al. Cytoplasmic HIV-1 RNA is mainly transported by diffusion in the presence or absence of Gag protein. Proc Natl Acad Sci USA. 2014;111(48):E5205–E5213. doi: 10.1073/pnas.1413169111. [DOI] [PMC free article] [PubMed] [Google Scholar]
- 20.Nikolaitchik O, Rhodes TD, Ott D, Hu WS. Effects of mutations in the human immunodeficiency virus type 1 Gag gene on RNA packaging and recombination. J Virol. 2006;80(10):4691–4697. doi: 10.1128/JVI.80.10.4691-4697.2006. [DOI] [PMC free article] [PubMed] [Google Scholar]
- 21.Dilley KA, et al. Determining the frequency and mechanisms of HIV-1 and HIV-2 RNA copackaging by single-virion analysis. J Virol. 2011;85(20):10499–10508. doi: 10.1128/JVI.05147-11. [DOI] [PMC free article] [PubMed] [Google Scholar]
- 22.Kaye JF, Lever AM. Nonreciprocal packaging of human immunodeficiency virus type 1 and type 2 RNA: A possible role for the p2 domain of Gag in RNA encapsidation. J Virol. 1998;72(7):5877–5885. doi: 10.1128/jvi.72.7.5877-5885.1998. [DOI] [PMC free article] [PubMed] [Google Scholar]
- 23.Ku PI, et al. Identification of pauses during formation of HIV-1 virus like particles. Biophys J. 2013;105(10):2262–2272. doi: 10.1016/j.bpj.2013.09.047. [DOI] [PMC free article] [PubMed] [Google Scholar]
- 24.Muriaux D, De Rocquigny H, Roques BP, Paoletti J. NCp7 activates HIV-1Lai RNA dimerization by converting a transient loop-loop complex into a stable dimer. J Biol Chem. 1996;271(52):33686–33692. doi: 10.1074/jbc.271.52.33686. [DOI] [PubMed] [Google Scholar]
- 25.Sardo L, et al. The dynamics of HIV-1 RNA near the plasma membrane during virus assembly. J Virol. 2015;89(21):10832–10840. doi: 10.1128/JVI.01146-15. [DOI] [PMC free article] [PubMed] [Google Scholar]
- 26.Ivanchenko S, et al. Dynamics of HIV-1 assembly and release. PLoS Pathog. 2009;5(11):e1000652. doi: 10.1371/journal.ppat.1000652. [DOI] [PMC free article] [PubMed] [Google Scholar]
- 27.Coulon A, et al. Kinetic competition during the transcription cycle results in stochastic RNA processing. eLife. 2014;3:3. doi: 10.7554/eLife.03939. [DOI] [PMC free article] [PubMed] [Google Scholar]
- 28.Houman F, Diaz-Torres MR, Wright A. Transcriptional antitermination in the bgl operon of E. coli is modulated by a specific RNA binding protein. Cell. 1990;62(6):1153–1163. doi: 10.1016/0092-8674(90)90392-r. [DOI] [PubMed] [Google Scholar]
- 29.Fusco D, et al. Single mRNA molecules demonstrate probabilistic movement in living mammalian cells. Curr Biol. 2003;13(2):161–167. doi: 10.1016/s0960-9822(02)01436-7. [DOI] [PMC free article] [PubMed] [Google Scholar]
- 30.Shcherbo D, et al. Bright far-red fluorescent protein for whole-body imaging. Nat Methods. 2007;4(9):741–746. doi: 10.1038/nmeth1083. [DOI] [PubMed] [Google Scholar]
- 31.Zenklusen D, Larson DR, Singer RH. Single-RNA counting reveals alternative modes of gene expression in yeast. Nat Struct Mol Biol. 2008;15(12):1263–1271. doi: 10.1038/nsmb.1514. [DOI] [PMC free article] [PubMed] [Google Scholar]
Associated Data
This section collects any data citations, data availability statements, or supplementary materials included in this article.


