Significance
Calcium ions serve as intracellular signals controlling many aspects of cell behavior. Here, we create fusions of genetically encoded calcium indicators and cell surface Orai calcium channels that report calcium influx through the channel. These fluorescent fusion proteins will allow us to see in living cells Orai signals that underlie cell functions, especially those essential for mounting an adaptive immune response. Their output is bright enough to record the intermittent openings of a single Orai channel for the first time to our knowledge. Our recordings reveal several patterns of channel activity, including oscillations. These responses help us understand Orai channels as molecular machines, and our work enables Orai calcium signals to be identified, mapped, and related to the functional systems of the body.
Keywords: CRAC channel, Orai, Stim, store-operated Ca2+ entry, local Ca2+
Abstract
Orai1 comprises the pore-forming subunit of the Ca2+ release-activated Ca2+ (CRAC) channel. When bound and activated by stromal interacting molecule 1 (STIM1), an endoplasmic reticulum (ER)-resident calcium sensor, Orai1 channels possess high selectivity for calcium but extremely small conductance that has precluded direct recording of single-channel currents. We have developed an approach to visualize Orai1 activity by fusing Orai1 to fluorescent, genetically encoded calcium indicators (GECIs). The GECI–Orai1 probes reveal local Ca2+ influx at STIM1–Orai1 puncta. By whole cell recording, these fusions are fully functional as CRAC channels. When GECI–Orai1 and the CRAC-activating domain (CAD) of STIM1 were coexpressed at low levels and imaged using a total internal reflectance fluorescence microscope, cells exhibited sporadic fluorescence transients the size of diffraction-limited spots and the brightness of a few activated GECI proteins. Transients typically rose rapidly and fell into two classes according to duration: briefer “flickers” lasting only a few hundred milliseconds, and longer “pulses” lasting one to several seconds. The size, intensity, trace shape, frequency, distribution, physiological characteristics, and association with CAD binding together demonstrate that GECI–Orai1 fluorescence transients correspond to single-channel Orai1 responses. Single Orai1 channels gated by CAD, and small Orai1 puncta gated by STIM1, exhibit repetitive fluctuations in single-channel output. CAD binding supports a role in open state maintenance and reveals a second phase of CAD/STIM1 binding after channel opening. These first recordings of single-channel Orai1 currents reveal unexpected dynamics, and when paired with CAD association, support multiple single-channel states.
In eukaryotic cells, calcium ions (Ca2+) are a primary means of controlling protein-based molecular machines (1). Receptor stimulation leads to two phases of cytoplasmic Ca2+ signals in many cell types: a transient release of Ca2+ from the endoplasmic reticulum (ER) mediated by 1,4,5 inositol trisphosphate (IP3), and a subsequent more sustained Ca2+ influx through ion channels in the plasma membrane (PM) (2). These two phases are linked; depletion of Ca2+ from the ER lumen acts as a signal to open Ca2+ channels in the PM. This process, called store-operated calcium entry (SOCE), is mediated by a two-component channel consisting of the pore-forming subunit, Orai, and the ER resident Ca2+ sensor, stromal interacting molecule (STIM) (3, 4). Upon ER Ca2+ store depletion, STIM translocates to ER–PM junctions, where it binds, clusters, and opens Orai channels in the PM at signaling structures called puncta. Ca2+ influx through Orai1 is an essential and widely used signal that initiates and regulates motility, gene transcription, and cytokine secretion and underlies adaptive immune responses (5, 6). The presence of three Orai genes (Orai1, -2, and -3) and two STIM genes (STIM1 and STIM2) with somewhat different properties contributes to the utility and diversity of this signaling mechanism.
Orai channels are unrelated to other ion channels and possess a characteristic biophysical fingerprint: a very small conductance estimated at ∼10 fS (femtosiemens), 1,000-fold selectivity of Ca2+ over Na+, conduction of monovalent cations in the absence of Ca2+, and inward rectification (3, 4). Individual Orai proteins contain four transmembrane domains and in the closed state assemble as threefold symmetric hexamers (7). For gating, STIM1 binds to at least two sites on the cytoplasmic face of Orai1, strongly to a C-terminal site just after TM4 and weakly to an N-terminal site just before TM1 (3, 4). These binding sites have been mapped to an ∼100 amino acid domain in STIM1, termed Ca2+ release-activated Ca2+ (CRAC)-activating domain (CAD) or STIM1 Orai activating region (SOAR), that when coexpressed opens Orai1 channels in the absence of ER store depletion (8, 9). In addition, Orai3 can be opened in a STIM-independent manner by application of 2-aminoethyl diphenylborinate (2-APB) (3, 4).
The properties of Orai1 channels, including pore size, cation permeability, conductance levels, and Ca2+-dependent inactivation (CDI), vary markedly, depending upon the ratio of STIM1 to Orai1 expression in transfected cells (10–12) and in self-activating tandem Orai1–STIM1 constructs (13) These studies point to multiple conducting states triggered by STIM1 binding. The number, activation sequence, and steady-state heterogeneity of these states are central issues for understanding the function and output of Orai1. These issues might be resolved by analysis of single Orai1 channels, yet despite successes in biophysical and molecular characterization, the very low unitary conductance has precluded direct recording of single-channel currents.
Optical recording of channel currents offers an alternative to whole-cell patch-clamp recording. One approach involves loading cells with Ca2+ indicators and visualizing the influx of Ca2+ through well-separated single channels in the PM (14). However, it has been validated for Ca2+ fluxes of 100 fA (femtoamperes), ∼100 times the conductance of Orai1 in 2 mM Ca2+ estimated from noise analysis (15). In another approach a genetically encoded Ca2+ indicator (GECI) was fused to a Ca2+ permeable ion channel, in this case the purinergic receptor P2X, where it reported channel activity in transfected cells (16). Whereas this approach, also used in a recent study of Cav2.2 channels (17), did not attempt to record from individual channels, it is attractive because of the great improvements in GECIs over the last 3–4 y (18, 19).
Here we describe the construction and characterization of fusions of genetically encoded calcium indicators with Orai proteins. These fusions report calcium influx at STIM1–Orai1 puncta in transfected cells with high dynamic range. Moreover, their brightness allows the activity of single Orai1 channels to be recorded optically by total internal reflectance microscopy. Such recordings, representing, to our knowledge, the first single-channel records for CRAC/Orai1 channel activity, provide evidence of multiple conductance states of the open channel and periodic fluctuations in Orai1 activity.
Results
Local Ca2+ Entry Monitored by Tethering a Genetically Encoded Ca2+ Indicator to Orai1.
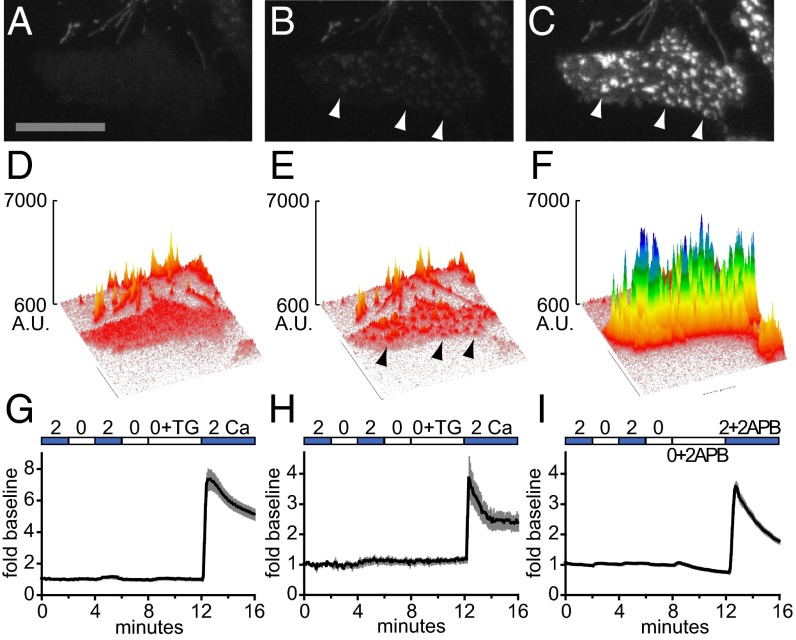
We fused fluorescent genetically encoded calcium indicators to Orai1 to detect Orai-associated calcium influx locally in the cytoplasmic nanodomain adjacent to the membrane. The GECO (genetically encoded Ca2+-indicators for optical imaging) and GCaMP series of recently published, single fluorescent protein GECIs were chosen based upon their brightness, dynamic range, and Kd values for Ca2+ binding (18, 19). GECOs, like GCaMPs, are tripartite fusion proteins that use the Ca2+-dependent binding of a C-terminally fused calmodulin to an N-terminally fused target peptide from myosin light chain kinase (M13) to drive fluorescence of a centrally positioned circularly permuted fluorescent protein. N-terminal GECO–Orai1 fusion constructs were transiently cotransfected with STIM1 into human embryonic kidney (HEK) 293A cells and imaged using total internal reflectance fluorescence (TIRF) microscopy. Transfected cells were assessed by shifting the extracellular Ca2+ concentration and depleting ER calcium stores using the sarcoplasmic/endoplasmic reticulum calcium ATPase (SERCA) pump blocker thapsigargin (TG). The green fluorescent G–GECO1–Orai1 exhibited diffuse expression in the basal plasma membrane (Fig. 1 A and D), which was largely unchanged by shifting between 0 mM Ca2+ + EGTA (0 Ca) and 2 mM Ca2+ (2 Ca). Addition of TG led to clustering of G–GECO1–Orai1 into puncta (Fig. 1 B and E). Readdition of extracellular Ca2+ (2 mM) led to an immediate, large increase in brightness of G–GECO1–Orai1, detected at puncta (Fig. 1 C and F). The fluorescence time course for the entire basal surface of the cell is shown in Fig. 1G; importantly, no change in G–GECO1–Orai1 signal accompanied depletion of Ca2+ from ER stores. Whole-cell electrophysiological recording indicated that the G–GECO1–Orai1 fusion is fully functional as a CRAC channel (Fig. S1).
Fig. 1.
GECI–Orai fusions target to puncta and report calcium influx in transfected cells. (A–C) TIRF micrographs of a HEK 293A cell transiently transfected with G–GECO1–Orai1 and STIM1 and imaged in 2 Ca (A), after 3.5 min in 0 Ca + 2 µM TG (B), and after shift to 2 Ca (C). Arrowheads indicate selected puncta. (Scale bar, 20 µm.) (D–F) Surface plots of the micrographs in A–C, respectively, indicated as arbitrary units (A.U.). Arrowheads indicate the same puncta indicated in B and C. (G and H) Time courses of G–GECO1–Orai1 plotted as mean fold baseline versus time (black lines) in HEK 293A cells (G; n = 26) and resting human T cells (H; n = 9) transiently cotransfected with STIM1 and treated with 2 µM TG. (I) Time course of G–GECO1–Orai3 plotted as mean fold baseline versus time (black line) in transiently transfected HEK 293A cells (n = 24) treated with 100 µM 2-APB. For G–I, gray bars indicate ± SEM.
Fig. S1.
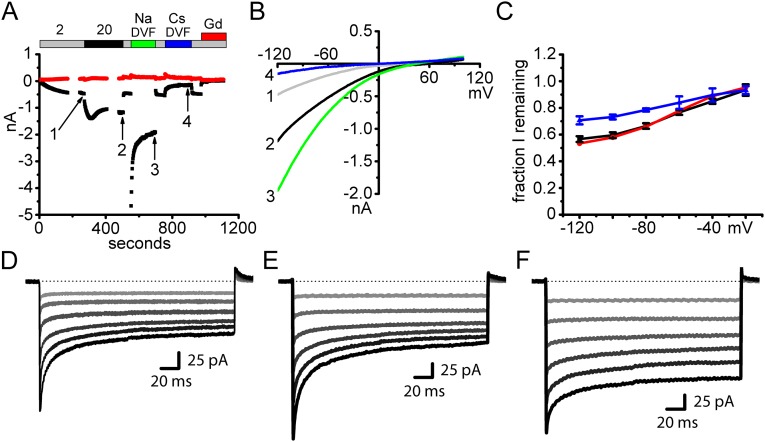
GECI–Orai1 is fully functional as a CRAC channel. (A) Time course of G–GECO1–Orai1 plotted as current amplitude (nA) versus time upon whole-cell break-in of an HEK 293A cell cotransfected with STIM1. Store release was activated by the presence of IP3 in the patch pipet. Note that the current amplitude doubled in 20 Ca and further increased and then inactivated in Na DVF and was blocked by Cs DVF and Gd3+. These responses are typical of native CRAC current and coexpressed STIM1 + Orai1 current. (B) I–V relationships corresponding to the time points indicated by the numbered arrows in A. Selectivity for Ca2+ was unaffected by fusion to G–GECO1, as demonstrated by strong inward rectification characteristic of Orai1. (C) Fraction of inward current remaining in 20 Ca after fast inactivation plotted versus test potential. Peak and adapted currents were designated at 3 ms and 215 ms, respectively, after the start of the test pulse. G–GECO1–Orai1 indicated by black (n = 9 cells), EGFP–Orai1 by red (n = 1 cell), and flag-Orai1 by blue (n = 3 cells). G–GECO1–Orai1 exhibited normal Ca2+ dependent inactivation that was largest at hyperpolarizing membrane potentials. (D–F) Example traces from C of sweeps from −120 mV (black) to 20 mV (light gray) at 20 mV intervals for G–GECO1–Orai1 (D), EGFP–Orai1 (E), and flag–Orai1 (F).
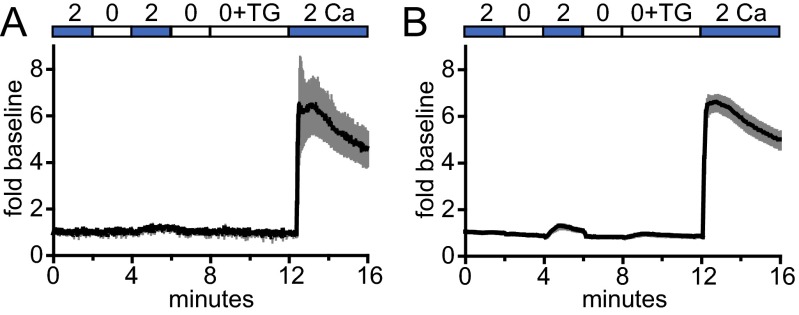
Other GECI–Orai fusions functioned in a similar manner. When cotransfected with STIM1, G–GECO1.2–Orai1 and the C-terminal fusion Orai1–GCaMP6f exhibited a similar fold increase upon Ca2+ readdition following TG treatment (Fig. S2 A and B, respectively). Furthermore, resting human T cells exhibited similar, though smaller, changes in G–GECO1–Orai1 fluorescence in response to TG treatment and Ca2+ readdition (Fig. 1H). Membrane targeting was confirmed by confocal microscopy (Fig. S3). In fusions of G–GECO1 to Orai3, an alternative method of activating channel activity with 2-APB in the absence of store depletion revealed a rapid and diffuse increase in fluorescence (Fig. 1I). GECI–Orai fusions offer a flexible approach to optically monitor Orai channel activity in transfected cells.
Fig. S2.
Different configurations of GECI–Orai1 detect Ca2+ influx in transfected cells. Time courses of G–GECO1.2–Orai1 (A; n = 5 cells) and Orai1–GCaMP6f (B; n = 14 cells) plotted as mean fold baseline versus time (black lines) in HEK 293 cells transiently cotransfected with STIM1 and treated with 2 µM TG. Gray bars indicate ± SEM.
Fig. S3.
Membrane targeting of G–GECO1–Orai1. (A and B) Transmitted light image (A) and single confocal optical section (B) of a resting human T-cell transfected with G–GECO1–Orai1 and human STIM1 5 min after treatment with 1 µM ionomycin. (C) Profile plot of the green channel fluorescence intensity as a function of distance along the red line in B. (Scale bar, 5 µm.)
Detection of Unitary Ca2+ Signals by Optical Recording at Diffraction-Limited Spots.
We noted that the availability of these probes for imaging Orai1-associated Ca2+ influx might present an opportunity to optically record from single Orai1 channels. Ca2+-bound G–GECO1 is about half as bright as the green fluorescent protein EGFP (19). Because a fully activated hexamer should be as bright as three EGFP molecules, a microscope capable of imaging single fluorescent proteins should be able to image activation of a single Orai1 channel. In this case, construct function, and not single-channel brightness, should be the limiting factor in optically recording from single Orai1 channels.
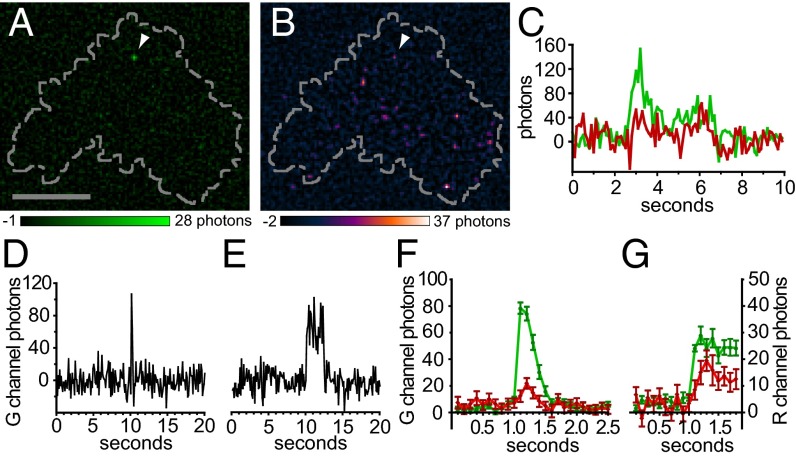
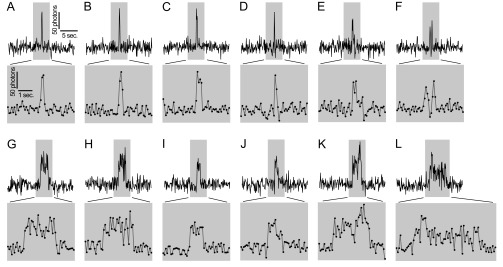
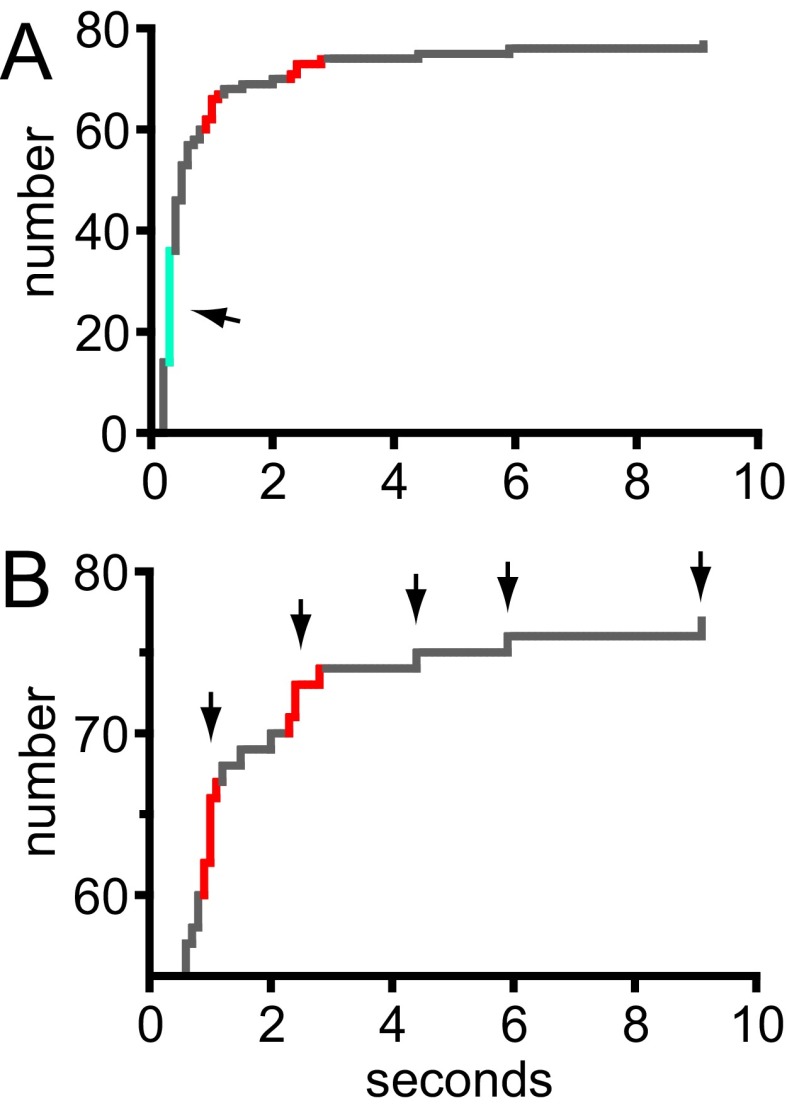
HEK 293A cells were transfected with G–GECO1–Orai1 using a previously established, low-expression protocol that results in clearly resolved single Orai1 channels in the basal PM (20). Cells were cotransfected with the CAD fragment of STIM1 fused to the red fluorescent protein mCherry and imaged using TIRF microscopy 3–6 h after transfection. Candidate transfected cells were identified by low expression of mCherry–CAD, and these were imaged at 10 frames per second in 2 Ca. Occasional cells exhibited sporadic green fluorescence transients the size of diffraction-limited spots and the brightness of a few activated G–GECO1 proteins (Fig. 2A). A total of 94 transients from four cells were selected for analysis. Transients typically rose to a maximum within 100–200 ms and fell into two classes according to duration. Briefer transients (n = 58) lasted only a few hundred milliseconds, and these were termed “flickers” (Fig. 2 D and F and Fig. S4 A–F). The intensity of many flickers rose to a characteristic level. Longer transients (n = 36) lasted from ∼1 to several seconds (Fig. 2E and Fig. S4 G–L). These were termed “pulses.” The shape of many traces, with rapid rise and fall, was reminiscent of single channels recorded by electrophysiology. Separate populations of flickers and pulses could be distinguished by plotting the cumulative distribution of transient length (Fig. S5). Fluorescent spots indicative of Orai1 fluorescent transients were more frequent within the footprint of analyzed cells than outside them (P < 0.0001, χ2 test).
Fig. 2.
Discrete G–GECO1–Orai1 fluorescence transients activated by low-level CAD expression are candidate single-channel responses. (A and B) TIRF images of a HEK 293A cell cotransfected with low levels of G–GECO1–Orai1 (A) and mCherry–CAD (pseudocolored in B). Arrowhead in A indicates a single green fluorescence transient present at the basal surface of the cell (indicated by the dashed line). Note the presence of a fluorescence transient in the corresponding position (arrowhead) in the simultaneously acquired red channel (B). (Scale bar, 10 µm.) (C) Plots of green (G channel) and red (R channel) fluorescence over time for the transient indicated in A and B. (D and E) Example traces of short (flickers, D) and long (pulses, E) fluorescence transients. (F and G) Rises in G–GECO1–Orai1 fluorescence are accompanied by corresponding rises in mCherry–CAD fluorescence. Traces were aligned by the rise in green fluorescence and the mean green and red channel fluorescence intensity was plotted versus time for flickers (F; n = 58) and pulses (G; n = 27). Error bars indicate ± SEM.
Fig. S4.
Representative optical single channel Orai1 traces. (A–L) G–GECO1–Orai1 traces from HEK 293A cells cotransfected with low levels of mCherry–CAD and TIRF imaged in 2 Ca. Excerpts of 20-s are shown in the Top rows for traces containing flickers (A–F) and pulses (G–L). Regions highlighted in gray correspond to expanded 5-s excerpts are shown below. Note that D and G correspond to the traces shown in Fig. 2 D and E, respectively, but with higher temporal resolution.
Fig. S5.
Two classes of low-CAD G–GECO1–Orai1 transients. (A) The duration of G–GECO1–Orai1 fluorescence transients plotted as a cumulative distribution. The center of flicker durations is shown in turquoise (also indicated by arrow) and the centers of clusters of pulse durations are shown in red. (B) Expanded view of the cumulative distribution plotted in A. Black arrows indicate clusters of pulse durations and durations of longer individual pulses. Pulse durations appeared to occur at an interval of ∼1.5 s, starting at ∼1 s.
In some cases the position of these green fluorescent G–GECO1–Orai1 transients corresponded to the position of a readily apparent red fluorescent mCherry–CAD transient (Fig. 2B), and a clear temporal correspondence could be seen between the signals (Fig. 2C). If these candidate Ca2+ influx events were systematically caused by CAD binding, a rise in colocalized mCherry–CAD fluorescence would accompany them. When traces of G–GECO1–Orai1 were aligned by the rise in green fluorescence (Fig. 2 F and G), red mCherry–CAD fluorescence increased relative to baseline (for both flickers and pulses, P < 0.0001, paired T test). A total of 50% of G–GECO1–Orai1 transients (95% confidence interval of 36–62%) were accompanied by a detectable increase in mCherry–CAD fluorescence. mCherry–CAD and G–GECO1–Orai1 fluorescence rose simultaneously, although the magnitude of the mCherry–CAD signal in the first 100-ms image frame was small. These observations are consistent with CAD binding to individual G–GECO1–Orai1 channels in the membrane, resulting in rapid channel opening within 100 ms. Of note, mCherry–CAD fluorescence continued to rise after the onset of the G–GECO1–Orai1 transient, reaching a peak 100 ms (flickers) to 200 ms (pulses) later (Fig. 2 F and G). However, photobleaching limits the magnitude and temporal resolution of the measured mCherry–CAD signals (SI Materials and Methods).
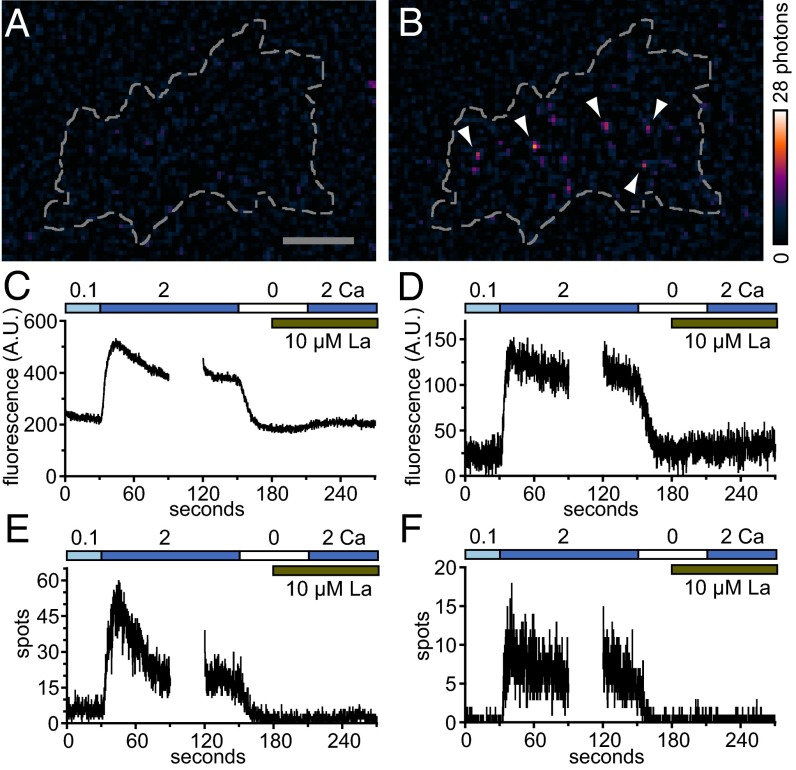
The low frequency of G–GECO1–Orai1 fluorescence transients seen in these experiments (∼1 every 5–10 s) precluded detailed physiological characterization. However, higher expression levels of CAD (∼20-fold greater) raised the frequency of G–GECO1–Orai1 fluorescence transients to levels suitable for testing (∼100-fold greater). Experiments were performed with fusions of G–GECO1.2 to wild-type Orai1 (WT) as well as Orai1 containing Y80E, a mutation that lacks Ca2+-dependent fast inactivation (21). G–GECO1.2–Orai1 was chosen for its higher Kd (1,150 nM versus 750 nM for G–GECO1) (19), which is expected to reduce background response to resting Ca2+ levels. Shifting from 0.1 to 2 mM extracellular Ca2+ led to the essentially immediate appearance of discrete G–GECO1.2–Orai1 fluorescence transients (Fig. 3 A and B). As in the previous low-CAD experiments, these transients were the size of diffraction-limited spots and the brightness of a few activated G–GECO1.2 proteins. Transients were widely distributed across the basal plasma membrane (Fig. S6). The rise in the fluorescence of cell footprints (Fig. 3 C and D) and the number of identified spots (Fig. 3 E and F) document the onset of single-channel responses in aggregate upon shift to 2 mM Ca2. Shift to 0 mM Ca2+ rapidly reversed these signals. Addition of the trivalent cation La3+ blocked subsequent response to 2 mM Ca2+. The rise in the number of fluorescence spots upon shift to 2 mM Ca2+ corresponded to a rise in the frequency of identified fluorescence transients that was well above background. For example, for the cell responses graphed in Fig. 3, patterns of fluorescence corresponding to flickers were observed 30-fold (Y80E) and 600-fold (WT) more frequently than expected by chance. Because of the size, intensity, trace shape, frequency, distribution, physiological characteristics, and association with CAD binding, we conclude that G–GECO1– and G–GECO1.2–Orai1 fluorescence transients correspond to single-channel Orai1 responses.
Fig. 3.
Discrete G–GECO1.2–Orai1 fluorescence transients activated by high-level CAD expression exhibit physiological characteristics of Orai1 channels. (A and B) TIRF images of a HEK 293A cell cotransfected with low levels of G–GECO1.2–Orai1 Y80E and high levels of CAD in 0.1 Ca (A) and 2 s later after shift to 2 Ca (B). Arrowheads indicate selected fluorescence transients present at the basal surface of the cell (indicated by the dashed line). (Scale bar, 5 µm.) (C and D) Time courses of mean green fluorescence (arbitrary units, A.U.) of the cell basal surface of HEK 293A cells transiently cotransfected with either wild-type Orai1 (C) or Y80E (D) G–GECO1.2–Orai1 and high levels of CAD. (E and F) Time course of the number of fluorescent spots identified from the cell basal surface of HEK 293A cells transiently cotransfected with either WT (E) or Y80E (F) G–GECO1.2–Orai1 and high levels of CAD. C and E and D and F are individual cell responses representative of n = 3 and n = 5 cells, respectively.
Fig. S6.
Spatial distribution of high-CAD G–GECO1.2–Orai1 transients. G–GECO1.2–Orai1 Y80E fluorescent spots were identified after shift from 0.1 to 2 Ca and their cumulative positions plotted over 2.5-s (A), 10-s (B), and 40-s (C) intervals for a representative HEK 293A cell. Note that the spots are distributed across the basal surface of the cell in A and progressively fill the basal surface over time (B and C). (Scale bar, 10 µm, for A–C.)
Fluctuations in Optical Single-Channel Recordings.
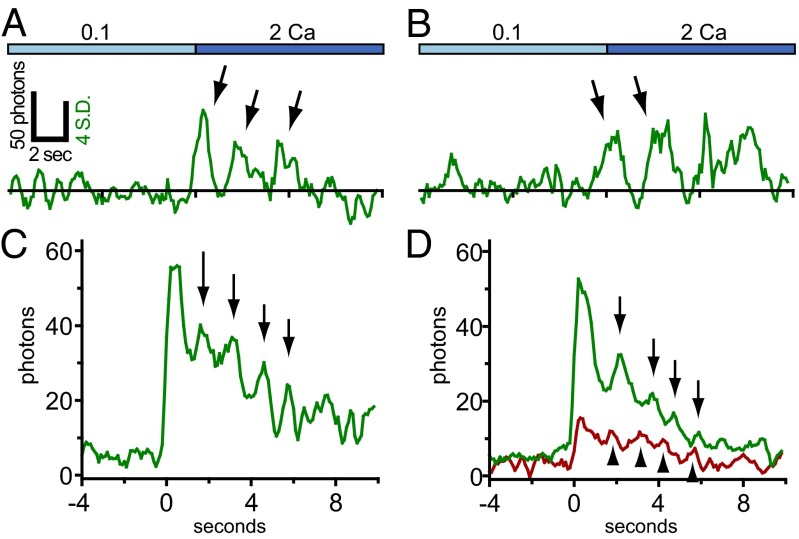
Examination of temporally smoothed single-channel traces taken shortly after shift to 2 mM Ca2+ reveals that responses fluctuate markedly over time (Fig. 4 A and B and Fig. S7 A–F). Traces were typically composed of multiple pulses, each ∼1–2 s long and spaced by brief pauses of <1 s. Responses typically lasted from 3 to 10 s. Consecutive pulses often shared a characteristic size, shape, and interpulse interval (Fig. 4 A and B and Fig. S7 A–F). Occasionally, stepwise increases in the intensity of pulses were observed, consistent with stepwise activation of individual G–GECO1.2 molecules tethered to the same channel (Fig. S7 G and H). In many cases, the intensity of pulses decreased to baseline after each fluctuation. Whereas most responses fluctuated over time, unitary pulses and flickers were observed as well (Fig. S7 I–L). Some open channels moved slowly in the plasma membrane, although the dramatic fluctuations in intensity precluded tracking. On the whole, channels exhibited consistent responses incompatible with large-scale movement-induced variations in signal intensity. This pattern of movement is compatible with restricted diffusion of channels within membrane “corrals” similar in size to our regions of interest (22). Single-particle tracking of EGFP-labeled Orai1 channels coexpressed with CAD indicates that some Orai1 channels are confined in this way over periods of several seconds (Fig. S8).
Fig. 4.
Fluctuations in single-channel optical recordings. (A and B) Example single channel traces of G–GECO1.2–Orai1 WT upon shift from 0.1 to 2 Ca. Arrows in A and B indicate fluctuations in the fluorescence traces. The right vertical scale bar indicates 4 SD above the mean cell basal surface fluorescence. Traces are four-frame moving averages and are aligned by the initial rise in fluorescence after shift to 2 Ca. (C and D) Averaged aligned pulses exhibit apparently periodic fluctuations. (C) Pulses (n = 14) from high-level CAD-expressing cells (n = 3) possessing “clean” rises were aligned by the initial rise and averaged, and the mean fluorescence intensity was plotted versus time. Arrows indicate consecutive peaks. (D) Pulses (n = 27) from low-level CAD-expressing cells (n = 4) were aligned by the initial rise and the mean fluorescence intensity was plotted versus time. Downward arrows indicate consecutive peaks in the GECO1–Orai1 WT trace and upward arrowheads indicate offset consecutive peaks in the mCherry–CAD trace. Plots are four-frame moving averages.
Fig. S7.
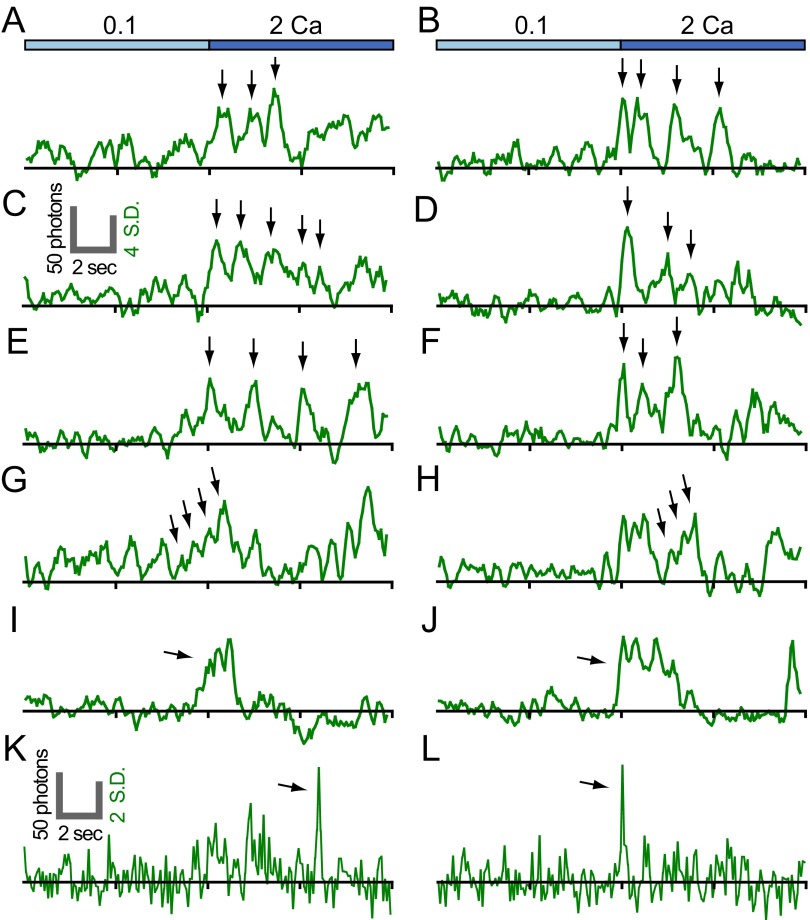
Fluctuations in single-channel optical recordings from high-CAD cells. Example traces of G–GECO1.2–Orai1 WT (A, C, E, G, I, and K) and GECO1.2–Orai1 Y80E (B, D, F, H, J, and L) upon shift from 0.1 to 2 Ca. Arrows in A–F indicate fluctuations in the fluorescence traces. Arrows in G and H indicate progressive increases in fluorescence intensity consistent with progressive activation of G–GECO1.2–Orai1 subunits of a single channel. Arrows in I and J indicate discrete pulses and in K and L, discrete flickers. The right vertical scale bar indicates 4 SD (C; applies to A–J) and 2 SD (K; applies to K and L) above the mean cell basal surface fluorescence. (A–J) Four-frame moving averages. (K and L) Raw with background subtraction. Traces are aligned by the initial rise in fluorescence after shift to 2 Ca.
Fig. S8.
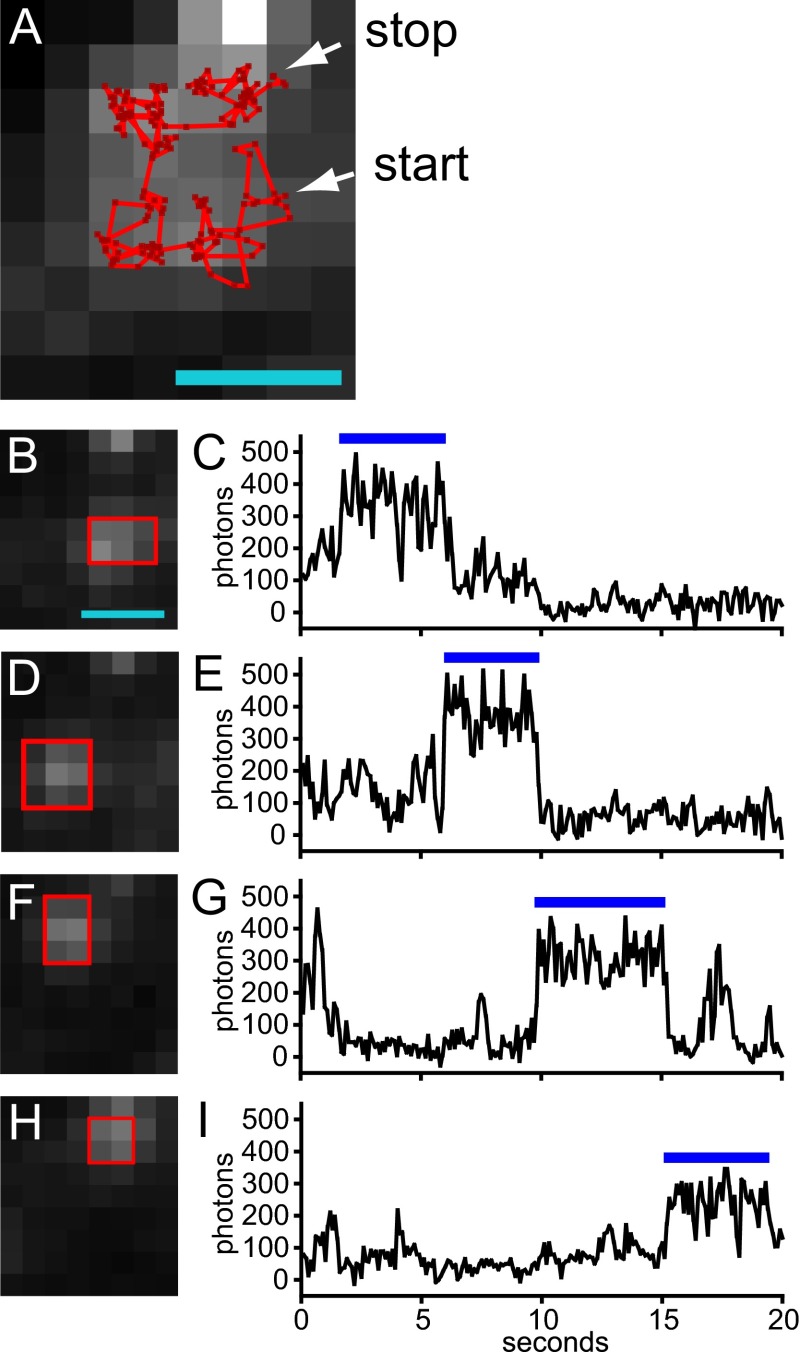
Some EGFP–Orai1 channels exhibit restricted diffusion in the presence of CAD. EGFP–Orai1 and mCherry–CAD were cotransfected into HEK 293A cells and imaged using TIRF microscopy. (A) Single-particle track of a single EGFP–Orai1 channel imaged at 10 frames per second. Channel positions are indicated by dark red points, and trajectories between points are indicated by bright red lines. Starting and stopping points are indicated by white arrows. The average of 200 consecutive frames of green fluorescence is shown in grayscale. Note that the single channel visits four adjacent regions during the imaging period. (B–I) Average green fluorescence images of the channel from A in particular regions (B, D, F, and H) and plots of fluorescence intensity for these regions (C, E, G, and I). The blue bars above the plots indicate the time of residence for the channel, and green fluorescence images were averaged over this period. The ROIs indicated by the red boxes were used for measuring channel intensity. Note that the time of residence for each region is ∼4–6 s and channel intensity does not fluctuate appreciably during these intervals. (Scale bar for A and B, 1 µm; applies also to D, F, and H.) A total of 34 of 111 channels from three cells exhibited diffusion within restricted domains. Note that hindered diffusion of Orai1 channels has been previously noted in Wu et al. (42) and CAD coexpression with Orai1 decreases the rate of diffusion (8).
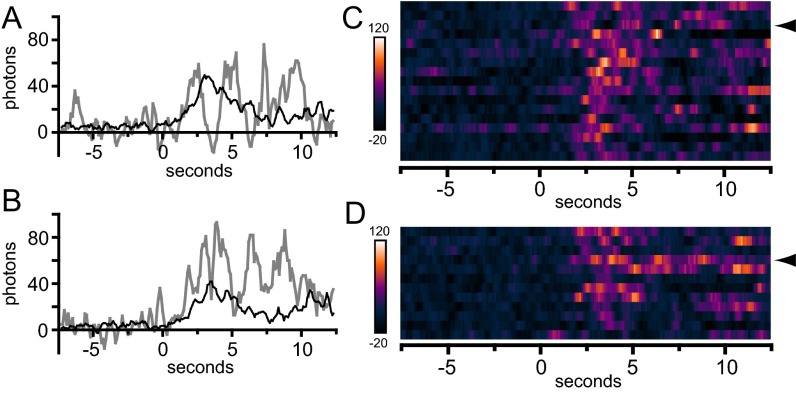
Averaging of pulses aligned by their rise should reveal whether fluctuations in intensity are periodic. We reasoned that we would obtain better alignment if we selected traces with a clear and discrete rise, consistent with resting, closed-state channels newly opened by binding of CAD. When these “clean” G–GECO1.2–Orai1 pulses (for example, Fig. 4A) are aligned, the average trace exhibits a clear periodicity of ∼1.5 s (Fig. 4C; n = 14). Oscillations were not synchronized across a given cell. Averaging pulses aligned by absolute time did not reveal the large fluctuations seen in individual pulses, and the small fluctuations observed were not systematically aligned with pulse rise or fall (Fig. S9 A and B). Comparison by conversion of traces into adjacent, intensity-mapped image strips, in the manner of Demuro and Parker (14), did not reveal a clear alignment of trace peaks or troughs (Fig. S9 C and D). Moreover, single EGFP-labeled Orai1 channels coexpressed with CAD did not exhibit large fluctuations in intensity, suggesting that repetitive movements of the membrane along the z axis are not responsible for fluctuations in G–GECO–Orai1 output (Fig. S8). Notably, the pulses from low CAD cells, when aligned, produce an average trace that also exhibits a clear periodicity of ∼1.5 s (Fig. 4D; n = 27). In this case periodicity is seen for mCherry–CAD as well, although the amplitude is smaller. Starting with the second mCherry–CAD peak, these peaks precede the G–GECO1–Orai1 peaks by ∼0.5 s. These responses are consistent with the periodic opening and closing of independent single Orai1 channels.
Fig. S9.
Temporal distribution of high-CAD G–GECO1.2–Orai1 transients. A and C are taken from a representative G–GECO1.2–Orai1 WT transfected cell, and B and D are taken from a G–GECO1.2–Orai1 Y80 transfected cell. (A and B) Graphs comparing a single trace containing pulses (gray lines) with the average of the remaining traces (black lines) identified in the first 2 (A) or 3 (B) seconds of response after shift from 0.1 to 2 Ca, indicated at time = 0 s. (C and D) Traces visualized by mapping intensity using pseudocoloring. Traces from n = 17 (C) and n = 12 (D) separate pulses are represented as rows of elongated pixels. Each pixel corresponds to the intensity from a single 100-ms frame after application of a four-frame moving average. Time = 0 s indicated the initiation of shift from 0.1 to 2 Ca. Arrowheads in C and D indicate the rows corresponding to the individual traces plotted in A and B, respectively.
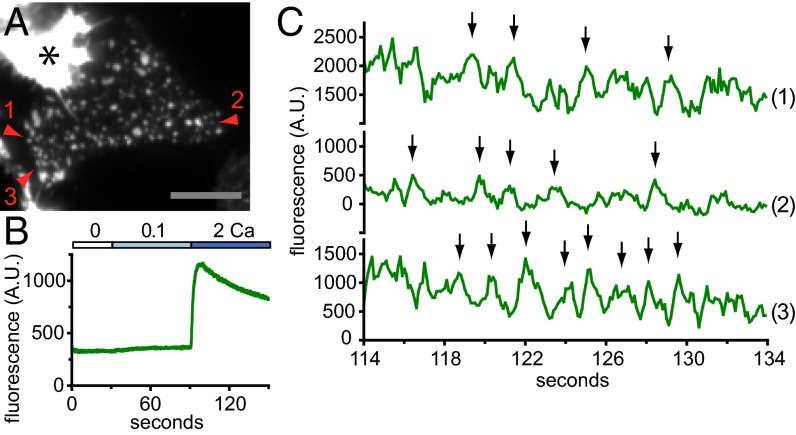
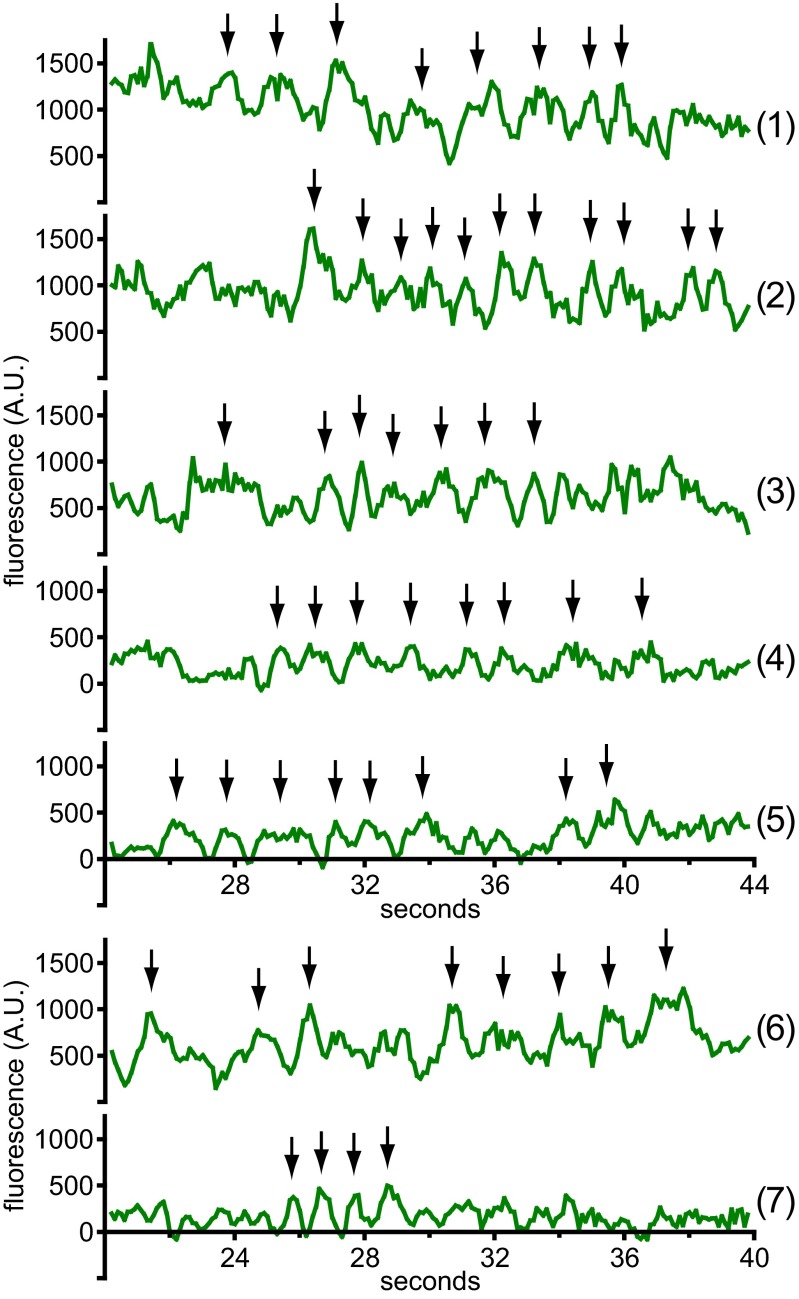
We sought to determine whether the fluctuations in Ca2+ influx we observed for single channels gated by CAD occurred for channels assembled into puncta and gated by full-length STIM1. HEK 293A cells were cotransfected with G–GECO1.2–Orai1 and STIM1, and clustering of Orai1 into puncta was initiated through store depletion using TG in 0 mM Ca2+ (Fig. 5A). Puncta imaged at high speed (10 frames per second) exhibited the expected rise in fluorescence upon shift from 0.1 to 2 mM Ca2+ (Fig. 5B). Cells possessing roughly 500–1,000 open G–GECO1.2–Orai1 channels per footprint, distributed among ∼100–150 puncta, were chosen for analysis. Single-pixel traces from puncta fluctuated markedly (Fig. 5C and Fig. S10). Upon application of a four-frame moving average filter, deviations lasting ∼1.5 s could be detected (Fig. 5C, trace 1). These features are reminiscent of fluctuating single-channel responses observed in macroscopic whole-cell currents. Similar features could be seen in single-pixel traces taken from the edge of dim puncta, and their emergence from baseline marks them as presumptive single-unit events (Fig. 5C, trace 2 and Fig. S10, traces 4, 5, and 7). More extended bouts of periodic fluctuations were observed as well (Fig. 5C, trace 3 and Fig. S10, traces 1–3 and 6). Puncta responses across the cell were not synchronized (compare Fig. 5C, traces 1–3, Fig. S10, traces 1–5, and Fig. S10, traces 6–7). All three experimental configurations, (i) low open probability due to low CAD expression; (ii) high open probability due to high CAD expression; and (iii) Orai1 puncta gated by STIM1, feature repetitive fluctuations in single-channel output.
Fig. 5.
Single-channel activity in Orai1 puncta. (A) Green channel TIRF image of a HEK 293A cell cotransfected with G–GECO1.2–Orai1 and STIM1 after treatment with 2 µM TG. Average of 200 consecutive frames taken for the time period plotted in C. Red arrowheads indicate puncta plotted in C. (Scale bar, 10 µM.) Asterisk indicates a brightly fluorescent adjacent cell. (B) Time course of mean G–GECO1.2–Orai1 fluorescence of the cell footprint (in arbitrary units, A.U.) imaged at 10 frames per second. (C) Single-pixel intensity records of G–GECO1.2–Orai1 at the center of a punctum (1), at the edge of a dim punctum (2), and in a punctum that exhibits periodic fluorescence intensity fluctuations (3). Arrows indicate characteristic peaks repeated in each trace. Time corresponds to the plot in B. Traces are four-frame moving averages. Responses taken from one of n = 3 cells.
Fig. S10.
Single-channel activity in Orai1 puncta. Single-pixel intensity records from two cells coexpressing STIM1 and G–GECO1.2–Orai1 WT (traces 1–5) and G–GECO1.2–Orai1 Y80E (traces 6 and 7) after shift from low to high Ca. Traces 1–3, and 6 correspond to intensity fluctuations above baseline, consistent with multiple channels per recording, and traces 4, 5, and 7 correspond to intensity fluctuations that arise from baseline, consistent with a single channel per recording. Arrows indicate successive peaks. Time corresponds to the number of seconds after shift from 0.1 Ca to 2 Ca (traces 1–5) or 1 Ca (traces 6 and 7). Traces are four-frame moving averages.
SI Materials and Methods
Cell Culture and Reagents.
Human embryonic kidney (HEK) 293A cells (Invitrogen) were incubated at 37 °C, 5% (vol/vol) CO2, and maintained in DMEM (Lonza) supplemented with 10% fetal bovine serum (Omega Scientific) and 2 mM l-glutamine (Sigma-Aldrich). Human peripheral blood leukocytes (PBLs) were isolated from blood of voluntary healthy donors by Ficoll-Hypaque (gradient = 1.077 g/dL) density gradient centrifugation. Human CD3+ T cells were isolated from PBLs by negative selection using the EasySep Human CD3+ Isolation kit (Stem Cell Technologies), according to manufacturer instructions and ref. 30. For imaging, cells were plated onto poly l-lysine–coated coverslips (>300 K MW, 0.1 mg/mL in water for HEK 293A cells and 1 mg/mL for human T cells; Sigma-Aldrich). Thapsigargin (Calbiochem) was used at 2 µM and 2-aminoethyl diphenylborinate (2-APB; Sigma-Aldrich) was used at 100 µM.
Molecular Biology and Transfection Conditions.
Plasmids encoding genetically encoded calcium indicators (GECIs) were obtained from Addgene. For N-terminal fusions, the GECIs were amplified via PCR using the N- and C-terminal primers (5′ CACAACCGGTCGCCACCATGGTCGACTCATCACGTC 3′ and 5′ GTCGAGATCTGCTTCGCTGTCATCATTTGTAC 3′) and ligated into the plasmid EGFP–Orai1 (33) AgeI–BglII, replacing the EGFP gene and creating fusions to the human Orai1 gene: G–GECO1–Orai1 and G–GECO1.2–Orai1. A parallel approach starting with EGFP–Orai3 (20) was used to create the fusion G–GECO1–Orai3. G–GECO1.2–Orai1 Y80E was constructed using an Agilent QuikChange Lightning site-directed mutagenesis kit and the oligonucleotide (5′ CTGGCGCAAGCTCGAGTTGAGCCGCGCC 3′) as in ref. 34. For C-terminal fusions, the human Orai1 gene was amplified from EGFP–Orai1 via PCR using the N- and C- terminal primers (5′ ACTCAGATCTCGAGCCACCATGCATCCGGAGCCCGCC 3′ and 5′ TGCAGAATTCGGGCATAGTGGCTGCCGGGCGTC 3′) and ligated into EGFP–N1 (Clontech) XhoI–EcoRI to create Orai1–EGFP. GCaMP6F was amplified via PCR using the N- and C-terminal primers (5′ CACAACCGGTCGCCACCATGGTCGACTCATCACGTC 3′ and 5′ AGTCGCGGCCGCTTTAAAGCTTCGCTGTCATCATTTGTAC 3′) and ligated into Orai1–EGFP AgeI–NotI, replacing EGFP to create Orai1–GCaMP6F. mCherry–CAD was constructed by amplifying the CAD region of STIM1 (amino acids 342–448) (8), using the N- and C-terminal primers (5′ GGAATTCTTATGCTCCAGAGGCCCTTC 3′ and 5′ CGGGATCCTCAATGGTGATGGTGATGATGACCTCCGTGGATGCCAGGGTTGTTG 3′) and ligated into pmCherry–C1 (Clontech) EcorRI–BamHI. This construct contains a 6× His tag on its C terminus. The unlabeled CAD expression construct (CMV–CAD) was produced by amplifying the same region of STIM1 encompassing amino acids 342–448 via PCR using the N- and C-terminal primers (5′ GTGTGAATTCGCCACCATGTATGCTCCAGAGGCCCTTC 3′ and 5′ CTTTGCGGCCGCGGATCCTCAGTGGATGCCAGGGTTGTTG 3′) and ligated into EGFP–N1 EcoRI–NotI, replacing the EGFP gene. For testing of the GECI–Orai1 fusions, an N-terminal myc-tagged human STIM1 expression construct was used (35) and for detecting fluctuations in Ca2+ influx in puncta, mCherry–STIM1 was used (36). The amplified regions of plasmids were verified by sequencing (Eton). Expression of all of the constructs in HEK 293A cells is driven by the cytomegalovirus (CMV) immediate early promoter found in EGFP–C2 (Clontech).
HEK 293A cells were plated in chambers consisting of poly l-lysine–coated coverslips and 18-mm diameter silicone o-rings. Coverslips (Goldseal, Ted Pella) were cleaned by soaking in 100% ethanol, USP grade (Gold Shield Distributors) for at least 1 wk. For high expression, cells were transfected in situ at ∼50% confluence with Lipofectamine 2000 (Invitrogen) as directed by the manufacturer. A total of 1 µg DNA was used (0.33 µg GECI–Orai1 and 0.67 µg STIM1) per coverslip, and transfected cells were imaged the next day. For low-expression imaging of single Orai1 channels, cells were transfected in solution (20). Cells were dissociated from the culture surface with 1× PBS (Corning) + 2 mM EDTA (Gibco), spun down, and resuspended in an equal volume of DMEM + 10% FBS + glutamine. For low-CAD experiments, preformed DNA–lipid complexes containing 4 µg total DNA (400 ng G–GECO1–Orai1, 200 ng mCherry–CAD, and 3.4 µg of the inert carrier plasmid pUC18) were added per 2 mL of cells, and the cells plated. For high-CAD experiments 2 µg total DNA (100 ng G–GECO1.2–Orai1, 200 ng mCherry–CAD, 800 ng CMV–CAD, and 900 ng pUC18) was added per 2 mL of cells. Transfected cells were imaged 3–6 h later. Human T cells were transfected using an Amaxa Nucleofector II (Lonza) according to the manufacturer.
Microscopy and Imaging.
TIRF and near-TIRF imaging was performed on an inverted microscope with a home-built TIRF illumination system. TIRF illumination lasers were introduced into the optical path by way of a micrometer-positioned 5-mm mirror-coated prism placed near the back focal plane of the objective. The microscope system consisted of an Olympus IX81 microscope body, Olympus 60× 1.45 N.A. PlanApoN TIRF objective, Photometrics DualView2 image splitter with Chroma T565lpxr dichroic mirror and Semrock 520/28 and 624/40 emission filters, Photometrics Evolve 512 EMCCD camera, a 488-nm Argon ion laser (12 mW output measured; Ion Laser Technology), a 561-nm solid-state laser (DPSS-type; 56 mW output measured; Lasos), and Prior Proscan motorized stage. Laser light from TIRF illumination that was reflected off the coverslip was stopped by means of a micrometer-driven beam block. Scattered laser light was also attenuated using a Semrock 496-nm long-pass filter. The system was controlled using Metamorph 7 (Molecular Devices) software. Using the 60× TIRF objective, a pixel corresponds to a 267-nm by 267-nm square. Single-molecule imaging illumination intensities were ∼30 and 70 W/cm2 for the 488-nm and 561-nm lasers, respectively, calculated from the measured power output at the back focal plane of the objective. The EMCCD camera was operated at an EM gain of 130 at 100 ms/frame. The EMCCD camera was calibrated weekly to allow intensity readout in photons (21.7 arbitrary units per photon). Two color images were acquired simultaneously using the DualView from samples illuminated simultaneously with both lasers. Cells were imaged at room temperature in Ringer’s solution also known as 2 Ca (in millimoles composed of: 155 NaCl, 4.5 KCl, 1 MgCl2, 2 CaCl2, 10 d-glucose, 5 Hepes), 0 Ca (in millimoles composed of: 155 NaCl, 4.5 KCl, 3 MgCl2, 1 EGTA, 10 d-glucose, 5 Hepes), 0.1 Ca (in millimoles composed of: 155 NaCl, 4.5 KCl, 2.9 MgCl2, 0.1 CaCl2, 10 d-glucose, 5 Hepes), and 1 Ca (in millimoles composed of: 155 NaCl, 4.5 KCl, 2 MgCl2, 1 CaCl2, 10 d-glucose, 5 Hepes). Solutions were adjusted to pH 7.4 with NaOH. Perfusion in high-CAD expression single-channel imaging experiments was performed using a micromanipulator-mounted manifold, which only perfused the region surrounding the field of view and which has a solution exchange time of ∼2 s.
Image Analysis.
Image processing was performed using ImageJ 1.41 (public-domain open-source software developed by the NIH). For high-expression experiments, mean background levels were measured separately for each cell from adjacent cell-free regions and subtracted from the mean value of manually selected regions of interest (ROIs) that encompassed the cell. For single-channel experiments, background-subtracted images were produced by subtracting a 2-pixel radius median filtered image from the raw image. Single-channel intensity measurements (traces) were obtained from background-subtracted images using a 2 × 2 pixel ROI at a fixed position. Fluorescence transients were defined as lasting at least two consecutive frames. For low-CAD–expression experiments, fluorescence transients were identified manually. For high-CAD–expression experiments, fluorescence transients were identified automatically when single pixels exceeded a fixed threshold, typically 2.25 SDs above the cell mean, for two consecutive frames. Upon transient identification, the 2 × 2 pixel ROI for intensity measurements was positioned manually. The 2 × 2 pixel ROIs that were above background in 0.1 Ca were excluded from analysis. These were more frequent in G–GECO1.2–Orai1 WT than in G–GECO1.2–Orai1 Y80E transfected cells. Red and green channel images were aligned to the nearest pixel using images of 0.1-µm diameter microspheres labeled with multiple fluorophores (TetraSpeck, Life Technologies). Cell footprints in single-channel imaging experiments were identified by averaging hundreds of consecutive TIRF image frames.
Bleedthrough of green channel G–GECO1–Orai1 emission into the red channel was calculated from TIRF images of HEK 293A cells cotransfected with high levels of G–GECO1–Orai1 and STIM1 after treatment with 2 µM TG and readdition of 2 Ca Ringer’s solution. Cells were illuminated with only the 488-nm laser, and simultaneous green and red channel images were acquired. Bleedthrough was calculated by dividing the intensity of cell footprints from background-subtracted red channel images by those of background-subtracted green channel images. The bleedthrough value obtained was 4.1%. Red channel intensity measurements from mCherry–CAD were adjusted by subtracting the product of the corresponding green channel G–GECO1–Orai1 intensity and 0.041.
For reasons that are unclear, our high-CAD traces appeared noisier than our low-CAD traces. To reveal underlying responses, we used a four-frame moving average (also known as a rolling average) to visualize trace dynamics. This caused apparent rise and fall of fluorescence traces to be spread out over four or more frames. Repetitive high-CAD transients were deemed “pulses” because they are longer than flickers, they show the same underlying period as low-CAD pulses, and they exhibit the same intensity as low-CAD pulses.
Spatial and Temporal Distribution of Transients.
For visualizing the spatial distribution of transients, spots identified in G–GECO1.2–Orai1 and high-CAD cotransfected HEK 293A cells were plotted using the spot’s center of mass in Prism 4 (GraphPad Software). For visualizing the temporal distribution of transients, Microsoft Excel spreadsheets, containing pulse traces aligned by absolute time and smoothed using a four-frame moving average, were opened as text images in ImageJ, pseudocolored, and elongated vertically by scaling.
Measurement of Signal and Noise.
For reasons that are unclear, G–GECO–Orai1 WT had higher background fluorescence within the cell footprint than G–GECO–Orai1 Y80E. For the standard 100-ms long image frame in high-CAD single-channel experiments, typical values for the fluorescence background adjacent to cells of interest were 24–28 photons per pixel per frame and within the cell footprint was 35–32 photons per pixel per frame, for WT and Y80E, respectively. The SDs of the within-cell backgrounds were 10 and 9 photons per pixel per frame (WT and Y80E), of which ∼6 photons per pixel per frame corresponded to shot noise. Because images were acquired near the shot noise limit, as a good approximation the variance will scale with the number of photons, and the SD will scale with the square root of the number of photons. This approximation was used for calibrating image scale bars and calculating the frequency of flickers relative to a random distribution. In the 2 × 2 pixel region of interest for measuring fluorescence transients, large flickers and pulses added ∼100 and 75 photons per 4 pixels per frame, respectively, to the within-cell backgrounds of 140–128 photons per 4 pixels per frame for WT and Y80E, respectively. In low-CAD single-channel experiments the transients were similar in size but the background was lower. Low-CAD transients were identified starting at 5 s after the start of image acquisition. The number of open channels in a cell footprint was estimated by measuring the background-selected peak fluorescence of the footprint after shift to 2 Ca and dividing it by the product of the fractional laser power (compared with single-molecule imaging) and the average size of a pulse (∼75 photons per frame).
The fluorescence emitted by a single EGFP molecule (25–50 photons per 4 pixels per frame, for both live and fixed preparations) was determined for our standard acquisition conditions by measuring the stepwise loss of fluorescence of EGFP–Orai1 due to photobleaching. This value was used to determine that multiple G–GECO1 and G–GECO1.2 proteins are activated in large fluorescence transients, given that G–GECO1 is roughly half and G–GECO1.3 is roughly a third as bright as EGFP (19). The dynamic range of unfused G–GECO1 and G–GECO1.2 in vitro are 25× and 23×, respectively (between no Ca2+ and saturating levels of Ca2+ (19). The dynamic range of G–GECO–Orai1 fusions is a least 7× (Fig. 1G and Fig. S1A). Given that many fluctuating transients return to baseline between consecutive pulses, we expect the dynamic range of G–GECO–Orai1 is close to 25×. In this case, a nonactivated G–GECO–Orai1 hexameric channel should produce at most 6 photons/frame.
Response Time of GECO–Orai1 Fusions.
We see two plausible explanations for why the responses of GECIs in Orai1 fusions may be shorter than the in vitro off rate of the sensors (for both G–GECO1 and G–GECO1.2 alone, 0.7⋅s−1). The first involves anchoring of one end of the GECI to the channel. After tagged channels close, Ca2+ is lost from the calmodulin portion of the GECI. It is known through mutagenesis that Ca2+ unbinding is not the sole determinant of GECI off rate, but that other parts of the GECI, such as the CaM–M13 interface, play prominent roles in determining off- and on-rate kinetics (37). We note that Brownian motion, which in unanchored GECIs would lead to movement of the protein in solution, instead may lead to intramolecular stresses in an anchored GECI that promote a more rapid change in GECI structure (opening of the central circularly permuted fluorescent protein) and thus a more rapid loss of fluorescence.
The second involves movements of subdomains that accompany channel closing. The first (N-terminal) alpha helix of Orai channels forms the pore, and so the N-terminal domain is tethered to the central axis of the channel. A leading model for Orai gating movements hypothesizes that the pore helices, and their extensions, swing away from the central axis upon channel opening, and so they must swing back upon channel closing (7). We speculate that this movement accompanying closing leads to contact between adjacent GECI domains or contact with currently unknown proteins associated with the closed state of the channel. This contact in turn leads to rapid inactivation of the GECIs, perhaps by steric hindrance, and rapid loss of fluorescence. Note that in this model, closed channels may hold GECIs in an off state. This may explain, in part, why GECI–Orai1 fusions do not detect Ca2+ released from the ER by blocking SERCA using thapsigargin (Fig. 1G).
Comparison of the Relative Frequency of Flickers.
Flickers were identified in 1-s (G–GECO1.2–Orai1 WT; n = 19) or 2-s (G–GECO1.2–Orai1 Y80E; n = 17) intervals just after shift to 2 Ca. To simplify the calculation, flickers were defined as lasting three 100-msec image frames. The average number of photons per flicker was 170 for WT and 140 for Y80E. Because flicker intensities were measured from 4 pixels (2 × 2 pixel ROI) lasting a total of 3 frames, the Z score was calculated by dividing the average number of photons per flicker by the product of the SD of the within-cell background noise in photons per pixel and √12. The frequency of a background event of equal or greater intensity was calculated from this Z score using Wolfram Alpha (Wolfram Research) assuming a standard normal distribution. The actual frequency of flickers (flickers per pixel per frame) was calculated by dividing by the number of flickers by the product of the number of pixels in the cell footprint and the number of frames (10 for WT and 20 for Y80E). This allowed the ratio of actual flicker frequency to expected random event frequency to be calculated.
Association and Relative Timing of G–GECO1–Orai1 and mCherry–CAD Transients.
To assess whether mCherry–CAD binding was associated with G–GECO–Orai1 transients, the average mCherry–CAD intensity of 3 frames was used for flickers and 10 frames for pulses. Baseline values were the average of frames −70 to −21 before the G–GECO–Orai1 transient rise (at 10 frames per second). The fraction of G–GECO1–Orai1 transients accompanied by a mCherry–CAD binding event was calculated for the combined set of flickers and pulses by curve fitting. We noted that the histogram of mCherry–CAD intensities in the test period (average of frames 1–3) appeared to consist of three subpopulations, which we attribute to 0, 1, and 2 active mCherry fluorophores. In this case, the intensity of a single mCherry protein would be 11–15 photons/100-ms frame, consistent with the photophysical properties of mCherry and our red channel acquisition conditions. We determined the size of the nonfluorescent subpopulation by fitting the histogram to the sum of three Gaussian distributions using Prism 4 from GraphPad Software (R2 = 0.962). Curve fitting was constrained by fixing the mean of the nonfluorescent test subpopulation to the mean of the baseline (frames −70 to −21).
The mCherry–CAD signal was unexpectedly small, and the failure rate for detecting association between the G–GECO1–Orai1 and mCherry–CAD signals was high (50%). These observations suggest that a substantial fraction of mCherry fluorophores might be photobleached, immature, or otherwise nonfluorescent in these free-running imaging experiments. Therefore, the appearance of mCherry–CAD fluorescence after the start of a G–GECO1–Orai1 transient does not exclude a role for CAD in channel opening. Instead, G–GECO1–Orai1 channels may have been opened by mCherry–CAD dimers that were already bleached or otherwise nonfluorescent.
Nevertheless, mCherry–CAD fluorescence did rise detectably in the first frame of a G–GECO1–Orai1 transient. The single-frame increase in mCherry–CAD fluorescence was significant for flickers (P = 0.031); however, for pulses, the increase was not significant (P = 0.096), even though the mean single-frame mCherry–CAD signal was larger than the mean signals from all of the previous 100 image frames. These observations are consistent with CAD binding to individual G–GECO1–Orai1 channels in the membrane, resulting in rapid channel opening within 100 ms. These data, and our calculations, disfavor an alternative explanation in which CAD does not open Orai1 channels, but merely maintains the open state. Finally, the subsequent increases in mCherry–CAD intensity after channel opening were significant as well (for flickers, P = 0.046, and for pulses, P = 0.0015).
Statistical Analysis.
Except for the electrophysiology analysis, intensity calculations were performed in Microsoft Excel, and statistical testing, SEM calculation, and graphing were performed in Prism 4 (GraphPad Software). Electrophysiology analysis and graphing were performed in OriginPro 7.5 (OriginLab).
For χ2 testing, the density of fluorescence spots within the cell footprint was compared with the area surrounding the cell footprint. Background-subtracted images were produced by subtracting a 2-pixel radius median filtered image from the raw image. The image stack was spatial filtered using a 0.7-pixel radius Gaussian smooth and temporally filtered using a two-frame running minimum filter. A spot map was created using a maximum brightness projection of 850 consecutive filtered images. Spots were identified using particle analysis with 1–5 pixels at least 11.5 photons above background. The cell footprint was identified by averaging hundreds of consecutive mCherry–STIM1 images. For each cell, the designated surrounding area was roughly similar in size. To compensate for contributions of cell background fluorescence to the identification of fluorescent spots, as well as the effects of uneven illumination, the intensity of the area surrounding the cell of interest was normalized by multiplying by the mean value of the footprint divided by the mean value of the surrounding area.
Single-Particle Tracking.
HEK 293A cells were cotransfected with EGFP–Orai1 or Orai1–EGFP and mCherry–CAD and imaged 4–5 h later using TIRF microscopy. Images were acquired at 10 frames per second with a 488-nm laser illumination intensity of ∼30 W/cm2. Images were screened by eye, and isolated channels exhibiting anomalous diffusion were selected for single-particle tracking. Automated subpixel particle tracking of restricted regions (typically 2–4 µm on a side) was performed with the SpotTracker plugin for ImageJ (38, 39). Raw fluorescence images were used for single-particle tracking, and fixed background-subtracted raw images were used for intensity measurement. The intensity of isolated channels confined to “corrals” was roughly similar to channels that exhibited less constrained diffusion. To ensure adequate sampling and tracking, all channels in the vicinity of particular channels tracked above were tracked using TrackMate (40), which is based upon the methods established in ref. 41. Tracks exhibiting restricted diffusion were classified by eye, based upon the pattern of movement over 5–10 s.
Whole-Cell Recording.
To validate channel function of G–GECO1–Orai1, HEK 293A cells cotransfected with STIM1 were assessed by whole-cell patch-clamp electrophysiology. Transfected cells developed IP3-induced currents similar in amplitude to cells transfected with other tagged and untagged Orai1 constructs (Fig. S1A). Current amplitudes were increased to a similar degree by elevation of extracellular Ca2+ concentration from 2 to 20 mM, and removal of external divalent cations resulted in a large current carried by Na+ and a much smaller Cs+ current (Fig. S1B). Like native CRAC current and currents recapitulated by coexpression of STIM1 and Orai1, the G–GECO1–Orai1 channel was blocked by Gd3+. Currents in 20 mM Ca2+ and in divalent-free external solution (DVF) exhibited the expected slow declines from peak values. Selectivity for Ca2+ was also unaffected, as demonstrated by strong inward rectification characteristic of Orai1 (Fig. S1B). Furthermore, G–GECO1–Orai1 exhibited normal Ca2+-dependent inactivation (CDI) that was largest at hyperpolarizing membrane potentials (Fig. S1 C–F). By these measures, the fusion of G–GECO1 to the N terminus of Orai1 is fully functional as a CRAC channel.
Transfected HEK 293A cells were chosen for whole-cell recording by expression of the G–GECO1–Orai1, 48 h after transfection. Patch-clamp experiments were performed at room temperature with standard whole-cell recording. Patch pipettes had ∼2 MΩ resistances. Recordings were made from cells only with high input resistance (>1 GΩ). The series resistance (2–7 MΩ) was compensated by 80%. Membrane potentials were corrected for the liquid junction potential of 10 mV. Currents were recorded using an EPC-9 patch-clamp amplifier (HEKA). Data were acquired by PULSE software (HEKA) and were digitally filtered at 1 kHz for analysis and display. Our protocol alternates voltage ramps lasting 220 ms from –120 to +100 mV and pulses of 220 ms to –120 mV every 2 s from a holding potential of 0 mV. Time courses represent inward and outward currents recorded at –120 and +100 mV, respectively. Five current–voltage (I–V) curves were averaged for display. Current during application of 50 μM LaCl3 or 10 μM GdCl3 was used for leak subtraction. Leak-subtracted I–V curves are displayed. Data were analyzed and graphed in OriginPro 7.5. All external solutions were pH adjusted to 7.4 by NaOH or CsOH and have osmolality adjusted to 325 mosm/kg by sucrose. LaCl3, and/or GdCl3 were added to Ringer’s solution as needed. Compositions of external solutions are described in ref. 35. A total of 50 μM LaCl3, and 10 μM GdCl3 was added as required. The internal solution for experiments consisted of (in millimoles): 138 CsAsp, 8 Mg-gluconate2, 2 CsCl, 15 Hepes, 10 Cs4BAPTA (1,2-bis(2-aminophenoxy)ethane-N,N,N′,N′-tetraacetic acid), pH adjusted to 7.2 by CsOH, and 20 μM inositol 1,4,5 trisphosphate (IP3; added fresh on the day of the experiment from 10 mM stock; Cayman Chemical Company). Peak and adapted currents were designated at 3 ms and 215 ms, respectively, after the start of the test pulse. The fraction of current remaining was calculated by dividing the adapted current by the peak current. STIM1 and Orai1 constructs were transfected at a 2:1 molar ratio, but the ratio of STIM1:Orai1 protein expression in a given cell was not measured.
Confocal Microscopy.
T cells transfected with G–GECO1–Orai1 and STIM1 were imaged live after application of 1 µM ionomycin (Calbiochem) in 2 mM Ca2+ Ringer’s solution using a Zeiss LSM 700 laser scanning confocal microscope. Acquisition settings included use of a 63× Plan-Apochromat 1.4 N.A. objective, 488-nm laser, and transmitted light detector. The pinhole was set to 1 Airy unit and the image was acquired at 200 nm/pixel.
Discussion
Orai channels in the PM are gated by direct physical contact of STIM C termini extending from the cytoplasmic face of the ER. This subcellular organization, combined with the extremely small conductance of Orai channels, has limited progress in understanding these channels and their contributions to cell signaling. The method we introduce here offers new approaches to probing Orai function in puncta and at the single-channel level. GECI–Orai fusions selectively and directly report Orai channel activity, and we use these to record from single Orai1 channels for the first time to our knowledge. Our results reveal an unexpected complexity in Orai1 gating dynamics.
Orai1 channel activity was imaged directly at high dynamic range in cells transfected with GECI–Orai fusions. By electrophysiology, fusion to GECIs resulted in little or no change in Orai1 function. These fusions target appropriately, report Ca2+ influx in HEK 293A cells and human T cells, and report activation of Orai channels by different mechanisms: STIM-dependent activation of Orai1 and STIM-independent activation of Orai3 by 2-APB. This approach should identify restricted, asynchronous, or transient Orai-mediated signaling events in a variety of cells. Indeed, we identify stereotyped fluctuations in Ca2+ influx that varied asynchronously between puncta of the same cell. Using TIRF microscopy, the sensitivity of this approach extends to nanodomains consisting of only a single channel open for a few hundred milliseconds.
Several lines of evidence indicate that fluorescent transients found in cells expressing GECO–Orai1 and CAD correspond to single-channel opening events. These include their size, intensity, trace shape, frequency, distribution, physiological characteristics, and association with CAD binding. To what extent are our recorded traces an accurate readout of channel activity? Clearly, our understanding is limited by uncertainty in the response function of GECO–Orai1 fusions. For example, these fusions detect the existence of an entire class of responses, flickers, as short of 200–300 ms, which is substantially shorter than predicted based upon the in vitro off rates measured for G–GECO1 and G–GECO1.2 alone (for both, 0.7⋅s−1; SI Materials and Methods) (19). Changes in GECI performance have been attributed to protein fusion or subcellular environment in other studies as well (17, 23). Despite the uncertainty, these traces can be used to support or constrain models of channel activity and gating that involve large, long-lasting, or repetitive Ca2+ fluxes.
We have named our method of optical patch clamping, genetically targeted single-channel optical recording (GT-SCOR). Previously developed approaches use chemical Ca2+ indicators loaded into the cytoplasm, such as Fluo-4, to detect influx of Ca2+ from individual channels. In GT-SCOR, channels are targeted directly by fusion to a GECI, resulting in a 1:1 covalent association of channel subunits and sensors positioned nanometers from the pore. This arrangement is exquisitely sensitive; indeed, we find robust Orai1 single-channel responses, whereas a similar Fluo-4 based, optical patch-clamping study in Xenopus oocytes was unable to detect sites of store operated Ca2+ influx that occur at clusters of Orai channels (24). However, Fluo-4–based optical patch clamping has inherent advantages, including essentially no photobleaching, the ability to image channels without tagging, and the ability to image currents much faster (up to 500 Hz) than GT-SCOR.
Fluorescence transients fell into two classes according to duration: shorter flickers and longer pulses. Do these two classes correspond to two modes of channel gating? At the level of elemental gating movements, they may not be different. Pulses could be made up of bursts of flickers, and this possibility might be detected by imaging more rapidly. Nevertheless, the extended temporal correlations in intensity and duration found in pulses, and missing from more unitary flickers, support the existence of two functional modes of Orai1 channel gating.
Structural information provided by the crystal structure of Drosophila Orai (7) and the NMR structure of the cytoplasmic coiled-coil portion of STIM1 (25) has led to the hypothesis that STIM1 holds Orai1 in an open state. If this hypothesis is correct, then continuous STIM1 binding is necessary to keep the channel open. Alternatively, STIM1 binding may be necessary to initiate channel opening, but not to maintain the open state. Our data support the former model: for pulses, binding persists for many hundreds of milliseconds after channel opening (Figs. 2G and 4D).
Most low-CAD G–GECO1–Orai1 transients rise within a single 100-ms frame (Fig. 2 F and G). CAD binding, however, occurs more progressively, reaching a peak 100 ms (for flickers) to 200 ms (for pulses) later. These data point to the existence of a second phase of CAD binding that occurs after channel opening. The ratio of STIM1:Orai1 determines many channel properties (10–13); this second phase of binding likely changes CAD:Orai1 stoichiometry and Orai1 conducting state. In addition, these two phases of CAD binding delineate steps in a molecular activation/deactivation cascade that accompanies channel gating.
We identified fluctuations of G–GECO1.2–Orai1 signal in puncta formed by coexpression of STIM1 and treatment with TG. At the edge of dim puncta, signals of similar intensity and duration were found rising from baseline. The most straightforward explanation is that they are unitary Orai1 channel events. Given that their trace shape, duration, and period are similar to short pulses, gating by CAD appears to resemble gating by STIM1 in essential aspects.
All three experimental configurations reveal fluctuations in the fluorescence output of single channels with a ∼1.5-s period. The similarity between consecutive large pulses that emerge from baseline indicates that the output of multiple GECO proteins rise and fall in a coordinated manner. Whereas the output of fluorescent proteins “blink” on a variety of time scales, we know of no photophysical process that would lead to a coordinated and periodic output by fluorescent proteins (26). Moreover, a periodic output is not consistent with the expected declining exponential distribution of GECO on state lifetime either. We acknowledge that periodic changes in channel structure or local pH might lead to periodic inactivation of the GECO probes. However, notably, CAD binding fluctuates with a period similar to that seen for Orai1, although to a lesser degree. Taken together, these arguments support the assertion that periodic oscillations in fluorescence transients are due to periodic fluctuation in the activity of single Orai1 channels.
Additional experiments are required to determine the origin of these fluctuations. The outputs of unitary events are not synchronized across puncta, and single-channel responses driven by CAD show no clear evidence of coordination. Fluctuations in Orai1 activity persist in the presence of a mutation that blocks Ca2+-dependent fast inactivation, although other unidentified Ca2+-dependent processes might contribute. Nevertheless, the periodicity in CAD binding makes CAD/STIM1 a prime candidate for driving Orai1 oscillations. Fluctuations in CAD binding are out of phase with and precede Orai1 activity peaks. Given the similarity in output of the three different experimental configurations, we suggest that single Orai1 channels gated by CAD/STIM1 may act as intrinsic oscillators. Oscillations such as these, with a defined period, are due to multistep negative feedback mechanisms and differ mechanistically from stochastically fluctuating responses (27, 28).
The oscillations we observe in Orai1 single-channel activity do not appear to be the output of some upstream signal, but instead a property of the channel and its subcellular environment. This presents difficulties in interpreting the potential consequences, and contributions, of these fluctuations to cellular signaling. Their period is shorter than widely studied IP3-dependent Ca2+ oscillations (tens to hundreds of seconds). Orai1 channels in puncta are surrounded by dozens to hundreds of identical channels that appear to be unsynchronized. This arrangement might be expected to mask single-channel fluctuations. In the absence of coordination, fluctuations would still remain distinct in small puncta with few active channels, as seen in dim puncta in HEK 293A cells. Alternatively, in other cell types, Orai1 single-channel fluctuations may be linked to generate much larger oscillating signals, which might allow for adaptation-dependent readout of Orai1 activity (29).
These first single-channel recordings for Orai1 confirm basic aspects of Orai1 gating models: direct activation and open state maintenance by CAD/STIM1. They support also an unexpected complexity in gating dynamics, with two functional modes, a second phase of CAD/STIM1 binding after channel opening, and an unexpected periodicity in Orai1 single-channel currents. More generally, this work opens the door for functional studies at the single-molecule level on a wide range of Ca2+-dependent signaling mechanisms.
Materials and Methods
Cell Culture and Reagents.
HEK 293A cells (Invitrogen) were cultured as in ref. 20, and human T cells were isolated and transfected as in ref. 30.
Molecular Biology and Transfection Conditions.
Plasmid construction is detailed in SI Materials and Methods. Transfections for single-molecule assays were performed as described in ref. 20.
Microscopy and Imaging.
TIRF and near TIRF imaging were performed on an Olympus IX81 microscope with a home-built TIRF illumination system, Olympus 60× 1.45 N.A. PlanApoN TIRF objective, Photometrics DualView2 image splitter, Photometrics Evolve 512 EMCCD camera, 488-nm Argon ion laser, and a 561-nm solid state laser. See SI Materials and Methods for further details.
Image Processing, Analysis, and Statistical Testing.
Image processing and measurement were performed using ImageJ 1.41; intensity calculations were performed in Microsoft Excel; and statistical testing, SEM calculation, and graphing were performed in Prism 4 (GraphPad Software). For quantification procedures related to signal and noise, see SI Materials and Methods.
Whole-Cell Recording.
Whole-cell recordings were done on transfected HEK 293A cells as described previously (31, 32), using procedures and solutions described in SI Materials and Methods.
Acknowledgments
We thank Luette Forrest and Tobias X. Dong for isolating and transfecting human T cells, Olga Safrina for creating the DNA fusion construct G–GECO1.2–Orai1 Y80E, and Ian Parker for advice on total internal reflectance fluorescence microscopy and comments on the manuscript. This work is supported by NIH Grant R01 NS-14609 (to M.D.C.). Human blood was prepared using support from the National Center for Research Resources and the National Center for Advancing Translational Sciences (NIH Grant UL1 TR000153).
Footnotes
The authors declare no conflict of interest.
This article contains supporting information online at www.pnas.org/lookup/suppl/doi:10.1073/pnas.1523410113/-/DCSupplemental.
References
- 1.Clapham DE. Calcium signaling. Cell. 2007;131(6):1047–1058. doi: 10.1016/j.cell.2007.11.028. [DOI] [PubMed] [Google Scholar]
- 2.Parekh AB, Putney JW., Jr Store-operated calcium channels. Physiol Rev. 2005;85(2):757–810. doi: 10.1152/physrev.00057.2003. [DOI] [PubMed] [Google Scholar]
- 3.Amcheslavsky A, et al. Molecular biophysics of Orai store-operated Ca2+ channels. Biophys J. 2015;108(2):237–246. doi: 10.1016/j.bpj.2014.11.3473. [DOI] [PMC free article] [PubMed] [Google Scholar]
- 4.Prakriya M, Lewis RS. Store-operated calcium channels. Physiol Rev. 2015;95(4):1383–1436. doi: 10.1152/physrev.00020.2014. [DOI] [PMC free article] [PubMed] [Google Scholar]
- 5.Shaw PJ, Feske S. Regulation of lymphocyte function by ORAI and STIM proteins in infection and autoimmunity. J Physiol. 2012;590(Pt 17):4157–4167. doi: 10.1113/jphysiol.2012.233221. [DOI] [PMC free article] [PubMed] [Google Scholar]
- 6.Cahalan MD, Chandy KG. The functional network of ion channels in T lymphocytes. Immunol Rev. 2009;231(1):59–87. doi: 10.1111/j.1600-065X.2009.00816.x. [DOI] [PMC free article] [PubMed] [Google Scholar]
- 7.Hou X, Pedi L, Diver MM, Long SB. Crystal structure of the calcium release-activated calcium channel Orai. Science. 2012;338(6112):1308–1313. doi: 10.1126/science.1228757. [DOI] [PMC free article] [PubMed] [Google Scholar]
- 8.Park CY, et al. STIM1 clusters and activates CRAC channels via direct binding of a cytosolic domain to Orai1. Cell. 2009;136(5):876–890. doi: 10.1016/j.cell.2009.02.014. [DOI] [PMC free article] [PubMed] [Google Scholar]
- 9.Yuan JP, et al. SOAR and the polybasic STIM1 domains gate and regulate Orai channels. Nat Cell Biol. 2009;11(3):337–343. doi: 10.1038/ncb1842. [DOI] [PMC free article] [PubMed] [Google Scholar]
- 10.Hoover PJ, Lewis RS. Stoichiometric requirements for trapping and gating of Ca2+ release-activated Ca2+ (CRAC) channels by stromal interaction molecule 1 (STIM1) Proc Natl Acad Sci USA. 2011;108(32):13299–13304. doi: 10.1073/pnas.1101664108. [DOI] [PMC free article] [PubMed] [Google Scholar]
- 11.McNally BA, Somasundaram A, Yamashita M, Prakriya M. Gated regulation of CRAC channel ion selectivity by STIM1. Nature. 2012;482(7384):241–245. doi: 10.1038/nature10752. [DOI] [PMC free article] [PubMed] [Google Scholar]
- 12.Scrimgeour N, Litjens T, Ma L, Barritt GJ, Rychkov GY. Properties of Orai1 mediated store-operated current depend on the expression levels of STIM1 and Orai1 proteins. J Physiol. 2009;587(Pt 12):2903–2918. doi: 10.1113/jphysiol.2009.170662. [DOI] [PMC free article] [PubMed] [Google Scholar]
- 13.Li Z, et al. Graded activation of CRAC channel by binding of different numbers of STIM1 to Orai1 subunits. Cell Res. 2011;21(2):305–315. doi: 10.1038/cr.2010.131. [DOI] [PMC free article] [PubMed] [Google Scholar]
- 14.Demuro A, Parker I. “Optical patch-clamping”: Single-channel recording by imaging Ca2+ flux through individual muscle acetylcholine receptor channels. J Gen Physiol. 2005;126(3):179–192. doi: 10.1085/jgp.200509331. [DOI] [PMC free article] [PubMed] [Google Scholar]
- 15.Zweifach A, Lewis RS. Mitogen-regulated Ca2+ current of T lymphocytes is activated by depletion of intracellular Ca2+ stores. Proc Natl Acad Sci USA. 1993;90(13):6295–6299. doi: 10.1073/pnas.90.13.6295. [DOI] [PMC free article] [PubMed] [Google Scholar]
- 16.Richler E, Chaumont S, Shigetomi E, Sagasti A, Khakh BS. Tracking transmitter-gated P2X cation channel activation in vitro and in vivo. Nat Methods. 2008;5(1):87–93. doi: 10.1038/nmeth1144. [DOI] [PMC free article] [PubMed] [Google Scholar]
- 17.Tay LH, et al. Nanodomain Ca2+ of Ca2+ channels detected by a tethered genetically encoded Ca2+ sensor. Nat Commun. 2012;3:778. doi: 10.1038/ncomms1777. [DOI] [PMC free article] [PubMed] [Google Scholar]
- 18.Chen TW, et al. Ultrasensitive fluorescent proteins for imaging neuronal activity. Nature. 2013;499(7458):295–300. doi: 10.1038/nature12354. [DOI] [PMC free article] [PubMed] [Google Scholar]
- 19.Zhao Y, et al. An expanded palette of genetically encoded Ca2+ indicators. Science. 2011;333(6051):1888–1891. doi: 10.1126/science.1208592. [DOI] [PMC free article] [PubMed] [Google Scholar]
- 20.Demuro A, et al. Subunit stoichiometry of human Orai1 and Orai3 channels in closed and open states. Proc Natl Acad Sci USA. 2011;108(43):17832–17837. doi: 10.1073/pnas.1114814108. [DOI] [PMC free article] [PubMed] [Google Scholar]
- 21.Mullins FM, Park CY, Dolmetsch RE, Lewis RS. STIM1 and calmodulin interact with Orai1 to induce Ca2+-dependent inactivation of CRAC channels. Proc Natl Acad Sci USA. 2009;106(36):15495–15500. doi: 10.1073/pnas.0906781106. [DOI] [PMC free article] [PubMed] [Google Scholar]
- 22.Kusumi A, et al. Paradigm shift of the plasma membrane concept from the two-dimensional continuum fluid to the partitioned fluid: High-speed single-molecule tracking of membrane molecules. Annu Rev Biophys Biomol Struct. 2005;34:351–378. doi: 10.1146/annurev.biophys.34.040204.144637. [DOI] [PubMed] [Google Scholar]
- 23.Heim N, Griesbeck O. Genetically encoded indicators of cellular calcium dynamics based on troponin C and green fluorescent protein. J Biol Chem. 2004;279(14):14280–14286. doi: 10.1074/jbc.M312751200. [DOI] [PubMed] [Google Scholar]
- 24.Demuro A, Smith M, Parker I. Single-channel Ca(2+) imaging implicates Aβ1-42 amyloid pores in Alzheimer’s disease pathology. J Cell Biol. 2011;195(3):515–524. doi: 10.1083/jcb.201104133. [DOI] [PMC free article] [PubMed] [Google Scholar]
- 25.Stathopulos PB, et al. STIM1/Orai1 coiled-coil interplay in the regulation of store-operated calcium entry. Nat Commun. 2013;4:2963. doi: 10.1038/ncomms3963. [DOI] [PMC free article] [PubMed] [Google Scholar]
- 26.Ha T, Tinnefeld P. Photophysics of fluorescent probes for single-molecule biophysics and super-resolution imaging. Annu Rev Phys Chem. 2012;63:595–617. doi: 10.1146/annurev-physchem-032210-103340. [DOI] [PMC free article] [PubMed] [Google Scholar]
- 27.Novák B, Tyson JJ. Design principles of biochemical oscillators. Nat Rev Mol Cell Biol. 2008;9(12):981–991. doi: 10.1038/nrm2530. [DOI] [PMC free article] [PubMed] [Google Scholar]
- 28.Skupin A, et al. How does intracellular Ca2+ oscillate: By chance or by the clock? Biophys J. 2008;94(6):2404–2411. doi: 10.1529/biophysj.107.119495. [DOI] [PMC free article] [PubMed] [Google Scholar]
- 29.Behar M, Dohlman HG, Elston TC. Kinetic insulation as an effective mechanism for achieving pathway specificity in intracellular signaling networks. Proc Natl Acad Sci USA. 2007;104(41):16146–16151. doi: 10.1073/pnas.0703894104. [DOI] [PMC free article] [PubMed] [Google Scholar]
- 30.Greenberg ML, et al. Orai1 function is essential for T cell homing to lymph nodes. J Immunol. 2013;190(7):3197–3206. doi: 10.4049/jimmunol.1202212. [DOI] [PMC free article] [PubMed] [Google Scholar]
- 31.Yeromin AV, et al. Molecular identification of the CRAC channel by altered ion selectivity in a mutant of Orai. Nature. 2006;443(7108):226–229. doi: 10.1038/nature05108. [DOI] [PMC free article] [PubMed] [Google Scholar]
- 32.Zhang SL, et al. Store-dependent and -independent modes regulating Ca2+ release-activated Ca2+ channel activity of human Orai1 and Orai3. J Biol Chem. 2008;283(25):17662–17671. doi: 10.1074/jbc.M801536200. [DOI] [PMC free article] [PubMed] [Google Scholar]
- 33.Lioudyno MI, et al. Orai1 and STIM1 move to the immunological synapse and are up-regulated during T cell activation. Proc Natl Acad Sci USA. 2008;105(6):2011–2016. doi: 10.1073/pnas.0706122105. [DOI] [PMC free article] [PubMed] [Google Scholar]
- 34.Amcheslavsky A, Safrina O, Cahalan MD. Orai3 TM3 point mutation G158C alters kinetics of 2-APB-induced gating by disulfide bridge formation with TM2 C101. J Gen Physiol. 2013;142(4):405–412. doi: 10.1085/jgp.201311030. [DOI] [PMC free article] [PubMed] [Google Scholar]
- 35.Amcheslavsky A, Safrina O, Cahalan MD. State-dependent block of Orai3 TM1 and TM3 cysteine mutants: Insights into 2-APB activation. J Gen Physiol. 2014;143(5):621–631. doi: 10.1085/jgp.201411171. [DOI] [PMC free article] [PubMed] [Google Scholar]
- 36.Ellefsen KL, Dynes JL, Parker I. Spinning-spot shadowless TIRF microscopy. PLoS One. 2015;10(8):e0136055. doi: 10.1371/journal.pone.0136055. [DOI] [PMC free article] [PubMed] [Google Scholar]
- 37.Sun XR, et al. Fast GCaMPs for improved tracking of neuronal activity. Nat Commun. 2013;4:2170. doi: 10.1038/ncomms3170. [DOI] [PMC free article] [PubMed] [Google Scholar]
- 38.Sage D, Neumann FR, Hediger F, Gasser SM, Unser M. Automatic tracking of individual fluorescence particles: Application to the study of chromosome dynamics. IEEE Trans Image Process. 2005;14(9):1372–1383. doi: 10.1109/tip.2005.852787. [DOI] [PubMed] [Google Scholar]
- 39.Dynes JL, Steward O. Arc mRNA docks precisely at the base of individual dendritic spines indicating the existence of a specialized microdomain for synapse-specific mRNA translation. J Comp Neurol. 2012;520(14):3105–3119. doi: 10.1002/cne.23073. [DOI] [PMC free article] [PubMed] [Google Scholar]
- 40.Chenouard N, et al. Objective comparison of particle tracking methods. Nat Methods. 2014;11(3):281–289. doi: 10.1038/nmeth.2808. [DOI] [PMC free article] [PubMed] [Google Scholar]
- 41.Jaqaman K, et al. Robust single-particle tracking in live-cell time-lapse sequences. Nat Methods. 2008;5(8):695–702. doi: 10.1038/nmeth.1237. [DOI] [PMC free article] [PubMed] [Google Scholar]
- 42.Wu MM, Covington ED, Lewis RS. Single-molecule analysis of diffusion and trapping of STIM1 and Orai1 at endoplasmic reticulum-plasma membrane junctions. Mol Biol Cell. 2014;25(22):3672–3685. doi: 10.1091/mbc.E14-06-1107. [DOI] [PMC free article] [PubMed] [Google Scholar]


