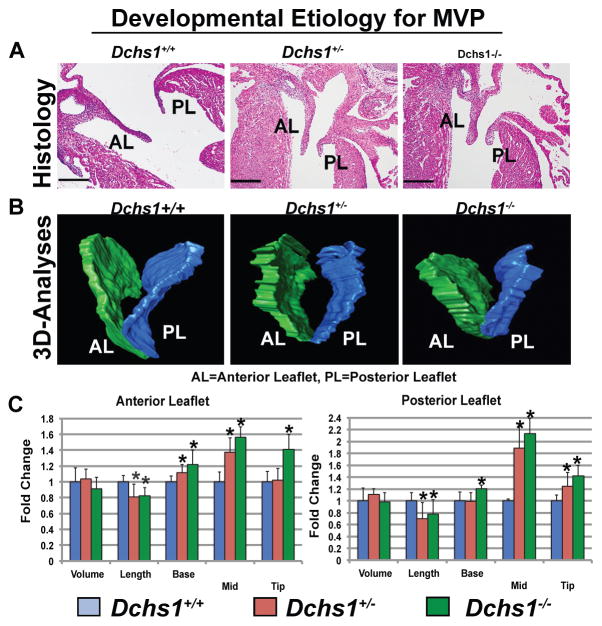
Figure 5. Developmental Etiology for MVP.
(A,B) H&E and 3D reconstructions of E17.5 Dchs1+/+, Dchs1+/−, and Dchs1−/− mouse hearts showing thickening of anterior and posterior leaflets (AL, PL) in Dchs1−/− mice compared to Dchs1+/+. Dchs1+/− valves display an intermediate phenotype. (C) Quantification of valve dimensions showing Dchs1−/− (green bars) and Dchs1+/− (orange bars) anterior and posterior lengths were significantly reduced compared to Dchs1+/+ (blue bars) leaflets. Dchs1−/− and Dchs1+/− valves displayed increased thickness throughout the leaflets compared to Dchs1+/+. Scale Bars= 100μm. N=5/genotype and two-tailed Student’s t-test was used to calculate p-values; *p<.01

