

Graphical Abstract

Keywords: morphogenesis, 3D body shape, tissue tension, actomyosin network, cell stacking, tissue alignment, fibronectin assembly
Vertebrates have a unique 3D body shape in which correct tissue/organ shape and alignment are essential for function. For example, vision requires the lens to be centred in the eye cup which must in turn be correctly positioned in the head1. Tissue morphogenesis depends on force generation, force transmission through the tissue, and response of tissues and extracellular matrix (ECM) to force2,3. Although a century ago D'Arcy Thompson postulated that terrestrial animal body shapes are conditioned by gravity4, there has been no animal model directly demonstrating how the aforementioned mechano-morphogenetic processes are coordinated to generate a body shape that withstands gravity. Here, we report a unique medaka mutant, hirame (hir), which is sensitive to deformation by gravity. hir embryos display a markedly flattened body caused by mutation of YAP, a nuclear executor of Hippo-signaling that regulates cell proliferation. We show that actomyosin-mediated tissue tension is reduced in hir embryos, leading to tissue flattening and misalignment, both of which contribute to body flattening. By analyzing YAP function in 3D-spheroids of human cells, we identify the RhoGAP ARHGAP18 as an effector of YAP in controlling tissue tension. Together, these findings reveal a previously unrecognized function of YAP in regulating tissue shape and alignment required for proper 3D body shape. Understanding this morphogenetic function of YAP could facilitate the use of embryonic stem cells to generate complex organs requiring correct alignment of multiple tissues.
Via exhaustive mutant screening in medaka and zebrafish5,6, we identified medaka hir mutants displaying pronounced body flattening around stage (st.) 25-28 (50-64 hours post fertilization, hpf; Fig. 1a). Although general development was not delayed, hir mutants exhibited delayed blastopore closure (Fig. 1b, c) and progressive body collapse from mid-neurulation (st.20, 31 hpf) (Fig. 1d), surviving until just before hatching (6 days post-fertilization, dpf). During body collapse, tissues and organs including neural tube and somites gradually became flattened and improperly aligned (Fig. 1d). Lenses were misaligned outside the eyes (Fig. 1a2, 2'). Mutant lens placodes expressing sox3 normally formed adjacent to the retina up to st.20, but then became fragmented and detached from the retina (Fig. 1e1’, 2’, Extended Data Fig.1a and b, Supplementary Videos 1, 2). These fragments gradually rounded up with some re-attaching to the retina to form ectopic lenses that were not incorporated (Fig. 1e). Thus, tissue flattening and misalignment defects are associated with the flattened mutant phenotype.
Figure 1. Organ/tissue collapse and misalignment in hir mutants.

a, 1, 1’, Lateral view of live wild-type (WT) and hir mutant embryos, anterior to the left. Arrowheads: heart. Brackets: embryo thickness; 2, 2’, Dorsal view, anterior upwards. Arrowheads: mislocated lenses; 3, 3’ Transverse section at the plane shown in 1 and 1’. Neural tubes (black dots) and somites (red dots). b, 1-3 lateral and 1’-3’ dorsal views of live embryos. Arrowheads: blastoderm margin. Epiboly quantified (%) in (c). Error bars ± S.E.M. (**P < 0.01, ***P < 0.001; one-way ANOVA with Dunnett's T3 post hoc. Figure 1 source data). d, Transverse sections at 5th somite level, neural tube (encircled) and somites (blue) by myoD in situ hybridization. e, Time-lapse sequence of dorsal view of WT and hir mutant right eyes. Arrowheads: lens placode; arrows: invaginating retina. Fragmented and detaching lens placode demarcated by dotted lines in 1’ and 2’. Scale bars: 40 μm.
Positional cloning identified a mutation of 164Leu (TTG to TAG) in the WW1 domain of YAP in hir (Extended Data Fig. 1c, d). YAP is the nuclear executor of the Hippo pathway and regulates organ growth via stimulation of cell proliferation7-9. In wild type (WT) embryos, YAP transcripts are ubiquitous throughout normal development10. Medaka maternal YAP mRNA was present at st.10 in hir before onset of zygotic gene expression but undetectable after st.18 (Extended Data Fig. 1e). Morpholino (MO) YAP knock-down (KD) in WT embryos recapitulated the hir phenotype (Extended Data Fig. 2a-c, Supplementary Table 1, 2), and ubiquitous recombinant YAP mRNA expression rescued the hir phenotype (Extended Data Fig. 1f). In addition, perturbation of maternal YAP mRNA translation in hir mutant embryos by YAP translation-blocking (TB) MO (mYAP KD hir embryos) elicited a more severe blastopore closure and body flattening phenotype than in hir zygotic YAP mutants (Fig. 1b3, 3’, c, Supplementary Table 2). Blastopore closure defects, but not flattening, have been reported in YAP KD zebrafish and Xenopus11. Since TAZ is a functional paralog of YAP12, we evaluated its contribution to the YAP KD phenotype in zebrafish. YAP;TAZ double KD zebrafish embryos exhibited more pronounced blastopore closure defects than YAP KD alone (Extended Data Fig. 2d-h). YAP-4SA, which lacks four serines and predominantly localizes to the nucleus13, rescued the hir phenotype more efficiently than WT YAP (Extended Data Fig. 1f), suggesting that the hir phenotype depends on nuclear YAP. The main nuclear function of YAP is to promote proliferation and inhibit cell death14. hir embryos had increased cell death from st.22 to 26 after body flattening had initiated (increased cell death per se does not lead to body flattening5,6). Cell proliferation remained close to normal in hir embryos but was strongly suppressed in TAZ KD (and YAP/TAZ double KD) medaka embryos (Extended Data Fig. 2i, j). Thus, in medaka, cell proliferation is mainly regulated by TAZ, while YAP is predominantly required for 3D body shape.
3 dpf hir mutants showed different orientations of body flattening. We therefore examined whether collapse correlated with the direction of gravity. Mutant embryos maintained either right-side or left-side down relative to the earth collapsed towards the earth as indicated by the ventricle tangent (Fig. 2a). Average collapse angle, θ, in mutant embryos was 17.3±10.7° (n=14; Fig. 2b) compared to 5.6±3.3° (n=26, p< 0.01) in WT. Mutant embryos maintained dorsal side down exhibited apparently uniform dorso-ventral compression (Fig. 2a2, 2'). Thus, flattening in hir embryos reflects an inability to withstand external forces (i.e. gravity), suggesting reduced tissue tension.
Figure 2. Tissue tension is reduced in hir mutants.

a, Embryos kept left side down (1, 1’), dorsal facing down (2, 2’) and right side down (3, 3’) from st.17 - 26, stained with phalloidin (green, F-actin) and TO-PRO-3 (blue, nucleus). Large black arrow: direction of gravity, θ: angle that the tangent along the brain ventricle (dotted lines in 1, 1’) makes with horizontal solid line. b, Range of collapse of mutant and WT embryos kept sideways. Error bars: ± S.E.M. **P < 0.01, t-test (Figure 2 source data). c, Immunoblotting of phospho-myosin regulatory light chain (pMRLC, Ser19) and control (GAPDH) (Supplementary Figure 1). d, Actomyosin-labelled Tg(actb1:myl12.1-eGFP) zebrafish embryos at 75% epiboly. Arrowhead: YSL actomyosin ring (AR) at the margin of the EVL. Bracket: for analysis of EVL shape anisotropy (Extended Data Fig. 3a). e, The actomyosin ring was cut along a 20 μm-long-line (red) perpendicular to the EVL/YSL boundary in MO-injected embryos, when control MO injected embryos were at 70-80% epiboly. f, Particle image velocimetry (PIV) quantifies the velocity field (yellow arrows) of the recoiling actomyosin network. g, Averaged temporal recoil velocity curves, control MO (n=41) and YAP;TAZ KD conditions (n=50). Error bars: error of the mean at 95% confidence. Exponential fit function with a linear offset (black solid line) yields the characteristic decay time (inset) and h, the initial recoil velocity for the control MO (23.8±2.3 μm/min) and YAP;TAZ KD conditions (11.2±0.8 μm/min). Error bars: 95% confidence interval for the fit results. i, Snapshot at the end of aspiration (600 sec) of st.22 neural tube with constant pressure (ΔP=4.5 mbar). j, The curves of the tongue length over time to measure the aspiration of WT, hir mutant and ROCK inhibitor (Y27632) treated neural tube explants. Error bars: ± S.D. Maximum tongue length measured at 600 sec were compared by t-test in k. Box plots represent 5%, 25%, median, 75%, and 95%. *P < 0.05, ***P < 0.001. Scale bars, 40 μm in a, i, 10 μm in e.
Tissue tension is generated primarily by actomyosin contraction15. During WT organogenesis, global levels of phosphorylated myosin regulatory light chain (pMRLC), indicative of actomyosin activity, increased (Fig. 2c), whilst in hir mutants they began decreasing as the blastopore closes (st.17, 25 hpf), and continued decreasing coinciding with tissue collapse and body flattening. To assess tissue tension during blastopore closure, we analyzed a surface epithelial cell layer, the enveloping layer (EVL)16 (Extended Data Fig. 3a1). Comparison of EVL shape anisotropy between WT and hir embryos suggested that tissue tension in hir is reduced within the EVL (Extended Data Fig. 3a, b). We also quantified actomyosin network tension within the yolk syncytial layer (YSL) of zebrafish embryos with compromised YAP function expressing EGFP myosin light chain protein, Tg(actb1:myl12.1-eGFP)17. The YSL actomyosin network close to the EVL margin (Fig. 2d, AR) was cut along a 20 μm-long line perpendicular to the margin to reveal circumferential tension (Fig. 2e). Recoil velocities were significantly reduced in YAP;TAZ KD (n=50) compared to control KD embryos (n=40; 11.2±0.8 μm/min vs 23.8±2.3 μm/min) (Fig. 2f-h), suggesting reduced actomyosin network tension. Consistent with this, epiboly movements in YAP;TAZ double KD zebrafish embryos were significantly reduced (KD embryos: 53.63±3.93%; control embryos: 70.0±2.18% deep cell epiboly). To test whether reduced actomyosin network tension is also responsible for neural tube tissue flattening in hir, we performed micropipette aspiration experiments18. hir neural explants were significantly less resistant to external forces applied by aspiration than WT, indicating reduced neural tube tissue tension. The higher deformability of hir neural tube tissue was paralleled when myosin activity was reduced by ROCK inhibition (Fig. 2i-k). Together, these analyses indicate that YAP is required for actomyosin-mediated tissue tension in medaka and zebrafish.
Single cell tracking analysis of the growing neural tube in hir showed that tissue flattening was associated with failure to stack cells and increase in cells slipping to one side after perpendicular cell division (Fig.3a, Extended Data Fig. 4, 5). Live imaging showed loss of filopodia between lens and retina which tether lens to retina during lens invagination1 (Extended Data Fig. 1b, 6a,b). The formation of lens-retina filopodia requires fibronectin (FN)-integrin signaling and contractile actomyosin1. While st.22 WT embryos had elongated thin FN fibrils between invaginating lens and retina, hir retina showed punctate FN patches (Fig. 3b1”, 2”), suggesting defective FN fibril formation. In addition, large ectopic FN deposits were found on the retina in hir (Fig. 3b2’). Similar loss of normal FN fibrils and large FN deposits were observed throughout hir embryos (Fig. 3b4’, 3b5’). Furthermore, integrin β1 accumulation between lens and retina was lost in hir (Extended Data Fig. 6c). In contrast, cell-cell adhesion and apical markers, including pan-cadherin, atypical PKC (aPKC) and ZO-1, were unaltered in hir (data not shown). Mosaic expression of YAP in hir and transplantation experiments both showed that the hir mutation acts in a non-cell autonomous manner (Extended Data Fig. 7, Supplementary Table 4). For instance, in invaginated hir lens rescued by mosaic expression of YAP, non-YAP expressing hir cells recovered filopodia (Extended Data Fig. 7b, 6b). These data suggest that YAP functions in tissue alignment by regulating FN assembly.
Figure 3. Cell and tissue dynamics in hir mutants.

a, Schematic: hir neural tube collapse is associated with long chain-like arrangements of neuroepithelial cells generated by increased cell slippage and randomized oriented cell division (Extended Data Fig. 4, 5). b, Whole-mount FN immunohistochemistry (IHC) of st.22 embryos, dorsal view, anterior to the top. 1-1”, Cont (control), WT embryos injected with out-of-frame 70kD N-terminal medaka FN1a+1b mRNA (250 pg) (n=20); 2-2”, uninjected hir mutants (n=11); 3-3”, WT embryos injected with N-terminal 70kDa FN1a+1b mRNA (250 pg) (n=39). 1-3, left anterior head of live embryos (asterisks, lens; triangle, forebrain ventricle); 1’-3’, left eye of FN IHC (green), boxed area magnified in 1”-3”; 4, 5, surface view of FN stained neural tube, WT (n=15) and hir (n=14) corresponding to the region in 1 and 2, respectively, boxed area magnified in 4’ and 5’. Arrowheads: FN fibrils/puncta, arrows: FN large deposits. Scale bars, 40 μm in b1, 1’, 4; 5 μm in b1’’, 4’.
To identify downstream YAP effectors regulating tissue tension, we used a human 3D spheroid in vitro culture system employing the human retina pigmented epithelial cell line hTERT-RPE1 (RPE1), which displayed a relatively mild proliferation defect upon YAP KD. YAP KD spheroids collapsed upon exposure to external forces by slow centrifugation, unlike normal spheroids (Fig. 4a, b). pMRLC levels were reduced in YAP KD spheroids (Fig. 4c), as in hir, suggesting that YAP maintains tissue tension also in human 3D tissues. YAP KD spheroids also lacked the typical beehive-like pattern of FN fibrils and, instead, contained large FN deposits, reminiscent of the hir retina phenotype (Fig. 4d). Cortical actomyosin contraction is required for polymerizing FN monomers to form fibrils19,20. Consistently, FN fibril formation on the basal surface of control spheroids coincided with cortical F-actin bundles (Fig. 4d). In contrast, loss of normal FN fibrils in YAP KD spheroids was associated with marked reduction of cortical F-actin bundles (Fig. 4d and f). Instead, we observed F-actin aggregates, some of which were associated with large FN deposits suggesting that they have increased local tension (Fig. 4d). A similar distribution of F-actin and FN was observed in hir (Extended Data Fig. 8a). Gene expression profiling of YAP KD spheroids identified only forty genes with reduced expression (see Methods), including ARHGAP18, encoding a RhoGAP that suppresses F-actin polymerization by inhibiting Rho21. ARHGAP18 transcripts and protein levels were reduced in YAP KD spheroids (Fig. 4c), and ARHGAP18 KD spheroids exhibited a similar phenotype to YAP KD spheroids, including reduced pMRLC levels (Fig. 4c), and aberrant F-actin and FN assembly (Fig. 4e). This suggests that both disruption of cortical F-actin bundles and ectopic F-actin aggregates (Fig. 4f) arise from F-actin over-polymerization in YAP KD spheroids (Extended Data Fig. 8b) and ARHGAP18 KD cells. Together, these results suggest that ARHGAP18 acts downstream of YAP and is required for cortical actomyosin network formation and tissue tension.
Figure 4. YAP regulation of tissue tension and FN assembly is mediated by ARHGAP18.

a, b, Confocal 3D sectioning of longest and shortest axes of YAP and control (cont) KD RPE1 spheroids (n=5, 7) after centrifugation. b, Ratio of longest (L)/shortest (S) axes. Error bars: ± S.E.M. **P < 0.05, t-test (Figure 4 source data). c, Immunoblotting of YAP and ARHGAP18 KD spheroids for the indicated proteins (Supplementary Figure 1). d, e Whole-mount imaging of basal surfaces of spheroids transfected with control siRNA (n=17), YAP siRNA (n=13), and ARHGAP18 siRNA (n=15), stained for F-actin (red) and FN (green). 2-4 magnified view of boxed areas in 1. Arrowheads: cortical regions; arrows: ectopic F-actin aggregates and aberrant FN fibrils. f, Schematic; fine extracellular FN fibrils form in close proximity to cortical F-actin in normal cells, while in YAP and ARHGAP18 KD cells, FN fibrils are reduced and aberrant FN deposits coincide with ectopic F-actin aggregates. g, Schematic summarizing how YAP/ARHGAP18-dependent actomyosin network contraction controls tissue shape and alignment. Scale bars, 40 μm in a; 30 μm in d1, e1; 15 μm in d2, e2.
To analyze the contribution of actomyosin tension-mediated FN assembly defects to the hir eye phenotype, we blocked FN assembly to a similar extent to that in hir by overexpressing 70kDa N-terminal FN1a and 1b fragments in WT embryos22 (Fig. 3b3’, 3”); this caused near dislocation of the lens and fewer filopodia between lens and retina (Fig. 3b3). hir mutants had fewer filopodia than FN assembly blocked embryos (Extended Data Fig. 6a, b), suggesting that contractile actomyosin defects in hir exacerbate the incomplete lens dislocation caused by FN assembly defects. In contrast, FN assembly blocked embryos did not exhibit flattened tissues (Fig. 3b1-3). Furthermore, the medaka FN1 mutant fukuwarai (fku) also exhibited lens mislocation but not tissue flattening (Extended Data Fig. 8c), suggesting that FN is specifically required for tissue alignment, but not generally for YAP-dependent tissue shape. ARHGAP18 mRNA levels were significantly reduced in hir, and mRNA injection of plasma membrane-targeted myristoylated ARHGAP18 (myrARHGAP18) into hir substantially rescued FN assembly defects, lens invagination and body flattening (Extended Data Fig. 9a, b). In contrast, inactivation of ARHGAP18 alone was insufficient to produce a recognizable phenotype (data not shown), suggesting that multiple ARHGAP18 related genes function downstream of YAP. Consistently, siRNA knock-down screening in human cells identified five ARHGAP genes with similar functions to ARHGAP18, homologs of which are conserved in medaka and zebrafish (Extended Data Fig. 9c, d). These results suggest that ARHGAP18-related genes function as effectors of YAP essential for both tissue shape and FN-dependent tissue alignment. The hir phenotype is not simply due to reduced myosin contraction, because injecting mRNA of an activated form of MRLC-DD23 did not rescue the hir phenotype (Extended Data Fig. 3a6, b, 8d). Similarly, injection of dominant negative MRLC-AA23 in WT embryos failed to fully phenocopy the hir tissue or body flattening phenotype (Extended Data Figs. 3a5, b). Collectively, these results suggest that YAP function in 3D tissue shape and FN assembly is conserved in human cells and is at least partly mediated by ARHGAP18-related genes.
We propose that YAP is essential for tissue tension, acting through ARHGAP18 and related genes to regulate cortical actomyosin network formation (Fig. 4g). YAP-dependent actomyosin network tension is required for both proper tissue shape and alignment to ensure organ/body shape. Several upstream regulators of YAP-mediated cell proliferation have been identified, including cellular environment stiffness, suggesting YAP can function as a mechanosensor24. Our data show that YAP also functions as a mechanoregulator of tissue tension. Reduced cortical actomyosin tension is the most probable cause of attenuated tissue tension in hir mutants. F-actin over-polymerization perturbs F-actin turnover required for actomyosin contraction in the cytokinetic ring25. Our finding that ARHGAP18, a suppressor of F-actin polymerization, functions downstream of YAP further supports a critical role of F-actin polymerization in contractile actomyosin network formation. YAP is required for basal-level actomyosin activity, consistent with ubiquitous expression of actin modulator ARHGAP1821, additional to which spatiotemporal modulation of actomyosin activity defines tissue shape. Since ARHGAP18 suppresses actin polymerization, which in turn reduces nuclear localization of YAP26, ARHGAP18 might suppress YAP activity via a negative feedback mechanism. This points to a possible mechanical feedback loop where tissue tension controls YAP, and YAP in turn is required for tissue tension.
Actomyosin contraction promotes FN assembly27. The tissue misalignment phenotype in hir is most likely due to failure of YAP-dependent actomyosin contractility in controlling FN assembly. Since FN initiates ECM organization27, actomyosin contraction-mediated FN assembly could be a critical in vivo mechanism that integrates mechanical signals (e.g. tension generated by actomyosin) with biochemical signals (e.g. integrin signaling). Notably, the phenotype of YAP KO mouse embryos resembles that of FN KO mouse embryos28, suggesting that YAP and FN have similar functions in mouse development. Interestingly, while YAP in medaka is predominantly required for tissue tension, its paralog TAZ appears to be required for cell proliferation (Supplementary Discussion). Given the high degree of conservation of YAP and other Hippo pathway components across metazoa29, it will be worth investigating whether the extent of tissue three-dimensionality and alignment correlate with the emergence of YAP-mediated resistance to gravity at the evolutionary transition from uni- to multi-cellular organisms. Generation of 3D eye cups from iPS/ES cells depends on tissue self-organization involving mechanical processes of which the mechanism remains elusive30; since YAP-dependent force-mediated morphogenesis could be involved in tissue self-organization, our findings could help in making more complex organs.
Methods
Fish maintenance and fish strains
Medaka (Oryzias latipes) and zebrafish (Danio rerio) strains were maintained and raised according to previously published procedures31. Medaka and zebrafish embryos were raised in E3 solution at 28°C. Fish care and procedures were approved by the University of Bath Ethical Review Committee, and are in compliance with the Animals Scientific Procedures Act 1986 of the UK. Medaka WT strains K-Cab, K-Kaga, and the mutant strain hir54-20C, were used6. Zebrafish WT strain AB, Tg(actb1:myl12.1-eGFP) and Tg(actb1:utrophin-mcherry)17,32 that allow visualization of myosin and actin, respectively, were used.
Embryological experiments
For fixation and live imaging, embryos were anaesthetized with 0.01% tricaine. For live imaging, embryos were embedded in 0.8% low melting temperature agarose (Type IV-A, Sigma, USA) in 35mm glass-base dishes (Iwaki, Japan) at 28°C. Detailed procedures for the standard embryological experiments including, dechorionation, fixation, in situ hybridization, immunohistochemistry, microinjection and cell transplantation were carried out according to previously published procedures31. Cells were transplanted to the region fated to become the eye and Cuvier's duct according to our fate map33.
Positional cloning of hir
The hir mutation induced in the K-Cab strain was crossed with the polymorphic K-Kaga strain to carry out genetic mapping according to a previously published procedure34. To map the hir mutation on the chromosome, bulked segregant analysis was performed using M-markers35 on DNA isolated from 48 homozygous mutant embryos and 48 WT siblings from F2 embryos of mutant/ K-Kaga mapping crosses. Chromosome walking on chromosome 13 was performed using restriction fragment length polymorphism markers between K-Cab and K-Kaga strains to map to the two BAC clones. For fine mapping, 1908 meioses were analyzed to identify 9 recombinants mapping hir mutation close to YAP. YAP cDNA was amplified from hir mutants by RT-PCR and sequenced directly to identify the mutation.
RT-PCR cDNA cloning and construction
Total RNAs were isolated using TRIzol (Life Technologies) and were converted to cDNA using the RNA-PCR kit ver.3 (Takara Bio, Japan) followed by PCR using KOD plus polymerase (Toyobo, Japan). For mRNA production, PCR amplified full-length cDNAs (medaka YAP, 70KDaFN1a,b, ARHGAP18) were cloned into pCS2+ and for in situ hybrization medaka sox3 cDNA was cloned into pBluescript II SK(−). pCS2+myr-ARHGAP18 was constructed by adding the myristoylation sequence using oligonucleotides to produce myristoylated ARHGAP18 mRNA. mRNAs were synthesized using SP6 mMESSAGE mMACHINE Kit (Ambion, USA). Primer sequences are shown in Supplementary Table 5.
Gravity experiment
Dechorionated embryos were embedded in 0.8% low melting temperature agarose in three orientations against gravity at st.19, fixed at st.24 and subjected to cryosectioning to determine the direction of tissue/organ collapse. Collapse of embryos towards gravity was assessed using images of sections stained with TO-PRO-3 and Phalloidin.
Microinjection
mRNA, DNA and Morpholino were injected at 1-cell or 8-cell stages to deliver them to all cells or in a mosaic manner. The volume of one-shot of injection was 0.5 nanoliters.
Phenotypic rescue experiments
Embryos from hir+/− heterozygote crosses were injected with mRNA of YAP variants. For transplantation phenotypic rescue experiments, embryos were genotyped by PCR using primers (Supplementary Table 5).
Morpholino KD analysis in medaka and zebrafish
Morpholino oligonucleotides (MOs) from Gene Tools (USA) were used (Supplementary Table 6). Specificity of KD by MO was confirmed in a slightly different manner in medaka and zebrafish. Since rescue of the phenotype by mRNA injection did not work effectively in zebrafish, three different types of MOs, translation blocking (TB), splicing blocking (SB) and 5’UTR MOs, were used and all were confirmed to induce a similar phenotype. In medaka, TB and SB MOs were used, and the phenotype was rescued by co-injecting corresponding mRNAs. To determine efficiency of KD, semi-quantitative RT-PCR was carried out using primers that distinguish defective splicing from normal forms of mRNA (Supplementary Table 5).
Immunohistochemistry
Embryos were fixed in either 4% PFA, Dent fixative or 1% TCA for 1-3 days and subjected to cryosectioning as described previously31. Antibodies used were: anti-FN antibody (Ab), Sigma F3648 at 1:100; β-integrin monoclonal Ab, 8c8 (Developmental Studies Hybridoma Bank, USA) at 1:10; anti-aPKC C-20 (SC216, Santa Cruz Biotech, USA) at 1:100; anti-PCNA (PC10, Santa Cruz Biotech, USA) at 1:500; anti-laminin (Ab-1, NeoMarkers, USA) at 1:100 and anti-ZO-136 (gift from Dr M Itoh) at 1:1. Sections were counterstained with Alexa Fluor 488 or 546 Phalloidin (A12379, A22283, Invitrogen USA) at 1:250 and TO-PRO-3 (T3605, Invitrogen, USA) at 1:1000.
Time-lapse microscopy and image analysis
Time-lapse analysis of lens dislocation was carried out using a Leica MZ16FA dissecting microscope. Confocal microscopy used a Leica TCS SP5 and images were analyzed by Imaris 7.3 (Bitplane, ANDOR Technology, UK) and Amira 5.1 (Visage Imaging, USA). Cell division orientation (θ) of telophase cells in time-lapse sequences was determined by drawing an axis from the ventricular zone-attached non-moving daughter cell (asterisk Extended Data Fig. 5c) towards the non-attached moving daughter cell37. The acute angle of this axis was then measured against the axis of the ventricular zone. Imaging was carried out dorsal side down using an inverted microscope. Rose diagrams were generated using Oriana v4 (Kovach Computing Services, UK).
Spheroid analysis
hTERT-RPE1 cells (American Type Culture Collection; CRL-4000) were seeded (2 × 10⁵ cells per well in 6-well plates). Each stealth RNA (100 pmol) of Opti-Mem medium (Life Technologies) was transfected using Lipofectamine RNAi Max (Life Technologies) followed by incubation for 24h at 37°C. Trypsin treatment was used to collect RNAi-transfected cells from wells which were resuspended in 2 ml of 10% FBS (Hyclone, ThermoFisher Scientific)-DMEM. These resuspensions were seeded to 6 wells of a 12-well plate (Hydrocell, CellSeed Japan) and incubated for 48 hr at 37°C. Spheroids were fixed in 3% formalin and subjected to immunostaining. Reagents used for immunostaining: anti-β-catenin (BD transduction, 610154, 1:200), anti-FN (Sigma F3648, 1:500), Alexa Fluor 546 Phalloidin (Invitrogen, A22283,1:200). For the list of primers see Supplementary Table 5.
Western blotting
Spheroids were lysed in lysis buffer (0.5% TritonX-100, 150 mM NaCl, 20 mM Tris-HCl pH7.5). The lysates were sheared with a 21-gauge needle, incubated on ice for 30 minutes and clarified by centrifugation at 20,817 × g for 15 minutes at 4°C. The extracted proteins were separated by SDS-PAGE and transferred to immobilon transfer membrane (Millipore) for Western blotting analyses. The primary antibodies were anti-YAP1 pAb (#4912 Cell Signaling, 1:500), anti-Fibronectin pAb (F3648, Sigma Aldrich, 1:1000), anti-ARHGAP18 pAb (1:10000)17,21, anti-MYH9 pAb (#3403 Cell signaling, 1:1000), anti-Phospho Ser1943-MYH9 pAb (#5026 Cell Signaling, 1:1000), anti-MYH10 mAb (#8824 Cell Signaling, 1:1000), anti-Phospho-Ser19 MLC2 (#3675, Cell signaling, 1:100), and anti-GAPDH mAb (sc32233, Santa Cruz, 1:5000).
Actomyosin tension measurement by laser cutting
Laser cutting experiments were carried out using a UV-laser ablation system as previously described17. Tg(actb1:myl12.1-eGFP)32 embryos were mounted in 1% low melting point agarose (Invitrogen) embedded in E3 medium inside a glass bottom petri dish (Mattek). A 63x water immersion objective (NA=1.2, Zeiss) was used to visualize the YSL actomyosin ring at respective epiboly stages. Cuts were made at a distance of 20 μm from the EVL/YSL boundary by applying 25 UV pulses at 1 kHz to 40 equidistant sites along a 20 μm-long-line perpendicular to the EVL margin as depicted in Figure 2e. Fluorescent images of embryos were captured using an iXon DU-897-BV camera (Andor Technology) with a 380 ms exposure time and 500 ms frame rate (LabVIEW v10.0.1). The ablation procedure itself took 1.2 s during which no images were acquired. Temperature was kept constant at 28.5±1°C throughout the experiment by means of a custom-built temperature chamber and an objective heating ring. The recoil velocity of the cortex in response to the cut opening was analyzed using customized Matlab (v7.12) scripts based on particle image velocimetry (PIV) as previously described17,38. The component of the PIV flow field that is orthogonal to the cut line was averaged in two adjacent rectangles (Figure 2f) for time frames up to 9 seconds post-ablation. The resulting recoil velocity curves for single embryo ablation experiments were averaged to yield the mean temporal recoil velocity curve for the depicted conditions (Figure 2g). Laser ablation experiments that caused wound response recognizable by a strong accumulation of myosin following the ablation were discarded from the analysis. In these experiments leakage of yolk cytoplasm through a membrane opening may interfere with the cortical tension measurements17.
Micropipette aspiration analysis
The whole neural tube was dissected out from st.22 medaka embryos and was cut using a tungsten needle at the level of diencephalon-midbrain boundary. The micropipette was connected to a Microfluidic Flow Control System (Fluigent, Fluiwell) which was controlled via a custom-programmed Labview (National Instruments) interface. In the BSS medium, the neural tube was aspirated from the open end by a micropipette (internal radius=30-35 μm) at a constant pressure (ΔP=4.5 mbar) for 10 minutes. Aspiration was imaged at 500 msec intervals by a Leica SP5 inverted confocal microscope using a Leica 20X, 0.7 NA objective. Temperature in the dish was kept constant at 28°C by a heated sample holder. Measuring the tongue length of the tissue within the micropipette using FIJI software over time yielded the characteristic tissue flow curves during aspiration for WT and hir mutant neural tube explants. To reduce cortical tension WT neural tube explants were treated with ROCK inhibitor Y27632 (250 μM dissolved in water) for 15 minutes before performing the micropipette aspiration experiment.
Oligo DNA microarray analysis
For the Oligo DNA microarray analysis, total RNA samples were collected from hTERT-RPE1 multicellular spheroids. 3D-Gene Human Oligo chip 25k (TORAY) was used. Total RNA of YAP siRNA-transfected spheroids and that of negative control siRNA were labeled with Cy3- or Cy5- using the Amino Allyl MessageAMP II aRNA Amplification Kit (Life Technologies), respectively. The Cy3- or Cy5-labeled aRNA pools and hybridization buffer were mixed, and hybridized for 16 h at 37°C. The hybridization was performed using the supplier's protocols (www.3d-gene.com). Hybridization signals were scanned using a 3D-Gene Scanner 3000 (TORAY). Detected signals for each gene were normalized by a global normalization method (Cy3/Cy5 ratio median = 1). Genes with Cy3/Cy5 normalized ratios greater than 2.0 or less than 0.5 were defined, respectively, as commonly up- or down-regulated genes. The results were deposited at GEO under the accession number GSE54146.
Quantitative RT-PCR analysis
Total RNA was isolated from WT and hir mutant embryos at various developmental stages using TRIzol (Invitrogen) according to the manufacturer's instructions. First-strand cDNA was synthesized from 1 μg total RNA using Superscript III reverse transcriptase (Invitrogen) with an oligo-dT primer. Each quantitative real-time RT-PCR was performed using the CFX96 real-time PCR detection system (Bio-Rad). Primers used for RT-PCR analysis are shown in Supplementary Table 5. For a 10 μl PCR, cDNA template was mixed with the primers to final concentrations of 250 nM and 5 μl of SsoFast™ EvaGreen® Supermix (Bio-Rad), respectively. The reaction was first incubated at 95°C for 3.5 min, followed by 45 cycles at 95°C for 30 s, 65°C for 30 s and 72°C for 30s.
Phylogenetic analysis of ARHGAP18 related genes in 11 metazoan species
Lists of homologs of ARHGAP18 family (TF314044) and its closely related families ARHGAP6 (TF316710) and ARHGAP11 (TF332212) in 11 metazoan model species were downloaded from Treefam database. We also obtained the members of the ARHGAP23 (TF329345) family. ARHGAP23 silencing mimics the round phenotype observed in an RNAi screen knocking down ARHGAP18 in HeLa cell line. Amino-acid sequences for these genes were downloaded from Ensembl. Multiple sequence alignment was performed using the PRANK package. This alignment was used to infer the phylogenetic relationship of these genes using Maximum Likelihood using FastTree 2.1.
ARHGAP siRNA screening in HeLa cell line
A library of siRNAs targeting human GAPs was obtained from Invitrogen. HeLa cells cultured in 24-well plates were transfected with siRNAs (20 nM) using Lipofectamine RNAiMAX. After 72 h, cells were fixed with 4% paraformaldehyde and stained with FITC-labeled paclitaxel (Invitrogen). Images were taken using an Olympus IX71 fluorescence microscope.
Statistical analyses
Statistical significance between WT and mutant groups was tested using independent two-tailed t-tests (for two-way comparisons) and one-way ANOVAs (for multiple comparisons), with a Dunnett's T3 post-hoc where necessary, in SPSS 20 (IBM) or Prism v5.0 (GraphPad). The Dunnett's T3 post-hoc assumes variances to be unequal and allows comparisons of groups with different n numbers. To test for differences in mitotic orientation between WT and hir we performed the Kolmogorov-Smirnov (KS) test (http://www.physics.csbsju.edu/stats/KStest.n.plot_form.html). The KS test makes no assumptions about the distribution of data being tested. Sample size was not pre-determined. We repeated experiments a minimum of three times with sufficient n numbers for each repeat to be confident that reported results are representative. Randomization was not applied to allocate embryos to experimental groups. Blinding to group allocation was not used. Error bars on graphs show ± standard error of the means (S.E.M.), except when stated otherwise. Data points that deviated by more than ± 3X the standard deviation of the sample mean were excluded from analysis.
P values and sample sizes
p-values vs WT unless specified. Fig. 1c: ncont = 39, nhir = 25 (p = 0.002), nmYAPKDhir = 24 (p = 0.000), nmYAPKDhir+YAPmRNA = 22 (p = 1.000). Fig. 2b: nWT = 26, nhir = 14 (p = 0.0001). Fig. 4b: ncontsiRNA = 7, nYAPsiRNA = 5 (p = 0.023). Extended data Fig. 2h: ncontMO = 20, nZFYAPTBMO = 11 (p = 0.000), nZFYAP;TAZTB = 10 (p = 0.000). Extended data Fig. 2i: nWT st.20 = 5, st.22 = 8, st.24 = 13, st.26 = 6, st.28 = 10, nhir st.20 = 8, st.22 = 4, st.24 = 6, st.26 = 9 (p = 0.0284), st.28 = 5 (p = 0.0088), nTAZMO st.20 = 5, st.22 = 5, st.24 = 10, st.26 = 12, st.28 = 12. Extended data Fig. 2j: nWT st.20 = 11, st.22 = 7, st.24 = 10, st.26 = 11, st.28 = 11, nhir st.20 = 7, st.22 = 7, st.24 = 11, st.26 = 13 (p = 0.0158 vs TAZMO st.26), st.28 = 7 (p = 0.0075 vs TAZMO st.28), nTAZMO st.20 = 5, st.22 = 5, st.24 = 10 (p = 0.0007), st.26 = 8 (p = 0.0008), st.28 = 6 (p = 0.0120). Extended data Fig. 3b: nWT = 174, nhir = 70 (p = 0.000), nmYAPKDhir = 85 (p = 0.000), nMRLCAA>WT = 135 (p = 0.000), nMRLCDD>hir = 92 (p = 0.145 vs hir). Extended data Fig. 4b: nWT = 3, nhir = 3. Extended data Fig. 5b: nWT cell stacking = 9, cell slippage = 8, parallel division = 5, nhir cell stacking = 3 (p = <0.01), cell slippage = 21 (p = <0.05), parallel division = 5. Extended data Fig. 5d: KS-test, p=0.01, nWT st.22-24 = 32, st.25-26 = 13, nhir st.22-24 = 14, st.25-26 = 20. Extended data Fig. 6b: nWT = 10, nFN70kDa>WT = 13 (p = 0.0032), nhir = 6 (p = 0.0001), nYAPS87A>hir = 10 (p = 0.0013).
Extended Data
Extended Data Figure 1. YAP is mutated in hir mutants.

a, In situ hybridization of sox3 showed that the lens placode (arrowhead) is specified in hir mutant embryos (n=3) at st.21. At st.22, the nascent lens invaginated in WT (n=21), but did not in hir mutant embryos (n=13, arrowhead). b, Two frames from time-lapse imaging of retina of embryos injected with membrane EGFP and nuclear RFP (MNFP) mRNAs. In WT (n=10), the nascent lens invaginates from st.21 (1, margins of the lens indicated by arrowheads with retina to the right), whereas in hir (n=7) the lens mostly detached from the retina (2’, arrowheads show lens remnants attached to the retina). Scale bars: 80 μm in a; 30 μm in b. c, Nine recombinants in 1908 meiosis mapped hir close to the YAP gene on chromosome 13 (R: recombinant, C: non-recombinant embryos). d, YAP cDNA encodes six protein binding domains/motifs and one transcription activation (TAc) domain; a non-sense mutation in WW1 domain in hir. e, RT-PCR analysis of YAP mRNA during development. β-actin as control. f, mRNA of normal YAP and its variants were injected into hir mutants. The numbers represent: hir phenotype rescue judged via brain thickness, heart migration and Cuvier's duct formation; mutants (judged by genotyping when necessary); survived injected embryos of hir (+/−) crosses. High dose (400 pg) mRNA of YAPhir variant was injected into WT embryos to examine dominant-negative effects. The rescue by YAP4SA variant required only 20% of the amount required to rescue using normal YAP mRNA.
Extended Data Figure 2. Morpholino knock-down in medaka and zebrafish.

a, Design of medaka YAP TB and SB MOs relative to translation start (ATG), exons (numbered boxes) and introns. Primers (arrows) used to assess the efficiency of SB MO KD. b, Upper panel, proper splicing of YAP transcripts (579 bp) was nearly fully blocked (343 bp, <5% of normal level) by YAP SB MO (5 ng), assessed by RT-PCR; Lower panel, β-actin control. c, WT embryos injected with YAP TB MO and standard control MO. 1-3 dorsal and 1’-3’ lateral views (also Supplementary Table 1). Arrowheads indicate location of heart progenitors. Body flattening and bilateral cardiac progenitor cell migration was affected in a dose-dependent manner. 2, 2’, Bilateral cardiac progenitor cells fused at the midline but did not migrate anteriorly; 1, 1’ their migration arrests next to the ears at the high dose. The two distinct YAP morpholinos (YAP TB and SB MOs) mimicked the hir phenotype in a dose-dependent manner. To further verify specificity of the YAP MOs, YAP TB MO was co-injected with human YAP mRNA that does not hybridize with the YAP TB MO. Injection of YAP TB (but not YAP SB) MO into hir mutant embryos enhanced the blastopore closure phenotype of hir mutants (Fig. 1b,c, Supplementary Table 2). These maternal YAP KD hir mutant embryos failed to close the blastopore. Less than half the amount (2 ng) of YAP TB MO was required for causing this phenotype in hir mutants compared to that required for WT embryos (5 ng). This blastopore closure phenotype was rescued by medaka YAP mRNA (200 pg) co-injection. d-g, Zebrafish (ZF) WT embryos injected with three distinct ZFYAP MOs (TB, 5’UTR and SB) exhibit the blastopore closure phenotype as in medaka (Supplementary Table 3). Efficiencies of ZF YAP and TAZ SB MO KD (1.5 ng each) were assessed by RT-PCR using primers in d, f, respectively as in a, b. As reported by Gee et al., co-injection of ZF YAP mRNAs did not rescue the ZF YAP MO phenotype in zebrafish11. h, Co-injection of ZF TAZ MO (total 2 ng) enhanced slow epiboly of YAP TB KD-injected embryos; control = 89±4.16% (n=20), YAP KD = 70.09±4.7% (n=11), YAP/TAZ KD = 52.5±2.64% (n=10). Error bars show ± S.E.M. ***P < 0.001, one-way ANOVA. i, j, TUNEL for cell death and phosphohistone H3 (PH3) antibody staining for cell proliferation (see methods for sample sizes). Stained cells in the neural tube were counted. Error bars indicate ± S.E.M. *P < 0.05, **P < 0.01, ***P < 0.001, one-way ANOVA (Extended Data Figure 2 source data).
Extended Data Figure 3. Anisotropic EVL cell shape analysis in hir mutants.

a, 1, Schematic of sectional view of blastoderm margin of a gastrulating embryo (TJ, tight junction; AR actin ring; YSL, yolk syncytial layer; EVL, enveloping layer); 2-6, EVL shape was visualized in phalloidin-stained fixed medaka embryos at 75% epiboly (st.16, 21 hpf) and compared among, 2 WT (n=14); 3 hir (n=9); 4 maternal YAP KD hir mutants (mYAPKDhir,) by TB MO-injection into hir embryos (n=12), 5 MRLC-AA (dominant negative form) mRNA-injected WT (n=6); and 6, MRLC-DD (constitutive active form) mRNA-injected hir embryos (n=4). b, EVL shape anisotropy quantification by the length/width ratio (LWR, shown in a2) of marginal EVL cells (up to 4 rows back from the EVL/YSL boundary, shown in Fig. 2d bracket). While EVL shape anisotropy was reduced in hir mutant embryos (3) to a level comparable to that of MRLC blocked embryos (5), activation of MRLC in hir (6) did not rescue it. Parentheses indicate number of cells measured. Scale bar 30 μm. Error bars represent ± S.E.M. ***P < 0.001, one-way ANOVA (Extended Data Figure 3 source data).
Extended Data Figure 4. Flattening of the hir neural tube is associated with string-like cell arrangements.

a, Increasing height [indicated by brackets in (1) and (5)] of WT neural tube (outlined, n=10) was associated with cell stacking. Time in minutes from st.21 shown bottom left of each sub-panel. Red fluorescent cells, e.g. cell 1 in (1), labeled by photo-converting Kaede fluorescent protein, rounded up at the ventricular zone [arrowhead in (2)] and divided along the ventricular zone [perpendicular cell division in (3)] to generate stacked daughter cells 1-1, 1-2, making the neural tube thicker in (5). b, Width/height ratio of spinal cord, measured from time-lapse imaging of single embryos (WT, hir n=3 each), showed that flattening occurred progressively in hir. Error bars are ± S.E.M. (Extended Data Figure 4 source data). c, Single-cell tracking of clones (labeled by membrane-GFP and nuclear-RFP) of the growing neural tube at the level of the fifth somite. Lower panels for WT and hir show magnified views of shaded regions in upper panels. The flatter and wider neural tube of the hir mutant at st.27 was associated with long chain-like cell arrangements (asterisks, bottom panels of hir) tracked from a single neuroepithelial cell at st.22, as compared with the thick cell group generated by cell stacking in WT embryos. Scale bars, 40 μm.
Extended Data Figure 5. Flattening of the hir neural tube is associated with cell stacking failure.

Single-cell analysis in hir neural tube shows cell stacking failure occurred after mitosis (a, b) and during mitosis (c, d). Neural progenitor cells divided with spindle orientation “perpendicular” or “parallel” to the ventricular zone (“perpendicular” or “parallel” cell division, respectively). a, While daughter cells (asterisks) in WT remained stacked after 45 minutes following perpendicular cell division (first row), those in hir exhibited cell slippage (second and third rows). Telophase neuroepithelial cells in the neural tube, first column; magnified views in second to fourth columns. Dotted lines show division planes. Two types of cell slippage were observed: ventral slippage (VS) where the dorsal daughter cell slipped towards the ventral (second row), and dorsal slippage (DS) where the ventral daughter cell slipped towards the dorsal (third row). After parallel cell division, daughter cells did not change their positions in hir (fourth row). b, Cell stacking was reduced and cell slippage increased after perpendicular cell division, but cells after parallel cell division remained unaltered in hir mutants. Cell numbers in parentheses. Error bars, ± S.E.M. *P < 0.05, **P < 0.01, t-test (Extended Data Figure 5 source data). c, During perpendicular mitosis, daughter cells did not stack properly in hir mutants. Cell division orientation (θ) was measured in time-lapse sequences as the acute angle of the telophase cell axis against that of the ventricular zone (e.g. dotted line 26° in a). d, Rose diagrams showing frequency and angle of parallel cell divisions. At st.25-26 (50-54 hpf) perpendicular cell divisions generated stacked cells against gravitational forces in WT (n=3 embryos at both stages). Far fewer stacked cells were observed in hir (n=4 embryos at st.22-24, n=3 embryos at st.25-26). These results are illustrated in Fig. 3a. Scale bars, 15 μm in a, 40 μm in c.
Extended Data Figure 6. Detachment of lens is associated with loss of filopodia in hir.
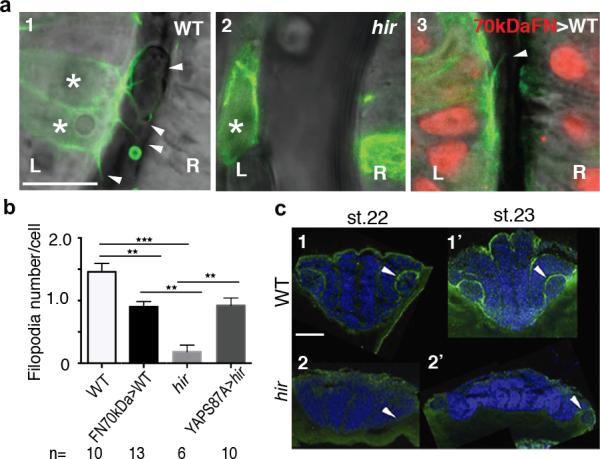
a, Representative live images of filopodia (arrowheads) from single lens cells (asterisks) expressing lifeact-GFP in a mosaic manner; (1) WT, (2) hir and (3) 70kDaFN mRNA-injected WT embryos at st.21.5 when lenses are detaching in hir mutants (see Extended Data Figure 1b for larger views). (3) Non-mosaic expression of 70kDaFN mRNA in WT embryos was confirmed by co-injected H2A-RFP in the nucleus (red). L, lens; R retina. b, Filopodia number/cell was compared (see Extended Data Fig. 7b4 for YAPS87A injected hir embryos). n, number of analyzed embryos. Error bars indicate ± S.E.M. **P < 0.01, ***P < 0.001, one-way ANOVA (Extended Data Figure 6 source data). c, Transverse section of integrin-β1 IHC. Strong integrin-β1 localisation between lens and retina in st.22 WT (n=2) (1, arrowhead); no such localisation in hir (n=3) (2). At st.23 in hir (n=3), weak localisation where rounded up lens reattached to retina (2’, arrowhead). Scale bars, 10 μm in a; 40 μm in c.
Extended Data Figure 7. The hir mutation acts cell non-autonomously.

a, Mosaic expression of EGFP-YAPS87A by mRNA injection at 16-cell stage in hir mutant embryos rescued the hir eye phenotype in (2) as compared to (1) WT and (3) hir. The boxed area in (2) is magnified in the lower panels (2’-2’’’) fluorescence, merged and bright-field views, respectively. Arrowheads in 2’ indicate EGFPYAPS87A expressing clones. b, Non-cell autonomous rescue of filopodia in hir mutant lens cells. YAPS87A+ mCherry-CAAX (labels membrane red) mRNA, and Lifeact-EGFP mRNA (labels F-actin green) were injected into different cells at 8-16 cell stage. (1) In the invaginated (arrow) hir mutant lens (boxed area magnified in 2 and 3, n=10) rescued by mosaic expression of YAPS87A (red), YAPS87A non-expressing mutant cells recovered filopodia (arrowheads in 4, magnified view of 3). Filopodia number/cell was compared between WT and hir in Extended Data Figure 6b. c, (1) Cells from donor embryos injected with rhodamine (red, top left) were transplanted to a recipient embryo (top right, blastula stage st.12) at the location fated to be eyes (bottom, animal pole view). (2) WT, (3) hir and (4) WT cells transplanted into hir mutant eye, causing the lens (arrowhead) to invaginate into the retina as in WT at st.23 (note that this confocal sectional view represents a fraction of transplanted cells in the whole eye, see Supplementary Table 4 for the frequency of rescue). Scale bars, 40 μm.
Extended Data Figure 8. F-actin and FN localizations in hir.

a, Whole-mount imaging of WT (n=5) and hir (n=4) embryos stained for F-actin (red) and FN (green). (1, 1’) whole dorsal view of embryos anterior up, only FN shown; (2-4, 2’-4’) magnified view of area indicated by asterisks in (1, 1’); merged (2, 2’), F-actin (3, 3’) and FN (4, 4’). Arrowheads indicate cortical F-actin and FN fibrils in WT and corresponding region in hir (3, 4, 3’, 4’); arrows show ectopic F-actin aggregates and aberrant FN fibrils in (3’, 4’). b, Immunostaining of 2D cultured RPE1 cells transfected with control (Cont, n=21) and YAP siRNAs (n=19) stained with Phalloidin (1, 1’), β-catenin (2, 2’) and merged with DAPI (3, 3’); Phalloidin (4, 4’), FN (5, 5’) and merged with DAPI (6, 6’). In marked contrast to the 3D spheroids, FN deposits were not altered in YAP KD cells (5, 5’) despite of increased F-actin stress fibers (1, 1’ and 4, 4’). c, The medaka fku mutants exhibit lens mislocation (arrows). Live dorsal view of the head of (1) WT, (2) fku and (3) hir mutant embryos at st.24. (4) The fku mutation was mapped to LG21 to the region encompassing the FN1 gene (0 recombinants/1130 meiosis). Positional cloning identified a non-sense mutation of 593Glu (GAA to TAA) in FN1 (2503 amino acids). FN1 morpholino KD in WT embryos mimicked the fku mutant phenotype. d, Constitutive-active MRLC-DD mRNA markedly increased body thickness of WT embryos, but did not rescue the flattened body (brackets in lower panels) and dislocated lens phenotypes of hir (n=48). Upper panels, live lateral view (insets, dorsal views of left eyes); lower panels, frontal sections stained with Phalloidin (red) and TO-PRO-3 (blue) at st.25. Scale bars 30 μm, except a2, 15 μm and b, 50 μm.
Extended Data Figure 9. in vivo analysis of ARHGAP18 function.

a, Quantitative RT-PCR analysis showed that ARHGAP18 mRNA expression in the hir mutant is significantly reduced to 76% of WT level. EF1α as an internal control. Data are shown as means ± S.E.M. [n=10 each; *P < 0.001 Student's t-test (two-tailed)]. b, myrARHGAP18 mRNA (150 pg) injection rescued the hir phenotype (21 rescued/39 hir/112 survived embryos). Upper panels, live dorsal view; lower panels, frontal sections stained with Phalloidin (red) and TO-PRO-3 (blue) at st.23; (1) uninjected hir, (2) injected hir and (3) WT. The lens (asterisk) invaginated into retina (arrows, upper panel) and the neural tube became thicker (brackets in lower panels) in the myrARHGAP18 mRNA-injected hir mutant embryos. (2’) FN staining of myrARHGAP18 mRNA-injected hir mutant embryos; boxed area magnified in subsequent panel to the right; invaginated lenses had fine FN fibrils (arrowheads) between lens and retina as in WT (see Fig. 3b1”). c, Phylogenetic analysis identified 16 ARHGAP18 paralogs in vertebrate lineages. Arrowheads show medaka orthologs. d, siRNA screening of 40 human ARHGAP genes in HeLa cells showed that knock-down of five ARHGAP genes exhibited the rounding up phenotype similar to ARHGAP18 inactivation,
Supplementary Material
Acknowledgements
We thank Martin Raff, Tony Perry, Andrew Ward, Matthew Wills, Jim Caunt, Jon Clarke, Laurence Hurst and Cheryll Tickle for critical reading and valuable comments. We thank Araxi Urrutia, Atahualpa Castillo, Masa Tada, Mikio Furuse, Naoko Wada, Yuki Nakai, Joseph Robinson and Robert Kelsh for contributions to the paper and University of Bath for fish and bioimaging facilities. This work was funded by the ERATO/SORST projects of JST, Japan (H.K.), National Institutes of Health R01EY014167 (B.A.L.) and Medical Research Council, UK (M.F.-S.).
Footnotes
Contributions
S.P., H.W., Y.A., M.B., T.M., H. M., S.H., T.S., SF.G.K., Y.O., S.A., A.M., S.L., J.B.M., B.A.L. T.S., S.B., and M.F-S performed experiments. S.P., H.W., Y.A., M.B., T.M. and M.F.-S conceived the study. S.B., N.S., H.N., S.M., H.K., C.-P.H., H.N. and M.F- S. supervised the study. C.-P.H. and M.F- S. wrote the paper. All authors interpreted data.
Competing financial interests
The authors declare no competing financial interests.
References
- 1.Chauhan BK, et al. Cdc42- and IRSp53-dependent contractile filopodia tether presumptive lens and retina to coordinate epithelial invagination. Development. 2009;136:3657–3667. doi: 10.1242/dev.042242. [DOI] [PMC free article] [PubMed] [Google Scholar]
- 2.Nelson CM, Bissell MJ. Of extracellular matrix, scaffolds, and signaling: tissue architecture regulates development, homeostasis, and cancer. Annu. Rev. Cell Dev. Biol. 2006;22:287. doi: 10.1146/annurev.cellbio.22.010305.104315. [DOI] [PMC free article] [PubMed] [Google Scholar]
- 3.Mammoto T, Ingber DE. Mechanical control of tissue and organ development. Development. 2010;137:1407–1420. doi: 10.1242/dev.024166. [DOI] [PMC free article] [PubMed] [Google Scholar]
- 4.Thompson DA. On Growth and Form. Cambridge University Press; 1917. pp. 1–1136. [Google Scholar]
- 5.Furutani-Seiki M, et al. Neural degeneration mutants in the zebrafish, Danio rerio. Development. 1996;123:229–239. doi: 10.1242/dev.123.1.229. [DOI] [PubMed] [Google Scholar]
- 6.Furutani-Seiki M, et al. A systematic genome-wide screen for mutations affecting organogenesis in Medaka, Oryzias latipes. Mechanisms of Development. 2004;121:647–658. doi: 10.1016/j.mod.2004.04.016. [DOI] [PubMed] [Google Scholar]
- 7.Sudol M, et al. Characterization of the mammalian YAP (Yes-associated protein) gene and its role in defining a novel protein module, the WW domain. J. Biol. Chem. 1995;270:14733–14741. doi: 10.1074/jbc.270.24.14733. [DOI] [PubMed] [Google Scholar]
- 8.Pan D. The Hippo Signaling Pathway in Development and Cancer. Developmental Cell. 2010;19:491–505. doi: 10.1016/j.devcel.2010.09.011. [DOI] [PMC free article] [PubMed] [Google Scholar]
- 9.Zhao B, Tumaneng K, Guan K-LL. The Hippo pathway in organ size control, tissue regeneration and stem cell self-renewal. Nature Cell Biology. 2011;13:877–883. doi: 10.1038/ncb2303. [DOI] [PMC free article] [PubMed] [Google Scholar]
- 10.Miesfeld JB, Link BA. ScienceDirect. Mechanisms of Development. 2014:1–12. doi: 10.1016/j.mod.2014.02.003. doi:10.1016/j.mod.2014.02.003. [DOI] [PMC free article] [PubMed] [Google Scholar]
- 11.Gee ST, Milgram SL, Kramer KL, Conlon FL, Moody SA. Yes-Associated Protein 65 (YAP) Expands Neural Progenitors and Regulates Pax3 Expression in the Neural Plate Border Zone. PLoS ONE. 2011;6:e20309. doi: 10.1371/journal.pone.0020309. [DOI] [PMC free article] [PubMed] [Google Scholar]
- 12.Lei QY, et al. TAZ Promotes Cell Proliferation and Epithelial-Mesenchymal Transition and Is Inhibited by the Hippo Pathway. Molecular and Cellular Biology. 2008;28:2426–2436. doi: 10.1128/MCB.01874-07. [DOI] [PMC free article] [PubMed] [Google Scholar]
- 13.Zhao B, Li L, Tumaneng K, Wang CY, Guan K-LL. A coordinated phosphorylation by Lats and CK1 regulates YAP stability through SCF -TRCP. Genes & Development. 2010;24:72–85. doi: 10.1101/gad.1843810. [DOI] [PMC free article] [PubMed] [Google Scholar]
- 14.Heisenberg C-PP, Bellaïche Y. Forces in Tissue Morphogenesis and Patterning. Cell. 2013;153:948–962. doi: 10.1016/j.cell.2013.05.008. [DOI] [PubMed] [Google Scholar]
- 15.Vicente-Manzanares M, Ma X, Adelstein RS, Horwitz AR. Cytoskeletal motors: Non-muscle myosin II takes centre stage in cell adhesion and migration. Nat Rev Mol Cell Biol. 2009;10:778–790. doi: 10.1038/nrm2786. [DOI] [PMC free article] [PubMed] [Google Scholar]
- 16.Köppen M, Fernández BG, Carvalho L, Jacinto A, Heisenberg C-PP. Coordinated cell-shape changes control epithelial movement in zebrafish and Drosophila. Development. 2006;133:2671–2681. doi: 10.1242/dev.02439. [DOI] [PubMed] [Google Scholar]
- 17.Behrndt M, et al. Forces Driving Epithelial Spreading in Zebrafish Gastrulation. Science. 2012;338:257–260. doi: 10.1126/science.1224143. [DOI] [PubMed] [Google Scholar]
- 18.Guevorkian K, Colbert M-J, Durth M, Dufour S, Brochard-Wyart F. Aspiration of biological viscoelastic drops. PHYSICAL REVIEW LETTERS. 2010;104:218101. doi: 10.1103/PhysRevLett.104.218101. [DOI] [PubMed] [Google Scholar]
- 19.Singh P, Carraher C, Schwarzbauer JE. Assembly of Fibronectin Extracellular Matrix. Annu. Rev. Cell Dev. Biol. 2010;26:397–419. doi: 10.1146/annurev-cellbio-100109-104020. [DOI] [PMC free article] [PubMed] [Google Scholar]
- 20.Rolo A, Skoglund P, Keller RE. Morphogenetic movements driving neural tube closure in Xenopus require myosin IIB. Developmental Biology. 2009;327:327–338. doi: 10.1016/j.ydbio.2008.12.009. [DOI] [PMC free article] [PubMed] [Google Scholar]
- 21.Maeda M, et al. ARHGAP18, a GTPase-activating protein for RhoA, controls cell shape, spreading, and motility. Mol. Biol. Cell. 2011;22:3840–3852. doi: 10.1091/mbc.E11-04-0364. [DOI] [PMC free article] [PubMed] [Google Scholar]
- 22.McDonald JA, et al. Fibronectin's cell-adhesive domain and an amino-terminal matrix assembly domain participate in its assembly into fibroblast pericellular matrix. J. Biol. Chem. 1987;262:2957–2967. [PubMed] [Google Scholar]
- 23.Iwasaki T, Murata-Hori M, Ishitobi S, Hosoya H. Diphosphorylated MRLC is required for organization of stress fibers in interphase cells and the contractile ring in dividing cells. Cell Struct. Funct. 2001;26:677–683. doi: 10.1247/csf.26.677. [DOI] [PubMed] [Google Scholar]
- 24.Dupont S, et al. Role of YAP/TAZ in mechanotransduction. Nature. 2011;474:179–183. doi: 10.1038/nature10137. [DOI] [PubMed] [Google Scholar]
- 25.Pinto IM, Rubinstein B, Kucharavy A, Unruh JR, Li R. Actin Depolymerization Drives Actomyosin Ring Contraction during Budding Yeast Cytokinesis. DEVCEL. 2012;22:1247–1260. doi: 10.1016/j.devcel.2012.04.015. [DOI] [PMC free article] [PubMed] [Google Scholar]
- 26.Sansores-Garcia L, et al. Modulating F-actin organization induces organ growth by affecting the Hippo pathway. EMBO J. 2011;30:2325–2335. doi: 10.1038/emboj.2011.157. [DOI] [PMC free article] [PubMed] [Google Scholar]
- 27.Daley WP, Peters SB, Larsen M. Extracellular matrix dynamics in development and regenerative medicine. Journal of Cell Science. 2008;121:255–264. doi: 10.1242/jcs.006064. [DOI] [PubMed] [Google Scholar]
- 28.Morin-Kensicki EM, et al. Defects in Yolk Sac Vasculogenesis, Chorioallantoic Fusion, and Embryonic Axis Elongation in Mice with Targeted Disruption of Yap65. Molecular and Cellular Biology. 2006;26:77–87. doi: 10.1128/MCB.26.1.77-87.2006. [DOI] [PMC free article] [PubMed] [Google Scholar]
- 29.Hilman D, Gat U. The Evolutionary History of YAP and the Hippo/YAP Pathway. Molecular Biology and Evolution. 2011;28:2403–2417. doi: 10.1093/molbev/msr065. [DOI] [PubMed] [Google Scholar]
- 30.Sasai Y. Cytosystems dynamics in self-organization of tissue architecture. Nature. 2013;493:318–326. doi: 10.1038/nature11859. [DOI] [PubMed] [Google Scholar]
- 31.Porazinski SR, Wang H, Furutani-Seiki M. Essential techniques for introducing medaka to a zebrafish laboratory--towards the combined use of medaka and zebrafish for further genetic dissection of the function of the vertebrate genome. Methods Mol. Biol. 2011;770:211–241. doi: 10.1007/978-1-61779-210-6_8. [DOI] [PubMed] [Google Scholar]
- 32.Maître J-L, et al. Adhesion functions in cell sorting by mechanically coupling the cortices of adhering cells. Science. 2012;338:253–256. doi: 10.1126/science.1225399. [DOI] [PubMed] [Google Scholar]
- 33.Hirose Y. Single cell lineage and regionalization of cell populations during Medaka neurulation. Development. 2004;131:2553–2563. doi: 10.1242/dev.01140. [DOI] [PubMed] [Google Scholar]
- 34.Iwanami N, et al. WDR55 Is a Nucleolar Modulator of Ribosomal RNA Synthesis, Cell Cycle Progression, and Teleost Organ Development. PLoS Genet. 2008;4:e1000171. doi: 10.1371/journal.pgen.1000171. [DOI] [PMC free article] [PubMed] [Google Scholar]
- 35.Naruse K, et al. A medaka gene map: the trace of ancestral vertebrate protochromosomes revealed by comparative gene mapping. Genome Res. 2004;14:820–828. doi: 10.1101/gr.2004004. [DOI] [PMC free article] [PubMed] [Google Scholar]
- 36.Itoh M, Nagafuchi A, Moroi S, Tsukita S. Involvement of ZO-1 in cadherin-based cell adhesion through its direct binding to alpha catenin and actin filaments. The Journal of Cell Biology. 1997;138:181–192. doi: 10.1083/jcb.138.1.181. [DOI] [PMC free article] [PubMed] [Google Scholar]
- 37.Alexandre P, Reugels AM, Barker D, Blanc E, Clarke JDW. Neurons derive from the more apical daughter in asymmetric divisions in the zebrafish neural tube. Nature neuroscience. 2010;13:673–679. doi: 10.1038/nn.2547. [DOI] [PubMed] [Google Scholar]
- 38.Mayer M, Depken M, Bois JS, Jülicher F, Grill SW. Anisotropies in cortical tension reveal the physical basis of polarizing cortical flows. Nature. 2010;467:617–621. doi: 10.1038/nature09376. [DOI] [PubMed] [Google Scholar]
- 39.Yeung C-YC, et al. Arhgap28 Is a RhoGAP that Inactivates RhoA and Downregulates Stress Fibers. PLoS ONE. 2014;9:e107036. doi: 10.1371/journal.pone.0107036. [DOI] [PMC free article] [PubMed] [Google Scholar]
- 40.Prakash SK, et al. Functional analysis of ARHGAP6, a novel GTPase-activating protein for RhoA. Human Molecular Genetics. 2000;9:477–488. doi: 10.1093/hmg/9.4.477. [DOI] [PubMed] [Google Scholar]
Associated Data
This section collects any data citations, data availability statements, or supplementary materials included in this article.