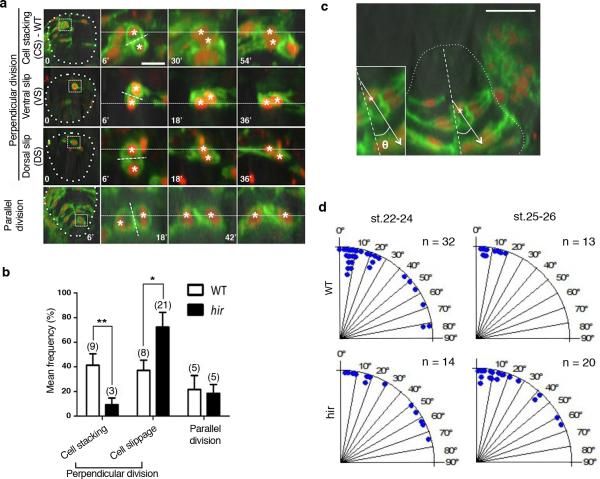
Extended Data Figure 5. Flattening of the hir neural tube is associated with cell stacking failure.
Single-cell analysis in hir neural tube shows cell stacking failure occurred after mitosis (a, b) and during mitosis (c, d). Neural progenitor cells divided with spindle orientation “perpendicular” or “parallel” to the ventricular zone (“perpendicular” or “parallel” cell division, respectively). a, While daughter cells (asterisks) in WT remained stacked after 45 minutes following perpendicular cell division (first row), those in hir exhibited cell slippage (second and third rows). Telophase neuroepithelial cells in the neural tube, first column; magnified views in second to fourth columns. Dotted lines show division planes. Two types of cell slippage were observed: ventral slippage (VS) where the dorsal daughter cell slipped towards the ventral (second row), and dorsal slippage (DS) where the ventral daughter cell slipped towards the dorsal (third row). After parallel cell division, daughter cells did not change their positions in hir (fourth row). b, Cell stacking was reduced and cell slippage increased after perpendicular cell division, but cells after parallel cell division remained unaltered in hir mutants. Cell numbers in parentheses. Error bars, ± S.E.M. *P < 0.05, **P < 0.01, t-test (Extended Data Figure 5 source data). c, During perpendicular mitosis, daughter cells did not stack properly in hir mutants. Cell division orientation (θ) was measured in time-lapse sequences as the acute angle of the telophase cell axis against that of the ventricular zone (e.g. dotted line 26° in a). d, Rose diagrams showing frequency and angle of parallel cell divisions. At st.25-26 (50-54 hpf) perpendicular cell divisions generated stacked cells against gravitational forces in WT (n=3 embryos at both stages). Far fewer stacked cells were observed in hir (n=4 embryos at st.22-24, n=3 embryos at st.25-26). These results are illustrated in Fig. 3a. Scale bars, 15 μm in a, 40 μm in c.

