Abstract
We present a new technique for the correction of nonuniform rotation distortion in catheter-based optical coherence tomography (OCT), based on the statistics of speckle between A-lines using intensity-based dynamic light scattering. This technique does not rely on tissue features and can be performed on single frames of data, thereby enabling real-time image correction. We demonstrate its suitability in a gastrointestinal balloon-catheter OCT system, determining the actual rotational speed with high temporal resolution, and present corrected cross-sectional and en face views showing significant enhancement of image quality.
Optical coherence tomography (OCT) [1] is increasingly used in biomedical and clinical imaging due to its combination of high-speed optical sectioning and high resolution [2]. In conventional OCT systems, a single axis of image data is obtained through interferometry while a second or third dimension of data is acquired by beam scanning. Whether scanning is performed with galvanometers, MEMS scanners, or rotation/translation as in catheter-based systems, the geometric fidelity of beam scanning is critical for image quality. Inaccurate scanning can introduce deformations in the image that can complicate the interpretation of clinical data. This is particularly problematic in the case of catheter-based imaging, when accessing internal organs through narrow diameter, flexible fiber-optic probes. Catheters are generally provided with two dimensional scanning mechanisms: a longitudinal motion (“pullback”) and an azimuthal rotational motion. Commonly, in gastrointestinal (GI) [3–7] and intravascular [2] imaging, disposable catheter probes perform scanning using external actuators and a drive shaft that relays torque and translation to optics mounted at the distal tip. Since catheters need to be highly flexible to accommodate anatomical tortuosity and to enable manipulation during the procedure, there is a necessary trade-off with the fidelity of torque and translation transfer. The resulting scanning inaccuracy produces image distortions that are commonly referred to as non-uniform rotation distortion (NURD) in the medical imaging community [8].
NURD is not stable in time because it depends not only on the particular probe, but on its geometric configuration and the particular path inside tortuous cavities in the body, both of which change dynamically with patient movement and pull-back position. New catheters have been envisioned to reduce this effect by placing a micromotor at the tip of the probe, directly rotating the optical assembly. However, it has been found that even in this case NURD persists due to the difficulty in fabricating micromotors that are perfectly balanced [9]. In all cases, non-deterministic inter-frame NURD variations inhibit a calibration-based approach.
Techniques used in NURD detection in intravascular ultrasound (IVUS) can be adapted to OCT. In [10] cross-correlations between image blocks in different IVUS frames are used to track tissue motion. Ref. [11] describes a technique that uses frequency analysis of the texture of the IVUS image to estimate the rotational speed; however, the relation between the average texture frequency and the rotational speed is purely empirical and lacks a suitable theoretical foundation. Other techniques in OCT make use of similarity between frames [12, 13]. All feature-based techniques share the same main drawback: they need a reference frame with no NURD, or at least zero-mean NURD in the whole data set. Otherwise they will not only correct for relative NURD between frames, but also propagate NURD present in the reference frame. Successful matches at all azimuthal positions for faithful tracking are not guaranteed; they require multiple frames in memory, and have non-deterministic processing times, which complicates their implementation for real-time correction. Recent work on detecting NURD in micromotor catheters [9] used the fixed struts that hold the structure of the micromotor as fiducials, but this approach provided only a low time-resolution measure of speed and unobstructed circumferential imaging is preferred.
In this work, we present a new technique for the correction of NURD in any type of catheter, based on the statistical variations of speckle between adjacent A-lines as described by intensity-based dynamic light scattering (iDLS-OCT) [14], and demonstrate its suitability in a commercial GI OCT system using a balloon catheter [6, 7]. iDLS-OCT relates the autocorrelation function of speckle with the transverse and lateral motion of the scatterers present in the tissue [14], and gives a solid foundation to the relation between the autocorrelation function of speckle to rotational speed. We show that it is possible to determine quantitatively the rotational speed of the catheter during each frame independently, facilitating real-time correction. This technique can determine the rotational speed with high time resolution, permitting the correction of sudden spikes in angular velocity as well as for slow variations in rotational speed.
Materials
We make use of clinical data sets, part of an ongoing clinical registry, acquired with an NvisionVLE™ Imaging System (NinePoint Medical, Inc., Bedford, MA), which is a frequency-domain OCT system with a wavelength-swept laser source having a 90 nm sweep range, centered at 1310 nm, with a 50 kHz repetition rate [6, 7]. The nominal rotational speed of the catheter is 12.2 rotations per second (RPS), the transverse e−2 beam radius is 33 μm, and each B-scan is composed of 4096 Alines. The system digitizes at 215 MS/s, and 3072 samples are taken per A-line. The system has a polarization-diverse receiver, and the squared signal from each channel is added to obtain the tomogram intensity I = |Ex|2 + |Ey|2. This intensity is transformed to a logarithmic scale and saved as an 8-bit unsigned integer, the only data accessible for implementing the NURD correction. The balloon catheter places the probe at the center of the esophagus, and when fully inflated has a diameter of approximately 20 mm. The balloon has a dark mark (~ 20–40 A-lines in width) used as an azimuthal registration line in each B-scan. This allows for tracking of the beginning and end of each frame. Prior to the correction, the data set is sliced, making use of this registration line, so that only A-lines belonging to a single frame are included in the analysis.
Theoretical basis and methods
The theory of intensity-based dynamic light scattering applied to the OCT signal has been studied thoroughly previously [14], therefore we only describe its main characteristics here. The second-order autocorrelation function of the OCT signal is defined as
| (1) |
where I(z) is the intensity at depth z. This function can be related to the first-order autocorrelation function through the Siegert relationship when the probability distribution of E is Gaussian. When considering many scatterers inside each resolution volume with deterministic translational and diffusive motions, Eq. (1) at a given depth becomes [14–16]
| (2) |
where n is the index of refraction, k0 the central wave number of the spectrum, D the diffusion constant of the scatterers, wz is the e−2 radius of the axial point spread function (PSF) of the system, wxy the e−2 radius of the transverse PSF of the system, vz the axial velocity and vxy the transverse velocity. In the present case, we will disregard Brownian motion. We have included the confocal effect into the single-mode fiber coupling factor as in Ref. [16]. Since the balloon is used to center the catheter, contributions from the axial speed are negligible. With y being the longitudinal direction, the pullback motion has a nominal speed of vy = 625 μm/s, while the nominal rotational speed produces a translational speed at the tissue surface of vx = 0.8 m/s. The large difference in order of magnitude allows us to approximate Eq. (2) to
| (3) |
By defining the speckle decorrelation time τc as the time when g(2) crosses the threshold 1 + gc, we have
| (4) |
where ĝc = −1/ log(gc), which is positive definite. Being l the distance between the center of rotation and the plane of the scatterers, the rotational speed ω in RPS depends on the speckle decorrelation time as
| (5) |
In practice, the OCT intensity signal I(t, z) is a discrete vector in both t and z. A discrete autocorrelation is calculated inside a correlation window of given width and depth, which gives an estimation of Eq. (3) inside the window. The repetition rate of the laser impose a time difference between A-lines Δt = 0.02 ms, determining the sampling interval of g(2). The NvisionVLE™ Imaging System is designed with an azimuthal oversampling factor of two over Nyquist: the transverse e−2 speckle diameter is roughly four A-lines, so speckle decorrelates completely at τ ~ 4Δt. As the measured decorrelation times are very close to the limit imposed by Δt, it is not possible to address the main effect of noise by removing the first point g(2)(τ = 0) [14]. For this reason, we only use the signal from tissue regions with high signal-to-noise ratio (SNR), >12 dB in this system (note the better noise performance than that in [14].) We note that we are not able to determine speeds in excess of roughly twice the nominal rotation speed, as this renders adjacent A-lines completely uncorrelated. This case is very rarely seen in clinical data sets. The low oversampling factor also has a detrimental effect on the accuracy of the estimation of the decorrelation time. A higher oversampling factor would significantly improve the estimation of the rotational speed, especially in regions with fast rotational speed. A low threshold gc is beneficial by allowing g(2) to decay further, but too low of a value is affected by noise for large τ [14]. A value of 0.25 performed best in our case. To further improve speed estimates at high SNRs we used the Pearson autocorrelation function definition [14].
The choice of correlation window lateral size determines the minimum speed measurable, and at the same time limits the temporal resolution of the measurement. We perform two autocorrelation analyses in each frame with different window widths and a fixed depth of 16 pixels (px). The first one, using a short 10 px-wide correlation window, is able to track sudden variations in speed, but overestimates speeds with decorrelation times larger than approximately half the correlation window, 0.1 ms or 4 RPS. The second analysis has a long 64 px window width to identify areas of slow rotational scanning down to approximately 0.5 RPS. Each autocorrelation function is averaged over the depth and the decorrelation time is calculated. A linear interpolation between g(2) data points is used to obtain the value τc at the crossing of the gc threshold, providing the estimation of the instantaneous rotational speed at each correlation window. When the decorrelation time of the long window is larger than a threshold (2.5Δt), this value is used instead of the short window value to obtain a final combined estimate. The per-window speed is piece-wise cubic interpolated to obtain an estimate for each A-line. This speed is integrated in time to obtain the actual azimuthal angle that corresponds to each A-line, and this angle is used to resample each frame at regular angular positions, correcting for deformations induced by NURD.
As discussed in [14], the correlation window width and the finite temporal resolution of the system can give rise to nonlinearities in Eq. (5). We performed a calibration to determine the parameters of the effective decorrelation time τeff
| (6) |
The calibration consisted of finding the set of k̃ parameters that minimized the frame-to-frame variance in a 3-D printed phantom data set with a known periodic structure. After optimization, the NURD-corrected data set had a lateral position root-mean-squared error compared to the ideal structure of 4.2wxy, which can be considered an estimation of the performance of the technique in absence of tissue motion. The function in Eq. (6) is used for each decorrelation time measured, and replaces in Eq. (5) to find the rotational speed.
It is important to exclude from the analysis areas of the image that contain microstructures that can bias the value of the decorrelation. Speckle generally dominates the autocorrelation function for the short window, but tissue structure can affect the long window. Fortunately tissue layering occurs in the xy plane and has little impact on the calculation. We implemented an automatic masking algorithm to identify shadows from mucus, saturation artifacts, glands and blood vessels, and we exclude these areas from the depth averaging of g(2).
Experimental results
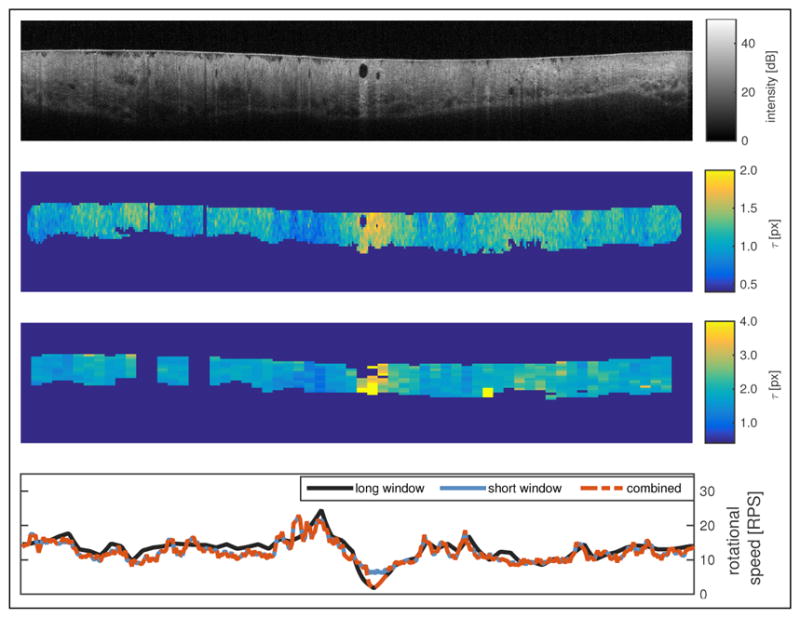
Figure 1 shows a typical tomogram and the results of the autocorrelation analysis. The decorrelation time maps show only the valid data points as determined by the automated masking process. It can be seen that inside those regions, the decorrelation time is generally homogeneous with depth, with NURD manifested as changes in τ as a function of azimuth. Also shown is the depth-averaged rotational speed for the short and long correlation windows, as well as for the combined result from both analyses. For some A-lines, however, there are no points left by the masking. In this instance, a cubic interpolation is made for both the short and long window analyses, taking as a reference a Gaussian filtered version of the available data.
Fig. 1.

(top) Original tomogram, (top center) map of τ using the short window, (bottom center) map of τ using the long window, (bottom) rotational speeds as a function of azimuthal position for both windows and the combined result. See Visualization 1 for a series of 24 frames.
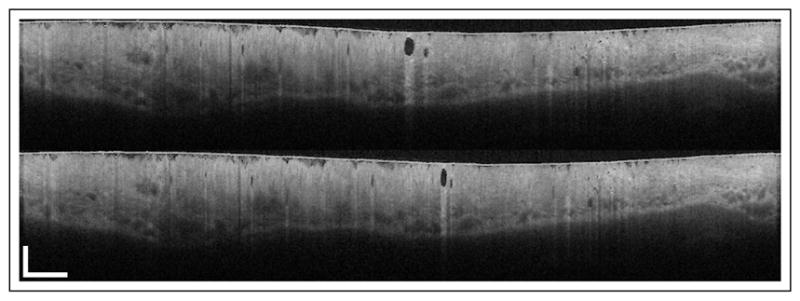
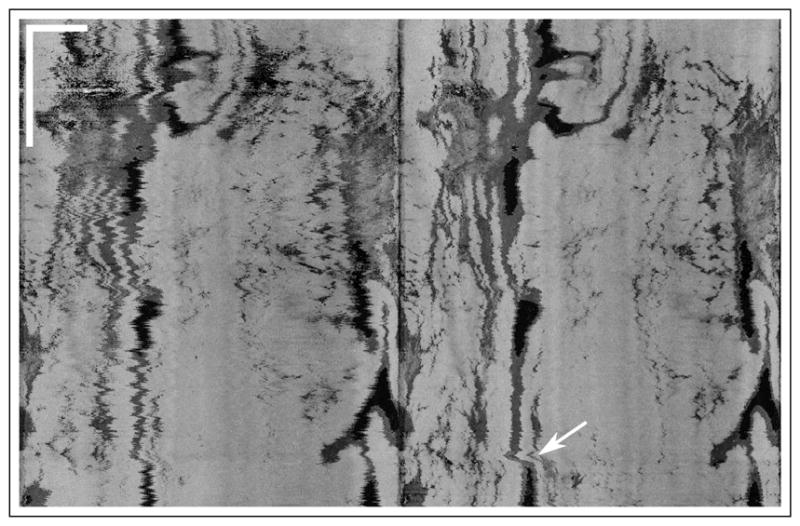
The final rotational speed results are used to correct for deformations in the image, as shown in Fig. 2. There are long-range deformations corrected, as seen by the displacement of the gland, as well as small range deformations, as seen by the change in the shape of the gland. En face projections are useful for tracking large structures and for evaluating the size of neoplastic tissue areas. Figure 3 shows the average intensity projection of another data set before and after correction. Broad dark regions correspond to tissue folds that inhibited proper contact between the tissue and the balloon, while small dark regions correspond to glands. Some jagged edges remain for two main reasons: first, the poor azimuthal oversampling effects on the estimation of the autocorrelation function; second, and more importantly, patient motion is not uncommon in GI OCT measurements, which can produce deformation of the tissue apart from a simple translation. While the balloon holds onto the tissue, the optical assembly can suffer small displacements with respect to the center of the balloon, which are readily visible in cross-sectional views. The frequency of the jagged lines in some areas suggests that patient heartbeat is the most probable cause for some of the remaining artifacts. There is also a large-scale artifact visible in the en face view, as indicated by the arrow, which was probably caused by patient intentional motion. High-frequency jagged lines are not prominent in those areas, suggesting that NURD was corrected and that the deformation of the tissue structures comes from either compression or expansion of the tissue, and possibly a change of the point of view from the displacement of the optical assembly inside the balloon.
Fig. 2.

(top) Original tomogram and (bottom) NURD-corrected tomogram after the analysis shown in Fig. 1. Scale bars at bottom left correspond to 10 mm in azimuthal and 1 mm in axial directions. See Visualization 2 for a frame series.
Fig. 3.

En face projection of (left) original tomogram and (right) NURD-corrected tomogram. The white arrow indicates patient motion. Scale bars at top left correspond to 10 mm in each direction. See Visualization 3 for a 24-frame fly through.
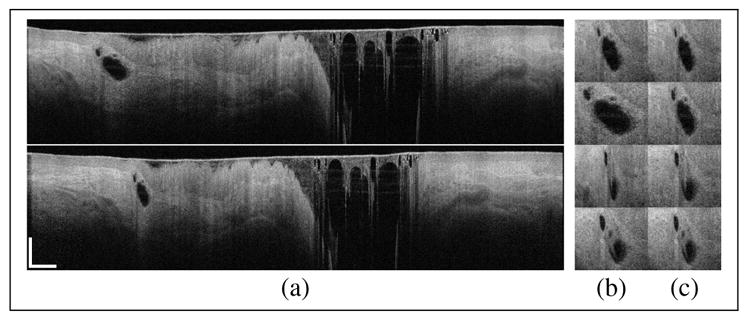
Data sets in Figs. 1, 2 and 3 had an average amount of NURD, typical of clinical data sets. Figure 4 shows a frame from a data set with extreme NURD, not regularly found in the clinic. Measurements with such strong NURD are usually discarded and new measurements are taken. We use it to assess the performance of our technique in a broader range of conditions, possibly found in other applications. After correction, Fig. 4(b), the size of the gland has changed, potentially reflecting its true size. This is seen by comparing the same gland across adjacent frames, which showed large changes in size that have been significantly reduced after correction. 24 adjacent frames can be seen in Visualization 4. It is clear that although our correction improves significantly the distortions in the image, there is still some frame-to-frame movement. There are several reasons for this. First, in some regions the speed of the catheter is so high adjacent A-lines are fully decorrelated and therefore the speed cannot be measured. This stresses the importance for sufficient azimuthal oversampling. Second, there is a large azimuthal range in every frame with bad tissue apposition and therefore no speckle signal for analysis. The rotational speed in these regions have been interpolated as explained before, but clearly the extreme NURD makes this interpolation inaccurate for such a large region. Bad apposition also generally leads to significant tissue motion, which can be seen by the continuous change in the appearance of the mucus from frame to frame. Even if NURD were corrected completely, frame-to-frame tissue motion would remain. It is important to note that the significant tissue morphology changes would also make this data set difficult for feature tracking algorithms [12, 13].
Fig. 4.

(a, top) Original and (a, bottom) NURD-corrected tomogram. The gland in (a) as seen in adjacent frames in the original (b) and NURD-corrected (c) data set. Scale bars correspond to 10 mm in azimuthal and 1 mm in axial directions. See Visualization 4 for a series of 24 frames.
According to the approximation used to obtain Eq. (3), we are disregarding motion that occurs in the zy plane. For example, if the catheter is subjected to a rapid motion in the longitudinal direction, a measurable decorrelation would result and the rotational speed would be overestimated. Significant axial movement produced by catheter decentering can produce a similar effect. We stress here the necessity of significant motion: the quadratic nature of the relation in Eq. (2) implies that a 10% error in rotational speed requires a speed of ~ 400 mm/s in y or ~ 100 mm/s in z. It is very rare to have motion of these magnitudes when using balloon catheters.
Conclusions
We presented a new technique that allows the accurate measurement of the rotational speed of an OCT catheter by means of the statistical fluctuations of the speckle in the tissue. This technique does not require tissue features for tracking, and does not rely on a reference frame with zero NURD. Furthermore, each frame can be analyzed and corrected independently, facilitating real-time correction. En face projections demonstrate the effectiveness of this technique, which has the potential to be used in OCT catheter probes in cardiovascular and gastrointestinal imaging, among others, without requiring a change in probe design. The correction of distortions of tissue features is paramount to enabling diagnosis guided by the shape of structures like glands, such as in the case of screening for dysplastic Barrett’s esophagus. Furthermore, the correction of macroscopic distortions may aid in the accurate determination of neoplastic tissue, enabling longitudinal surveillance of treatment effectiveness, or monitoring for disease progression in patients.
Supplementary Material
Acknowledgments
Funding. National Institute of Biomedical Imaging and Bioengineering of the National Institutes of Health (NIH) (P41 EB015903); Terumo Corporation.
The authors would like to thank David A. Vader and Benedikt W. Graf from NinePoint Medical, Inc. for the clinical and phantom data sets and valuable discussions.
Footnotes
OCIS codes: (110.4500) Optical coherence tomography; (170.3880) Medical and biological imaging; (110.4153) Motion estimation and optical flow; (280.7250) Velocimetry.
References
- 1.Huang D, Swanson EA, Lin CP, Schuman JS, Stinson WG, Chang W, Hee MR, Flotte T, Gregory K, Puliafito CA, Et A. Optical coherence tomography. Science. 1991;254:1178–1181. doi: 10.1126/science.1957169. [DOI] [PMC free article] [PubMed] [Google Scholar]
- 2.Yonetsu T, Bouma BE, Kato K, Fujimoto JG, Jang IK. Optical coherence tomography. Circ J. 2013;77:1933–1940. doi: 10.1253/circj.cj-13-0643.1. [DOI] [PubMed] [Google Scholar]
- 3.Izatt J, Kulkarni M, Wang HW, Kobayashi K, Sivak JMV. Optical coherence tomography and microscopy in gastrointestinal tissues. IEEE J Sel Top Quantum Electron. 1996;2:1017–1028. [Google Scholar]
- 4.Bouma BE, Tearney GJ. Power-efficient nonreciprocal interferometer and linear-scanning fiber-optic catheter for optical coherence tomography. Opt Lett. 1999;24:531. doi: 10.1364/ol.24.000531. [DOI] [PubMed] [Google Scholar]
- 5.Evans JA, Bouma BE, Bressner J, Shishkov M, Lauwers GY, Mino-Kenudson M, Nishioka NS, Tearney GJ. Identifying intestinal metaplasia at the squamocolumnar junction by using optical coherence tomography. Gastrointestinal Endoscopy. 2007;65:50–56. doi: 10.1016/j.gie.2006.04.027. [DOI] [PMC free article] [PubMed] [Google Scholar]
- 6.Wolfsen HC, Sharma P, Wallace MB, Leggett C, Tearney G, Wang KK. Safety and feasibility of volumetric laser endomicroscopy in patients with barrett’s esophagus (with videos) Gastrointestinal Endoscopy. 2015;82:631–640. doi: 10.1016/j.gie.2015.03.1968. [DOI] [PubMed] [Google Scholar]
- 7.Swager A, Boerwinkel DF, de Bruin DM, Weusten BL, Faber DJ, Meijer SL, van Leeuwen TG, Curvers WL, Bergman JJ. Volumetric laser endomicroscopy in barrett’s esophagus: a feasibility study on histological correlation. Dis Esophagus. 2015 doi: 10.1111/dote.12371. [DOI] [PubMed] [Google Scholar]
- 8.Kawase Y, Suzuki Y, Ikeno F, Yoneyama R, Hoshino K, Ly HQ, Lau GT, Hayase M, Yeung AC, Hajjar RJ, Jang IK. Comparison of nonuniform rotational distortion between mechanical IVUS and OCT using a phantom model. Ultrasound in Medicine & Biology. 2007;33:67–73. doi: 10.1016/j.ultrasmedbio.2006.07.020. [DOI] [PubMed] [Google Scholar]
- 9.Ahsen OO, Lee HC, Giacomelli MG, Wang Z, Liang K, Tsai TH, Potsaid B, Mashimo H, Fujimoto JG. Correction of rotational distortion for catheter-based en face OCT and OCT angiography. Opt Lett. 2014;39:5973–5976. doi: 10.1364/OL.39.005973. [DOI] [PMC free article] [PubMed] [Google Scholar]
- 10.Gatta C, Pujol O, Leor O, Ferre J, Radeva P. Fast rigid registration of vascular structures in IVUS sequences. IEEE Trans Inf Technol Biomed. 2009;13:1006–1011. doi: 10.1109/TITB.2009.2027230. [DOI] [PubMed] [Google Scholar]
- 11.Sathyanarayana S. Nonuniform rotational distortion (NURD) reduction. 7,024,025 B2. US Patent. 2006 Apr 4;
- 12.van Soest G, Bosch J, van der Steen A. Azimuthal registration of image sequences affected by nonuniform rotation distortion. IEEE Trans Inf Technol Biomed. 2008;12:348–355. doi: 10.1109/titb.2007.908000. [DOI] [PubMed] [Google Scholar]
- 13.Kang W, Wang H, Wang Z, Jenkins MW, Isenberg GA, Chak A, Rollins AM. Motion artifacts associated with in vivo endoscopic OCT images of the esophagus. Opt Express. 2011;19:20722–20735. doi: 10.1364/OE.19.020722. [DOI] [PMC free article] [PubMed] [Google Scholar]
- 14.Uribe-Patarroyo N, Villiger M, Bouma BE. Quantitative technique for robust and noise-tolerant speed measurements based on speckle decorrelation in optical coherence tomography. Opt Express. 2014;22:24411–24429. doi: 10.1364/OE.22.024411. [DOI] [PMC free article] [PubMed] [Google Scholar]
- 15.Lee J, Wu W, Jiang JY, Zhu B, Boas DA. Dynamic light scattering optical coherence tomography. Opt Express. 2012;20:22262–22277. doi: 10.1364/OE.20.022262. [DOI] [PMC free article] [PubMed] [Google Scholar]
- 16.Weiss N, van Leeuwen TG, Kalkman J. Localized measurement of longitudinal and transverse flow velocities in colloidal suspensions using optical coherence tomography. Phys Rev E. 2013;88:042312. doi: 10.1103/PhysRevE.88.042312. [DOI] [PubMed] [Google Scholar]
Associated Data
This section collects any data citations, data availability statements, or supplementary materials included in this article.


