

Abstract
This study examined the psychometric properties of the Sense of Coherence (SOC) Scale in the context of an oral health-related clinical trial conducted in an American Indian population – specifically, people of the Navajo Nation. Data were derived from baseline evaluations of parents (or caregivers) of Navajo children aged 3–5 from 52 Head Start classes enrolled in a trial of an intervention to prevent early childhood caries (ECC). A 190-item Basic Research Factors Questionnaire, which included the SOC, was administered to 1016 parents/caregivers. Assessment of internal reliability and convergent validity, and confirmatory factor analyses were conducted. Multiple linear regression analysis was used to examine associations between parents’ SOC and other potentially convergent measures. Confirmatory factor analysis was used to examine one- and three-factor solutions of the SOC scale. Higher SOC was significantly related to higher parental education and income, employment status, and higher scores for social support, internal oral health locus of control (OHLOC), self-efficacy, importance of oral health, oral health knowledge and behavior, and children’s oral health quality of life. Higher SOC also was related to lower reported distress and lower external OHLOC. Cronbach’s alpha was 0.84 for all SOC items, but lower for each of the three SOC subscales. Confirmatory factor analyses suggested a three-factor solution was superior to a one-factor solution. The SOC scale had good internal reliability and convergent validity in this American Indian population.
Keywords: Sense of Coherence, Early Childhood Caries, American Indian, Psychosocial Measures, Locus of control
This study examines the reliability and validity characteristics of the Sense of Coherence (SOC) Scale, which was used with a population of reservation-dwelling Navajo children and their parents (or caregivers) within the context of a clinical trial of an intervention for the prevention of early childhood caries (ECC). Grounded in Antonovsky’s salutogenic orientation to health, which focuses on factors that support health and well-being rather than on factors that cause disease (Antonovsky, 1987), SOC represents the degree to which an individual views the world and his or her life circumstances as coherent, an orientation that may support constructive responses to challenging life events, including a variety of health problems. Three components comprise an individual’s SOC: (1) the ability to understand the events in one’s life (comprehensibility), (2) confidence that one can manage these events (manageability), and (3) the sense that there is meaning in at least some of the challenges or situations one confronts (meaningfulness). Although Antonovsky described the three components as conceptually independent, he recommended use of the overall SOC in studying relationships of the construct to other variables.
Antonovsky originally interviewed Israeli women about the adaptation to menopause and later studied a group with experiences from the concentration camps of the Second World War who despite this stayed healthy (Eriksson, & Lindström, 2005). Antonovsky developed the SOC construct after observing that individuals in even the most challenging settings often were able to understand, manage, and find meaning in their difficulties and to incorporate these challenges into their lives in a positive way that reflected their values and perspectives (Antonovsky, 1987). He described how these same mechanisms might apply to one’s outlook and responses to a range of health challenges and accordingly, reasoned that Sense of Coherence offered promise for understanding factors that support more positive oral health behaviors by parents on behalf of their children.
Using this framework, we speculated that the downstream health effects of SOC could manifest themselves on oral health through: (1) a parent’s capacity or incapacity to understand why or how a child developed oral health problems (comprehensibility); (2) lack of resources either social or financial, to seek access to and carry out an oral health maintenance program prescribed by a dental professional, leading to lack of confidence (manageability); and (3) success or failure at integrating the child’s oral health condition into the reality and perspective of one’s life (meaningfulness). Investigators outside the U.S. have achieved mixed results in testing whether SOC represents an important psychological variable in response to oral health challenges (e.g., Nammontri, et al., 2012; Qui, Wong, Lo, & Lin, 2013).
In the context of the same clinical trial from which the data presented here are drawn, Albino et al. (2014) found that SOC was higher for the small percentage (11 percent) of Navajo parents, among a sample of 1016, whose preschool children were caries-free than for those whose children had experienced caries. These children and parents live on the Navajo Reservation, and experienced similar obstacles to oral health, such as low household incomes, limited access to transportation and oral health care services, and living in rural, often remote locations. The parents of the caries free children also reported placing higher importance on oral health of their children, reported more oral health knowledge and adherence to caries-preventing behaviors for their children and had higher internal Oral Health Locus of Control (OHLOC) scores.
Navajo and other American Indian and Alaska Native (AI/AN) communities face significant social and economic challenges. More than a quarter of people of AI/AN descent (29%) live in poverty, compared with 15.3% of people nationally (DeNavas-Walt, Proctor and Smith, 2012)). Unemployment in Navajo is as high as 48.5% and average household income is $8,240, well below the federal poverty guidelines (NN Agriculture, 2007). American Indians also face significant challenges to health, including oral health. AI children have more dental decay than any other population group in the country, and Navajo children have the highest (worst) rates of dental caries (decay) in Indian country (Phipps, Ricks, Manz & Blahut, 2012). Further, health, practical, and social situations with the potential to create major disruptions in parenting and child oral health care are abundant. The impact of social determinants of health on this vulnerable population is likely, yet because SOC has not previously been used in a Navajo (or other American Indian) sample, it is important to look more closely at the test statistics to understand how the measure functions in this population group.
We assessed internal consistency, reliability, and convergent validity with respect to other relevant psychosocial and health knowledge scales and factor structure of the SOC scale, as well as the association of SOC with demographic characteristics of the sample. Given previous research suggesting that sociodemographic characteristics are associated with SOC (Larsson & Kallenberg, 1996; Leino-Loison, Gein, Katajisto & Välimäki, 2004; Lundberg, 1997), for purposes of validation, we hypothesized that higher levels of SOC would be associated with age, gender, education, employment, and income. Validation of the SOC scale in a Navajo sample will help to support future research aimed at understanding the relationship between SOC and oral health outcomes, as well as other potential topics in studies in American Indian communities.
Methods
Study Sample
We collected baseline data in 2011 and 2012, in the Navajo Nation Head Start population participating in the clinical trial, “Preventing Caries in Preschoolers: Testing a Unique Service Delivery Model in American Indian Head Start Programs” (Quissell et al., 2014). The study sample included children ages 3–5 enrolled in 52 Head Start classes in the Navajo Nation, along with their parents and caregivers. Data included scores from the Basic Research Factors Questionnaire (BRFQ) completed by the parent/caregiver, which assessed parental/caregiver SOC, along with other attitudes, knowledge, and behaviors. The data dictionary for all BRFQ measures used in this study can be found on the website for the Early Childhood Caries Collaborating Centers (http://oralhealthdisparities.ucsf.edu). This study was approved by the Navajo Nation Human Research Review Board (NNHRRB), governing bodies at tribal and chapter levels, the tribal departments of Head Start and Education, Head Start parent councils, and the Colorado Multiple Institution Review Board. This paper was reviewed and approved by the NNHRRB. All adult participants and parents of child participants provided written informed consent before initiating study activities.
A total of 1016 Navajo parents completed the BRFQ. Table 1 reports demographic and socioeconomic characteristics of the study sample. Parents’ mean age was 32 years (SD = 9.3). Most were female (84%), had a high-school degree (or GED) or higher (84%), were not employed (72%), and had low income (41% had total family income < $10,000).
Table 1.
Demographic characteristics of respondents with mean Sense of Coherence Scale (SOC)
| Characteristic | Total N=1015 | Sense of Coherence Mean (SD) | p |
|---|---|---|---|
| Age | |||
| Mean (SD) | 31.89 (9.31) | – | – |
| Range | 19 – 88 | ||
| Gender n (%) | |||
| Male | 165 (16.26) | 5.17 (1.06) | 0.48 |
| Female | 850 (83.74) | 5.24 (1.07) | |
| Education n (%) | |||
| Less than HS | 159 (15.85) | 5.13 (1.08)1 | 0.001 |
| HS or GED | 373 (37.19) | 5.10 (1.10)1 | |
| Some college/vocational | 352 (35.09) | 5.31 (1.03) | |
| College degree or more | 119 (11.86) | 5.50 (0.95) | |
| Employment n (%) | |||
| Employed | 279 (28.30) | 5.37 (0.96) | 0.009 |
| Unemployed | 707 (71.70) | 5.17 (1.10) | |
| Income n (%) | |||
| 0 to <10K | 421 (41.48) | 5.05 (1.10) | <0.0001 |
| 10 to <20K | 176 (17.34) | 5.28 (1.03) | |
| 20 to <30K | 94 (9.26) | 5.48 (1.00)2 | |
| 30 to <40K | 69 (6.80) | 5.47 (0.94)2 | |
| 40K and up | 91 (8.97) | 5.50 (0.92)2 | |
| Missing | 164 (16.16) | 5.20 (1.09) |
= significantly different from College degree or more (p<0.05 Bonferroni).
= significantly different from zero to less than $10K (p<.05 Bonferroni).
Measures
For this paper, we focused on validation of the thirteen item short-form SOC scale. Eight convergent constructs were chosen based on relationships suggested by the literature, including Antonovsky’s work (Antonovsky, 1993). We will specify the investigators’ hypotheses regarding how the SOC scale might be related to other measures. Eight psychosocial measures were included (Distress, Social Support, Oral Health Locus of Control (Internal, External, and Chance), Pediatric Oral Health Quality of Life, Self-Efficacy, Importance (of Oral Health Behaviors), as well as oral health knowledge and oral health behavior items.
Sense of Coherence
We used the thirteen item short-form SOC scale (Antonovsky, 1987). Response values for all individual items ranged from 1 to 7. Antonovsky (Antonovsky, 1987, 1993) did not recommend using the three components as separate constructs for the purpose of predicting behaviors. Therefore, an overall mean score [1 to 7] was calculated for each individual’s responses to the thirteen items, with a higher score indicating stronger SOC. All of these measures were embedded within the 190 item Basic Research Factors Questionnaire (BRFQ). The BRFQ was developed by working groups involving more than 30 investigators working with the three collaborating oral health disparities research centers funded by the National Institute of Dental and Craniofacial Research. These centers located at the University of Colorado, Boston University, and University of California San Francisco each added or deleted some items based on characteristics of their respective study populations.
Nonspecific Psychological Distress
We used the 6-item K6 nonspecific psychological distress scale developed by Kessler et al. (2002) to measure parent distress. Responses were measured on a scale of 1 to 5, with higher mean scores indicating more distress. Cronbach’s alpha for this scale was 0.81. Several studies have found that the higher a person’s SOC, the less distress they report (11–13). Therefore, we hypothesized that stronger SOC in American Indian parents would be negatively correlated with their perceived distress.
Instrumental Social Support
Instrumental social support in this study refers to the perceived availability of social and material support. This was measured as the mean of responses to four items adapted from McLlyod and colleagues (McLoyd, Jayaratne, Ceballo & Borquez, 1994). Each item indicates whether or not participants have someone they can count on to provide specific types of instrumental social support (e.g., run errands, loan money, provide childcare, provide a ride somewhere), with each item scored as 0 = no and 1 = yes (McLoyd et al., 1994). Higher scores indicate that an individual has greater instrumental social support. Cronbach’s alpha for this scale was 0.76. Limited research has shown that “emotional social support” has a positive effect on an individual’s SOC (Wolff & Ratner, 1999), although the relationship of “instrumental social support” to SOC has not yet been investigated. For the purposes of this investigation, we hypothesized that instrumental social support also would be positively related to SOC.
Oral Health Locus of Control (OHLOC)
The nine items included in the Oral Health Locus of Control (OHLOC) scale were adapted from two sources (Lenčová, Pikhart, Broukal, & Tsakos, 2008; Carnahan, 1980). The OHLOC construct comprises three sub-constructs measuring beliefs about sources of control over oral health; the components represent internal control, external control from powerful others (e.g., it is the responsibility of the dentist to prevent my child from getting tooth decay), and external control from chance (e.g., it just happens that children get tooth decay). Each subscale includes three questions, scored from 1=strongly disagree to 5=strongly agree. The score for each component is computed as the average score for all items within the component and represents the extent to which participants believe control for their child’s oral health outcomes lies with the parent (internal OHLOC), the dentist (powerful other OHLOC), or is up to chance (chance OHLOC). Cronbach’s alphas for internal, chance, and powerful other OHLOC were 0.59, 0.63, and 0.71, respectively. Research has supported the inverse relationship between external OHLOC and overall SOC, with greater attribution to external sources of control related to weaker SOC (Bränholm, Fugl-Meyer, & Frölunde, 1998). Given the evidence, we hypothesized that higher SOC would be positively associated with internal OHLOC and negatively associated with external OHLOC.
Oral Health-Related Quality of Life
We used the 12-item preschool version of the Pediatric Oral Health Quality of Life (POQL) instrument developed and validated by Huntington et al. (2011) to assess parents’ perceptions of the extent to which their children’s psychosocial well-being and functioning are impacted by negative oral health experiences (Huntington et al., 2011). The 12 items for this assessment reflect the frequency with which oral health-related distress (crying, pain, anger, worry) and dysfunction (trouble eating, or missing school or daycare) were reported by parents to be experienced by the child and how much it was believed to bother the child. An overall POHQL score had a possible range of 0 to 100. Higher scores indicate worse oral health-related quality of life. Cronbach’s alpha for the frequency of distress and dysfunction questions for this scale was 0.81. SOC has been shown to influence overall quality of life with stronger SOC being associated with better quality (Eriksson & Lindström, 2007). We hypothesized that the positive relationship demonstrated between overall quality of life and SOC would hold for Oral health-related quality of life and SOC as well.
Self-efficacy
Self-efficacy is described as one’s perceived “ability to succeed in specific situations” (Bandura, 1977). In this study, twelve items with scores ranging from 1 to 5 were developed to capture parents’ confidence that they could engage in twelve specific parental oral health behaviors. The parental oral health self-efficacy scale (which is available from the authors) was developed for the study and targeted specific behaviors highlighted in the study intervention, including oral hygiene (e.g., brushing your child’s teeth twice a day), diet (e.g., avoiding sugary foods and drinks), and preventive oral health behavior (e.g., taking your child to the dentist). The scale was developed in collaboration with two other oral health disparities research centers as described earlier, with items being adapted from existing measures (Litt et al., 1995) and, in some cases, newly developed. Self-efficacy was computed as the mean score of the twelve items; higher scores indicate stronger self-efficacy. Cronbach’s alpha for this scale was 0.83. We hypothesized that self-efficacy would be positively related to SOC overall.
Importance
Whereas self-efficacy items asked parents how confident they were that they could engage in a given parental oral health behavior (e.g., taking your child to the dentist for regular check-ups), importance items asked parents how important they felt it was that they engage in that behavior. Importance was measured using twelve items developed by the three collaborating oral health disparities centers. Items were developed similarly and parallel to the self-efficacy items and assessed perceived importance of specific behaviors recommended in the intervention (items are available from the authors). Mean scores for the twelve items ranged from 1 to 5. A higher score can be interpreted as the parent attributing more importance to the practice of good oral health practices. Cronbach’s alpha for this scale was 0.89. We hypothesized that importance would be positively associated with overall SOC.
Parental Oral Health Knowledge and Behavior
Knowledge and behavior items were a part of the BRFQ, development process described above, to assess knowledge and behavior related to specific oral health recommendations made in the intervention. Knowledge was measured using 16 questions that addressed parental knowledge regarding appropriate oral health behavior. Responses were coded as correct or incorrect. A composite score of parental oral health knowledge was developed by calculating the percentage of the knowledge items answered correctly. Therefore, a higher score indicates greater oral health knowledge. Cronbach’s alpha for this scale was 0.49. We hypothesized that overall SOC would be positively related to parental oral health knowledge.
We measured parental reported oral health-related behaviors with 9 items, each measuring adherence to a specific behavior performed by the parent (e.g. “How often are your child’s teeth brushed?”). Responses had varying formats. Each item response was dichotomized into “adherent” or “non-adherent” based on its consistency with current recommendations for good oral health care. An overall behavior score was calculated as the percentage of items for which a participant reported behavior consistent with standards of good oral health care. Cronbach’s alpha for this scale was 0.56. Use of a self-reported measure of behavioral adherence raised the question of possible social desirability bias. Response bias is probably minimal, however because: (a) parents had substantially lower behavioral adherence scores than knowledge scores, suggesting that behavioral self-report was an accurate reflection of their behavior, and (b) behavior scores were significantly associated with pediatric oral health outcomes (Wilson et al., 2014). We hypothesized that parental oral health-related behaviors would also be positively related to SOC.
Sociodemographics
We measured the sociodemographic characteristics of the participants including parent age, gender, education, employment and income.
Data Analyses
Descriptive statistics were generated for all sociodemographic variables and analyses of variance (ANOVA) were used to examine their association with SOC. For each level of demographic variable, a mean and standard deviation (SD) were calculated for the overall SOC score and then comparisons were made across the levels of each sociodemographic variable.
Means and SDs were calculated for each of the thirteen items of the SOC scale. The association between total SOC score and the three SOC components and the other psychosocial measures was examined using multiple linear regression analysis, with SOC as the independent variable and the other psychosocial measures as the dependent variable. The sociodemographic variables (age, gender, education, employment, and income) were covariates in the models to adjust for their effects.
Confirmatory factor analyses were employed to examine the factor structure underlying the SOC measure. An orthogonal three-factor structure was tested as well as a one-factor global structure. Models were compared using maximum-likelihood goodness of fit chi-square (χ2), where a non-significant chi-square value indicates a good model fit. We also calculated the Goodness of Fit Index (GFI) and the standardized root mean square residual (RMSR). A GFI value greater than 0.90 indicates a good model fit whereas the RMSR represents the amount of variance in the item responses that is unaccounted for by the factors. A standardized RMSR <0.05 is considered as acceptable model fit. Finally, Akaike’s Information Criterion was generated, where a lower value indicates a better fitting model.
Choice of the number of factors to include was guided by prior literature on the factor structure of the SOC scale (Eriksson & Lindström, 2005; Feldt et al., 2007; Gana & Garnier, 2001; Sandell, Blomberg, & Lazar, 1998). Cronbach’s alpha was calculated to estimate the internal consistency reliability of the SOC scale. All analyses were completed using SAS/STAT® software, version 9.2.
Results
The overall mean SOC score was 5.2 (SD 1.0) out of a possible score of 7. As shown in Table 1, SOC did not differ by gender (p = 0.48). However, SOC was significantly lower in parents with a high school diploma/GED or less than for parents with some college/vocational training, a college degree, or more (p=0.001). Parents who were employed also had a higher SOC than non-employed parents (p=0.009). Higher SOC also was associated with higher levels of income (p<0.0001).
Table 2 displays means and SD’s for each of the thirteen items in the SOC scale. Questions 1–4 comprise Antonovsky’s original meaningfulness component, questions 5–9 comprise his original comprehensibility component, and questions 10–13 comprise his original manageability component. For some items (#2, 4, 6–9, 11, 13), a high score represents better SOC, while for other items (#1, 3, 5, 10, 12), a low score represents better SOC. For the former items, average scores ranged from 4.74 to 5.73; for the latter items, average scores ranged from 2.20 to 4.16. In the computation of the overall SOC for each participant, items 1, 3, 5, 10, and 12 were reverse coded so that a higher mean SOC score indicates greater SOC.
Table 2.
Item characteristics for Sense of Coherence Scale (SOC) (n = 985)
| Item* | Here’s a series of questions relating to various aspects of our lives. Each question has seven possible answers. Please mark the number that best expresses your feelings. | Mean (SD) |
|---|---|---|
| 1 | Do you have the feeling that you don’t really care what goes on around you? Very Seldom or Never (1) – Very Often (7) | 3.02 (2.04) |
| 2 | Until now, your life has had: no clear goals or purpose at all (1) – very clear goals and purpose (7) | 5.72 (1.60) |
| 3 | Doing the things you do every day is: a source of deep pleasure and satisfaction (1) – a source of pain and boredom (7) | 2.20 (1.55) |
| 4 | How often do you have the feeling that there’s little meaning in the things you do in your daily life? Very Often (1) – Very Seldom or Never (7) | 5.61 (1.78) |
| 5 | Has it happened in the past that you were surprised by the behavior of people you thought you knew well? Never Happened (1) – Always Happened (7) | 3.97 (2.06) |
| 6 | Do you have the feeling that you are in an unfamiliar situation and you don’t know what to do? Very Often (1) – Very Seldom or Never (7) | 5.60 (1.82) |
| 7 | Do you have very mixed-up feelings and ideas? Very Often (1) – Very Seldom or Never (7) | 5.45 (1.84) |
| 8 | Does it happen that you have feelings inside you would rather not feel? Very Often (1) – Very Seldom or Never (7) | 5.39 (1.91) |
| 9 | When something happened, have you general found that: you overestimated or underestimated its importance (1) – you saw things in the right proportion (7) | 4.74 (1.83) |
| 10 | Has it happened to you that people you counted on disappointed you? Never Happened (1) – Always Happened (7) | 4.16 (2.04) |
| 11 | Do you have the feeling that you’re being treated unfairly? Very Often (1) – Very Seldom or Never (7) | 5.73 (1.77) |
| 12 | Many people – even those with a strong character – sometimes feel like sad sacks (losers) in certain situations. How often have you felt this way in the past? Never (1) – Very Often (7) | 2.75 (1.82) |
| 13 | How often do you have feelings that you’re not sure you can keep under control? Very Often (1) – Very Seldom or Never (7) | 5.70 (1.73) |
Items 1–4 belong to the Meaningfulness sub-scale, 5–9 belong to the Comprehensibility sub-scale, and items10–13 belong to the Manageability sub-scale.
The regression relationships between total SOC score and each of the other psychosocial measures, adjusted for the sociodemographic variables, are reported in Table 3. All relationships go in the hypothesized directions, with the exception that the association between chance OHLOC and SOC is not statistically significant (p = 0.11). All other associations are statistically significant. The regression relationships between each of the three SOC components and each of the other psychosocial measures all went in the same directions as for the total SOC score, and all of the relationships were statistically significant (p < 0.05), with the exception of the comprehensibility and manageability components with chance and powerful others OHLOC (data not shown). Cronbach’s alpha for all thirteen SOC items was 0.84,and it was 0.61, 0.68, and 0.56, respectively, for the items within each of the meaningfulness, comprehensibility, and manageability components.
Table 3.
Association between Sense of Coherence Scale (SOC) and Other Psychosocial Measures
| Psychosocial Measure | Scale | Regression Coefficient | P-value |
|---|---|---|---|
| Distress | 1 – 5 | −0.32 | <0.0001 |
| Social Support | 0 – 1 | 0.09 | <0.0001 |
| Locus of Control—Internal | 1 – 5 | 0.11 | 0.0002 |
| Locus of Control—Chance | 1 – 5 | −0.05 | 0.11 |
| Locus of Control—Others | 1 – 5 | −0.07 | 0.02 |
| Oral Health Quality of Life | 0 – 100 | −1.37 | <0.0001 |
| Self-efficacy | 1 – 5 | 0.08 | <0.0001 |
| Importance | 1 – 5 | 0.07 | <0.0001 |
| Oral Health Knowledge | 0 – 100 | 1.51 | <0.0001 |
| Oral Health Behaviors | 0 – 100 | 2.88 | <0.0001 |
Results of confirmatory factor analyses (CFA) and model fit statistics are presented in Table 4. The maximum-likelihood chi-square and the GFI indicate that both the one-factor global model (χ2=1652.6, p<0.001, GFI=0.79) and the three-factor orthogonal model (χ2=1514.7, p<0.001, GFI=0.81) provided inadequate fits for the data. However, although neither model fit well, the three-factor orthogonal model (AIC=1578.7) provided a better fit for the data than the one-factor global model (AIC=1706.6). The amount of variance in participants’ responses accounted for by the one-factor global model was 38% and 61% by the three-factor orthogonal model.
Table 4.
Goodness-of-fit Statistics for Factor Models of Sense of Coherence Scale (SOC) in Navajo Nation Parents and Caregivers
| Measures of Fit
|
|||||
|---|---|---|---|---|---|
| Factor Model | χ2* | df | GFI | RMSR** | AIC |
| One-factor global | 1652.6* | 64 | 0.79 | 0.11 | 1706.6 |
| Three-factor orthogonal: Manageability, Meaningfulness, Comprehensibility | 1514.7* | 59 | 0.81 | 0.11 | 1578.7 |
GFI: Goodness-of-fit Index, RMSR: root mean square residual, AIC: Akaike’s Information Criterion
Significant at the α 0.05 level
Standardized RMSR
As seen in Figures 1 and 2, the standardized factor loadings for the single items of the thirteen item SOC scale were highly variable. Factor loading scores in the one-factor global model range from 0.12 to 0.83; the range was 0.11 to 0.87 in the three-factor orthogonal model. Six of the thirteen SOC items had factor loadings >0.5 in the one-factor global model (items 4, 6, 7, 8, 10, 11, and 13), and six items in the three-factor orthogonal model had factor loadings >0.5 (items 4, 6, 7, 8, 11, and 13). Two items had particularly low factor loadings (0.11–0.13) in both the one-factor and three-factor models. These were Item 5 (“Has it happened in the past that you were surprised by the behavior of people you thought you knew well?”) and Item 10 (“Has it happened to you that people you counted on disappointed you?”). When the two factors with low loadings were removed and the CFA was re-computed, the factor loadings reported in Figures 1 and 2 were virtually identical, but the chi-square values were reduced to 776.5 for the one-factor model and 636.5 for the three-factor model, the GFIs were increased to 0.86 and 0.89, and the standardized RMSRs were reduced to 0.07, showing better fit statistics.
Figure 1.
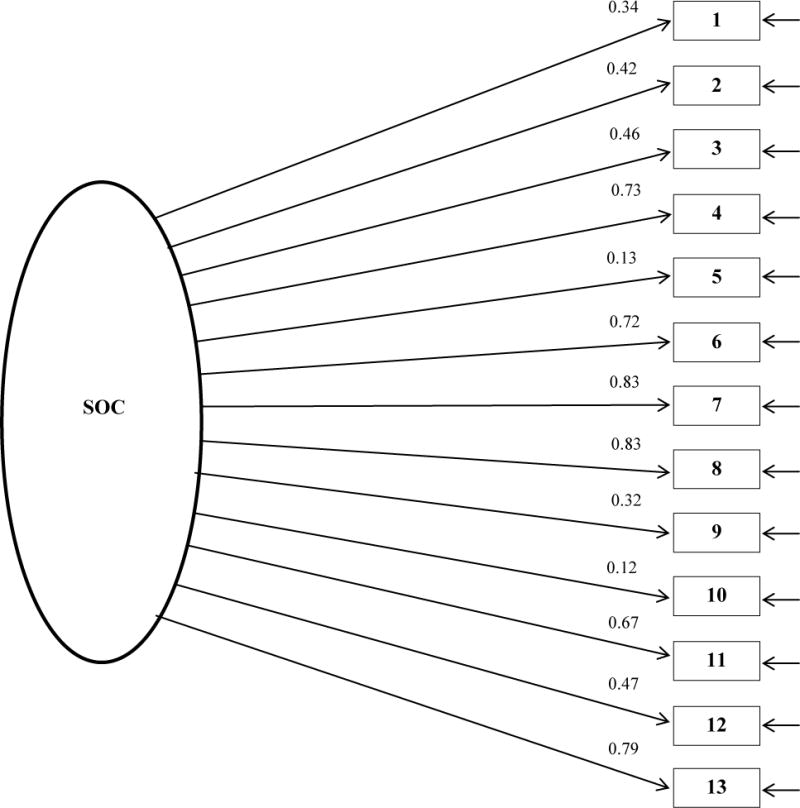
Standardized solutions for the orthogonal global factor model
Figure 2.
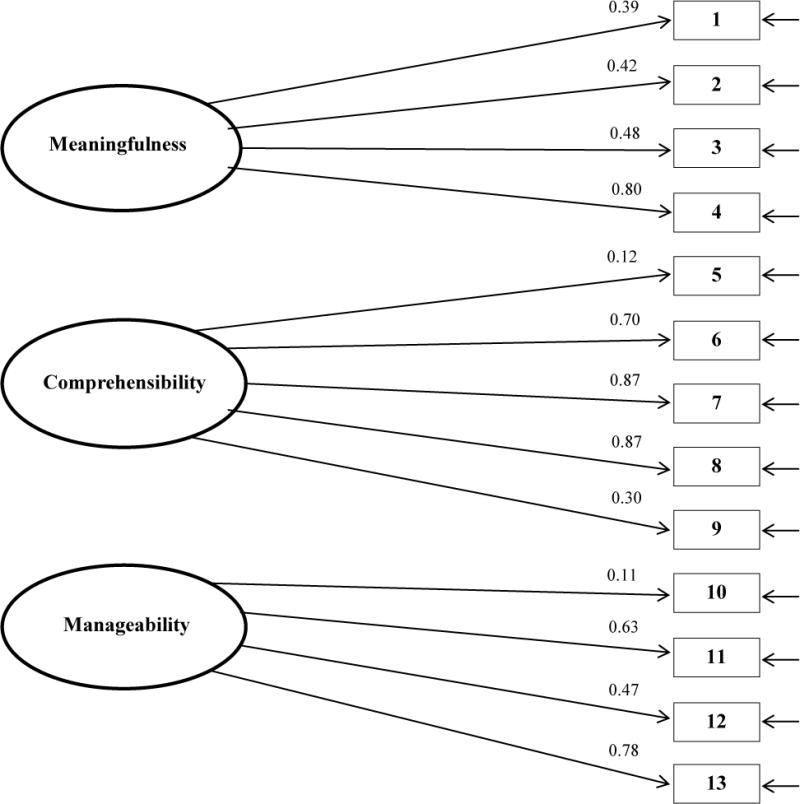
Standardized solutions for the orthogonal three factor model
Discussion
In this study, we found that the convergent relationships between the SOC scale and other psychosocial measures and sociodemographic variables were consistent with what we had hypothesized with the exception of chance OHLOC, suggesting that the SOC scale has strong convergent validity in this sample of Navajo parents of preschool children. The Cronbach’s alpha analyses suggested that the overall set of thirteen SOC items has strong internal consistency, but that consistency is lower for the briefer components. Although convergent validity of the SOC scale was supported, and internal consistency was strong for the full item set, construct validity of the factor models tested was not supported suggesting the possibility that they do not fit well with Antonovsky’s original constructs or at least not for our population of Navajo parents. Two previous reports of factor analyses of the SOC scale have produced similar results. An analysis in a sample of psychotherapy patients found that neither the one-factor structure nor the three-factor structure could be confirmed (Sandell et al., 1998). Sandell et al. (1998) also performed an exploratory factor analysis and found that, although three factors emerged, the items that loaded in each factor were only partly consistent with the three subscales proposed by Antonovsky. Comprehensibility and meaningfulness were distinguishable, but items from the manageability component loaded across all three factors, suggesting instability of this component (Sandell et al., 1998). Feldt et al. (2007), however, were able to confirm the three factor structure for the thirteen item SOC scale using structural equation modeling techniques in a sample of Finnish adults. A comprehensive review by Eriksson & Linstrom reported studies that found one-factor solutions, two-factor solutions, and even a five-factor solution for the SOC scale in different populations (Eriksson & Lindström, 2005).
The inconsistencies of these results may be due to different analytic approaches such as factor analysis versus principal components analysis and orthogonal versus oblique factor rotations. Alternatively, they also may result from different life experiences and coping strategies of the population studied. The SOC scale was designed to measure an individual’s “global orientation” (Antonovsky, 1987), and although the scale has been translated into 33 languages (Eriksson & Lindström, 2005), the items may not effectively capture diversity across all cultures, particularly in terms of the meaning or interpretation of specific items. For example, a reference to people ‘disappointing you’ might be perceived as much more serious within one cultural group than another, thereby creating greater hesitation or reluctance to report that response. According to Braun-Lewensohn & Sagy (2011), SOC is a significant protective factor in most cultures when facing a stressful situation. Levels of SOC have been demonstrated to be different among diverse cultural groups such as Jewish, Muslim and Druze, and it is possible for various cultures to have their own translations for personal sense of coherence (Braun-Lewensohn & Sagy, 2011). The SOC, or behaviors related to life challenges for American Indian communities may be influenced by belief systems and customs, or other aspects of culture. Moreover, in spite of many commonalities in the beliefs and customs across Native peoples, there are differences among tribes, and we cannot assume that the picture of SOC within Navajo Nation parents that is presented here would be reflected by parents of other tribes.
While the use of an orthogonal three-factor model rather than an oblique model raises a legitimate question, we believe that the requirement for specification of the correlation structure between oblique factors would make that model particularly inappropriate in this case. The potential cultural and related uncertainties we described in the preceding paragraphs would likely also contribute to difficulties in estimating the relationships among the components of the SOC construct and the three factors. Further analyses are needed, however, to establish an appropriate factor structure for the SOC scale in AI parents. Exploratory factor analyses may help to identify a factor structure that adequately fits the data collected as part of this project.
Although the work presented here did not conclusively support the use of either of Antonovsky’s proposed one-factor global structure or our hypothesized three-factor structure (manageability, comprehensibility, and meaningfulness) we did find impressive convergent validity of the SOC scale with sociodemographic factors and other psychosocial scales in the hypothesized directions.
These analyses for the Sense of Coherence measure support the continuing use of the construct in work that is aimed at understanding psychosocial aspects of health and, in particular, factors contributing to the oral health of American Indian children.
Acknowledgments
The grant support for this project is National Institute of Health-National Institute of Dental and Craniofacial Research (NIH-NIDCR) award number U54DE019259 (PI: Albino). Basic Research Factors Questionnaire (BRFQ) developed with support from: U54DE019285, U54DE019275, and U54DE019259.
References
- Albino J, Tiwari T, Henderson WG, Thomas J, Bryant LL, Batliner TS, Quissell DO. Learning from caries-free children in a high-caries American Indian population. Journal of public health dentistry. 2014;74(4):293–300. doi: 10.1111/jphd.12058. [DOI] [PMC free article] [PubMed] [Google Scholar]
- Antonovsky A. Unraveling the mystery of health: How people manage stress and stay well. Jossey-Bass; 1987. [Google Scholar]
- Antonovsky A. The structure and properties of the sense of coherence scale. Social Science and Medicine. 1993;36(6):725–733. doi: 10.1016/0277-9536(93)90033-z. [DOI] [PubMed] [Google Scholar]
- Bandura A. Self-efficacy: toward a unifying theory of behavioral change. Psychological Review. 1977;84(2):191. doi: 10.1037//0033-295x.84.2.191. [DOI] [PubMed] [Google Scholar]
- Bränholm I-B, Fugl-Meyer AR, Frölunde A. Life satisfaction, sense of coherence and locus of control in occupational therapy students. Scandinavian Journal of Occupational Therapy. 1998;5(1):39–44. Retrieved from http://informahealthcare.com/doi/abs/10.3109/11038129809035727. [Google Scholar]
- Braun-Lewensohn O, Sagy S. Salutogenesis and culture: Personal and community sense of coherence among adolescents belonging to three different cultural groups. International review of psychiatry. 2011;23(6):533–541. doi: 10.3109/09540261.2011.637905. [DOI] [PubMed] [Google Scholar]
- DeNavas-Walt C, Proctor BD, Smith JC. Income, poverty, and health insurance coverage in the United States. 2012 Retrieved from http:/www.census.gov/prod/2013pubs/p60-245.pdf.
- Dye BA, Tan S, Smith V, Lewis BG, Barker LK, Thornton-Evans G, Li CH. Trends in oral health status: United States, 1988–1994 and 1999–2004. Vital Health Stat. 2007;11(248):1–92. [PubMed] [Google Scholar]
- Edelstein BL. Solving the Problem of Early Childhood Caries A Challenge for Us All. Archives of Pediatrics and Adolescent Medicine. 2009;163(7):667–668. doi: 10.1001/archpediatrics.2009.107. [DOI] [PubMed] [Google Scholar]
- Eriksson M, Lindström B. Validity of Antonovsky’s sense of coherence scale: a systematic review. Journal of Epidemiology and Community Health. 2005;59(6):460–466. doi: 10.1136/jech.2003.018085. [DOI] [PMC free article] [PubMed] [Google Scholar]
- Eriksson M, Lindström B. Antonovsky’s sense of coherence scale and its relation with quality of life: a systematic review. Journal of Epidemiology and Community Health. 2007;61(11):938–944. doi: 10.1136/jech.2006.056028. [DOI] [PMC free article] [PubMed] [Google Scholar]
- Feldt T, Lintula H, Suominen S, Koskenvuo M, Vahtera J, Kivimaki M. Structural validity and temporal stability of the 13-item sense of coherence scale: prospective evidence from the population-based HeSSup study. Quality of Life Research. 2007;16(3):483–493. doi: 10.1007/s11136-006-9130-z. [DOI] [PubMed] [Google Scholar]
- Gana K, Garnier S. Latent structure of the sense of coherence scale in a French sample. Personality and Individual Differences. 2001;31(7):1079–1090. http://dx.doi.org/10.1016/S0191-8869(00)00205-1. [Google Scholar]
- Huntington NL, Spetter D, Jones JA, Rich SE, Garcia RI, Spiro A., III Development and validation of a measure of pediatric oral health-related quality of life: the POQL. J Public Health Dent. 2011;71(3):185–193. [PMC free article] [PubMed] [Google Scholar]
- Ismail AI, Lim S, Sohn W, Willem JM. Determinants of early childhood caries in low-income African American young children. Pediatr Dent. 2008;30:289–296. [PubMed] [Google Scholar]
- Kessler RC, Andrews G, Colpe LJ, Hiripi E, Mroczek DK, Normand SL, Zaslavsky AM. Short screening scales to monitor population prevalences and trends in non-specific psychological distress. Psychological medicine. 2002;32(06):959–976. doi: 10.1017/s0033291702006074. [DOI] [PubMed] [Google Scholar]
- Larsson G, Kallenberg KO. Sense of coherence, socioeconomic conditions and health Interrelationships in a nation-wide Swedish sample. The European Journal of Public Health. 1996;6(3):175–180. [Google Scholar]
- Leino-Loison K, Gien LT, Katajisto J, Välimäki M. Sense of coherence among unemployed nurses. Journal of advanced nursing. 2004;48(4):413–422. doi: 10.1111/j.1365-2648.2004.03210.x. [DOI] [PubMed] [Google Scholar]
- Lenčová E, Pikhart H, Broukal Z, Tsakos G. Relationship between parental locus of control and caries experience in preschool children–cross-sectional survey. Bmc Public Health. 2008;8(1):208. doi: 10.1186/1471-2458-8-208. [DOI] [PMC free article] [PubMed] [Google Scholar]
- Litt MD, Reisine S, Tinanoff N. Multidimensional causal model of dental caries development in low-income preschool children. Public Health Rep. 1995;110:607–617. [PMC free article] [PubMed] [Google Scholar]
- Lundberg O. Childhood conditions, sense of coherence, social class and adult ill health: exploring their theoretical and empirical relations. Social Science & Medicine. 1997;44(6):821–831. doi: 10.1016/s0277-9536(96)00184-0. [DOI] [PubMed] [Google Scholar]
- McLoyd VC, Jayaratne TE, Ceballo R, Borquez J. Unemployment and work interruption among African American single mothers: Effects on parenting and adolescent socioemotional functioning. Child Development. 1994;65(2):562–589. [PubMed] [Google Scholar]
- Navajo Nation Department of Agriculture. 2007 Retrieved May 4, 2015, from http://www.agriculture.navajo-nsn.gov/
- Phipps KR, Ricks TL, Manz MC, Blahut P. Prevalence and severity of dental caries among American Indian and Alaska Native preschool children. Journal of public health dentistry. 2012;72(3):208–215. doi: 10.1111/j.1752-7325.2012.00331.x. [DOI] [PubMed] [Google Scholar]
- Qiu RM, Wong MC, Lo EC, Lin HC. Relationship between children’s oral health-related behaviors and their caregiver’s sense of coherence. Bmc Public Health. 2013;13(1):239. doi: 10.1186/1471-2458-13-239. [DOI] [PMC free article] [PubMed] [Google Scholar]
- Quissell DO, Bryant LL, Braun PA, Cudeii D, Johs N, Smith VL, Albino J. Preventing caries in preschoolers: Successful initiation of an innovative community-based clinical trial in Navajo Nation Head Start. Contemporary clinical trials, 37(2) 2014:242–251. doi: 10.1016/j.cct.2014.01.004. [DOI] [PMC free article] [PubMed] [Google Scholar]
- Reisine S, Douglass JM. Psychosocial and behavioral issues in early childhood caries. Community Dent Oral Epidemiol. 1998;26:32–44. doi: 10.1111/j.1600-0528.1998.tb02092.x. [DOI] [PubMed] [Google Scholar]
- Sandell R, Blomberg J, Lazar A. The factor structure of Antonovsky’s sense of coherence scale in Swedish clinical and nonclinical samples. Personality and Individual Differences. 1998;24(5):701–711. Retrived from http://dx.doi.org/10.1016/S0191-8869(97)00225-0. [Google Scholar]
- Seow KW. Environmental, maternal, and child factors which contribute to early childhood caries: a unifying conceptual model. Int J Paediatr Dent. 2012;22:157–68. doi: 10.1111/j.1365-263X.2011.01186.x. [DOI] [PubMed] [Google Scholar]
- TM C. Unpublished doctoral dissertation. The State University of New York at Buffalo; Buffalo: 1980. The development and validation of the Multidimensional Dental Locus of Control Scales. [Google Scholar]
- Wolff AC, Ratner PA. Stress, social support, and sense of coherence. Western Journal of Nursing Research. 1999;21(2):182–197. doi: 10.1177/01939459922043820. [DOI] [PubMed] [Google Scholar]
- Wilson A, Brega A, Campagna E, Henderson WG, Bryant LL, Albino J. Validation of a Caregiver Oral Health Knowledge and Behavior Scale. Manuscript submitted for publication to Journal of Dental Research 2014 [Google Scholar]