Abstract
Purpose
To demonstrate that the temporal SNR of GRAPPA accelerated EPI can be enhanced and made more spatially uniform by using a FLASH based calibration scan.
Methods
EPI of a phantom and human brains were acquired at 3T without and with GRAPPA acceleration factor of 2. The GRAPPA accelerated data were reconstructed using calibration scans acquired with EPI and FLASH acquisition schemes. The increase in temporal signal fluctuation due to GRAPPA reconstruction was quantified and compared. Simulated g-factor maps were also created for different calibration scans.
Results
GRAPPA accelerated phantom data exhibited areas with high g values when using the EPI based calibration for reconstruction. The g-factor maps were uniform when using the FLASH calibration scan. g was greater than 1.1 in 74% of pixels in 64 × 64 data reconstructed with the EPI calibration compared to only 15% when using the FLASH calibration scan. Human data also showed abnormally high g regions when using the EPI calibration but not when using the FLASH calibration scan. Use of the FLASH calibration scan increased the whole brain temporal SNR by ~12 % without affecting the image quality. Experimental observations were confirmed by simulations.
Conclusion
A calibration scan based on a FLASH acquisition scheme can be used to improve the temporal SNR of GRAPPA accelerated EPI time series.
Keywords: GRAPPA, temporal SNR, EPI, FLASH, calibration scan
INTRODUCTION
The development of multi-channel receivers and coil arrays in the last decade has enabled considerable improvements in MRI scanning methodology. The main advantage of using receiver coil arrays is the greatly increased image signal-to-noise ratio (SNR) due to the placement of smaller coil elements close to the anatomy of interest. Simultaneous acquisition of data from multiple coils also allows faster image acquisition by reduced sampling of the raw data (k) space (1–3). In general, under sampling of k-space produces aliased images from each coil. However, with appropriate calibration or coil sensitivity maps, data from different coil elements can be combined to generate an image without aliasing artifacts. Therefore, receiver coil arrays and accelerated imaging techniques are routinely employed in clinical and research protocols to obtain higher resolution images in shorter scan times. When using echo-planar imaging (EPI), the echo train length and the effective echo spacing can be reduced by acquiring only a fraction of k-space lines. Therefore, use of accelerated imaging methods in EPI helps to increase the number of slices for a given repetition time (TR) and to reduce image distortions due to magnetic field inhomogeneity.
Current fMRI protocols based on single shot EPI generally incorporate accelerated imaging techniques such as sensitivity encoding (SENSE) (2) and generalized autocalibrating partially parallel acquisitions (GRAPPA) (3). In SENSE, the aliased images from each coil are combined to form an unaliased image using information about the reception sensitivity profiles of the coils. Typically, the coil sensitivity profiles are determined separately using low resolution gradient-echo scans acquired with the body coil and with the receiver array. In GRAPPA, the missing data points in the sub-sampled k-space data are calculated from the acquired samples from all coils using a predetermined interpolation kernel. The weights of the kernel are determined using a separate calibration scan consisting of a low-resolution, fully sampled k-space data set.
The main drawback of accelerated imaging methods is the reduction in SNR. Because a reduced number of k-space lines are acquired, the SNR of the accelerated image is reduced by compared to the non-accelerated case, where R is the image acceleration rate (or k-space under sampling factor). In addition, the accelerated images suffer from spatially dependent noise enhancement (g-factor) determined primarily by the geometry of the receiver array and the undersampling pattern (2,4,5). When acquiring fMRI data with accelerated imaging methods, the g-factor noise penalty also presents as a spatially dependent loss in temporal SNR (tSNR). The g-factor increases rapidly with R, and it is important to ensure that the g-factor throughout the imaging field-of-view (FOV) is close to 1 to minimize the loss in spatial and temporal SNR.
When evaluating GRAPPA accelerated EPI data for fMRI, we observed that the tSNR of GRAPPA EPI data can be highly inhomogeneous and significantly reduced in some areas of the images. This effect can also be seen in data shown in a recent publication (6). Typically, in GRAPPA accelerated EPI, a low-resolution (along phase-encoding), full k-space calibration scan is acquired at the beginning of data collection using the same EPI acquisition scheme. It is known that the GRAPPA kernel calculated using the calibration scan data determines the g-factor and hence the tSNR (4). Therefore, we hypothesized that the reduction in tSNR is due to uncorrected phase errors in the EPI calibration scan that propagate into the GRAPPA kernel calculation. In this work, we show that the tSNR of GRAPPA accelerated EPI can be increased and made more spatially uniform by using a calibration scan based on a fast low angle shot (FLASH) acquisition scheme rather than an EPI acquisition scheme (7). Previous work using a FLASH calibration scan in abdominal EPI has demonstrated image artifacts due to mismatch of distortions (8). However, here, the improvement that can be obtained with a FLASH calibration scan in brain imaging is illustrated with GRAPPA EPI data acquired using a quality assurance phantom and humans. In addition, simulation studies are included to demonstrate that the improvement in tSNR when using a FLASH calibration scan is due to elimination of phase errors in the calibration data.
METHODS
All studies were conducted under IRB approved protocols using a 3T MRI scanner (Skyra, Siemens Healthcare, Erlangen, Germany). Images of a quality control phantom (Siemens Spherical Phantom D165: 1.25 g NiSO4/1000 g H2O) and human brains of healthy volunteers (n = 6) were acquired using the 20-channel brain receiver array in the axial plane. A modified 2D gradient echo, single-shot, EPI sequence was used with TR = 2 s, TE = 30 ms, flip angle = 70 degrees, field-of-view = 22 cm, matrix = 64 × 64, slice thickness = 3 mm, bandwidth = 2300 Hz/pixel, echo spacing = 0.5 ms, phase-encoding along anterior-posterior direction, 10 (phantom) or 30 slices (human) and 100 measurements. In addition, 96 × 96 (TE = 34 ms, bandwidth = 1860 Hz/pixel and echo spacing = 0.6 ms) and 128 × 128 (TE = 55 ms, bandwidth = 1502 Hz/pixel and echo spacing = 0.74 ms) matrix image series were also acquired on the phantom. Different image series were acquired without (R1) and with GRAPPA acceleration rate of 2 (R2). For GRAPPA accelerated scans, two sets of calibration data using EPI and FLASH acquisition schemes were collected at the beginning of each series. The number of calibration lines collected was based on the matrix size, with 24, 48, or 64 lines collected for 64, 96 and 128 matrix, respectively. The EPI calibration scan was collected in a single-shot using the same frequency readout waveform as used for acquisition of R2 image data, i.e. with half the number of echoes used for R1. For the calibration scan, the phase encoding gradient was set to acquire only the center 24, 48 or 64 ky lines. For R2 image data, only every other ky line was acquired. The FLASH calibration data were acquired using TR = 3.8 ms, TE = 1.68 ms, flip angle = 5 degrees and bandwidth = 1000 Hz/pixel. For human data (30 slices), the acquisition time for the FLASH calibration scan was 2.3, 4.7 and 6.3 s for 24, 48 and 64 lines, respectively. In comparison, the single-shot EPI calibration data were acquired within one TR (2 s).
Human data were collected when subjects were resting in the magnet without performing a task. The cardiac pulse waveforms of the subjects during the EPI scans were recorded from the index finger using a photoplethysmograph sensor (TSD 200, PPG100 and MP150 Biopac Systems Inc, Goleta, CA). The respiratory waveforms were recorded using a bellows assembly (E8811ED, GE Healthcare, Milwaukee, WI) placed around the thorax and connected to a pressure transducer (TSD 160B, MP150 Biopac Systems Inc, Goleta, CA) .
All images were reconstructed on the scanner using software routines provided by the manufacturer. However, the image reconstruction pipeline was modified to enable GRAPPA accelerated EPI raw data to be reconstructed separately either using the EPI or the FLASH calibration data. The reconstructed images were transferred offline for further analysis using AFNI (9) and software routines written in IDL (Exelis VIS, Boulder, CO).
In order to examine the quality of the calibration data themselves, the image reconstruction pipeline was also modified to save the calibration scan data used as the input to the software module that calculates the GRAPPA kernel. The EPI calibration data were saved after the odd-even line EPI phase correction. The FLASH calibration data were not subjected to such phase correction. The saved calibration data were windowed along the phase-encoding direction using a Hanning function to prevent ringing artifacts due to data truncation and zero padded before Fourier transformation. The SNR of the calibration scan images was determined in root-sum-of-squares combined magnitude images (10). In addition, to quantify the odd-even phase errors in EPI, an EPI calibration data set (64 × 24) was acquired with the phase encoding gradient turned off. The non-phase encoded calibration scan data after readout Fourier transform were saved before and after odd-even EPI phase correction. The odd-even line phase error was quantified as the phase difference between the even center line (#12) and the averaged (complex) adjacent odd lines (#11 and 13). The constant offset and linear gradient of the phase difference were determined by fitting a straight line to the central 16 data points of the phase plots.
Human brain data were processed without and with physiological (cardiac and respiration) noise correction using RETROICOR (11). In addition, the human data were motion corrected and low order signal drifts removed from each pixel time series prior to computing the tSNR maps. For the phantom data, only the low order signal drifts were removed before further analysis.
The tSNR maps of the processed EPI series were calculated as the ratio of the mean temporal signal and the temporal standard deviation of the signal. Maps showing the GRAPPA g-factor noise penalty were calculated as the ratio of tSNR maps without and with GRAPPA acceleration, scaled by 1/, g = tSNR_R1/( * tSNR_R2) (4). In practice, g is close to 1 when the noise penalty due to GRAPPA reconstruction is small.
Computer simulations were carried out to determine the dependence of the g-factor on the SNR and phase errors in the GRAPPA calibration data. An eight element receiver coil array was simulated as a set of small surface coils (diameter 8.6 cm) equally spaced on a cylindrical surface (diameter 26 cm), and the complex B1 field of each coil was calculated using the Biot-Savart law. The calculated coil sensitivity profiles were used to generate an image (FOV = 25.6 cm, matrix = 64 × 64) of a circular phantom (diameter 17 cm) from each coil element. The simulated images from each coil were 2D Fourier transformed, replicated (100 repetitions) and combined with random noise to generate a k-space time series without acceleration. Accelerated (R=2 and 3) k-space time series were created by extracting every 2nd or 3rd row from the time series without acceleration. A GRAPPA calibration data set was created by taking the center 24 lines of the fully sampled k-space data of the simulated images. Calibration scans with and without phase shifts between the odd and even lines were created to simulate calibration data acquired with EPI and FLASH acquisition schemes, respectively. All coil elements received the same constant and frequency dependent linear phase shifts. The magnitudes of the phase shifts applied corresponded to experimentally determined values. In addition, phase-shifted calibration k-space data corresponding to multi-shot (2 shots for R2 and 3 shots for R3) EPI calibration acquisitions were also generated. All shots were assumed to contain the same odd-even phase errors, and the data were interleaved along the phase-encoding direction. Calibration scan data of different SNR levels were created by adding different levels of random noise to phase-shifted calibration k-space data. Each calibration data set was used in GRAPPA reconstruction of the accelerated k-space data using a software package available online (12) with a kernel size of 5 × 4. This software employs signal dependent Tikhonov regularization to calculate the GRAPPA coefficients (13). Further, the GRAPPA reconstructed images are calculated by multiplying the aliased accelerated images and the GRAPPA coefficients transformed to the image domain. The g-factor map corresponding to each simulated calibration data set was calculated as the ratio of the tSNRs of reconstructed images without and with acceleration scaled by 1/. All simulations were performed using MATLAB (The MathWorks, Inc, Natick, MA).
RESULTS
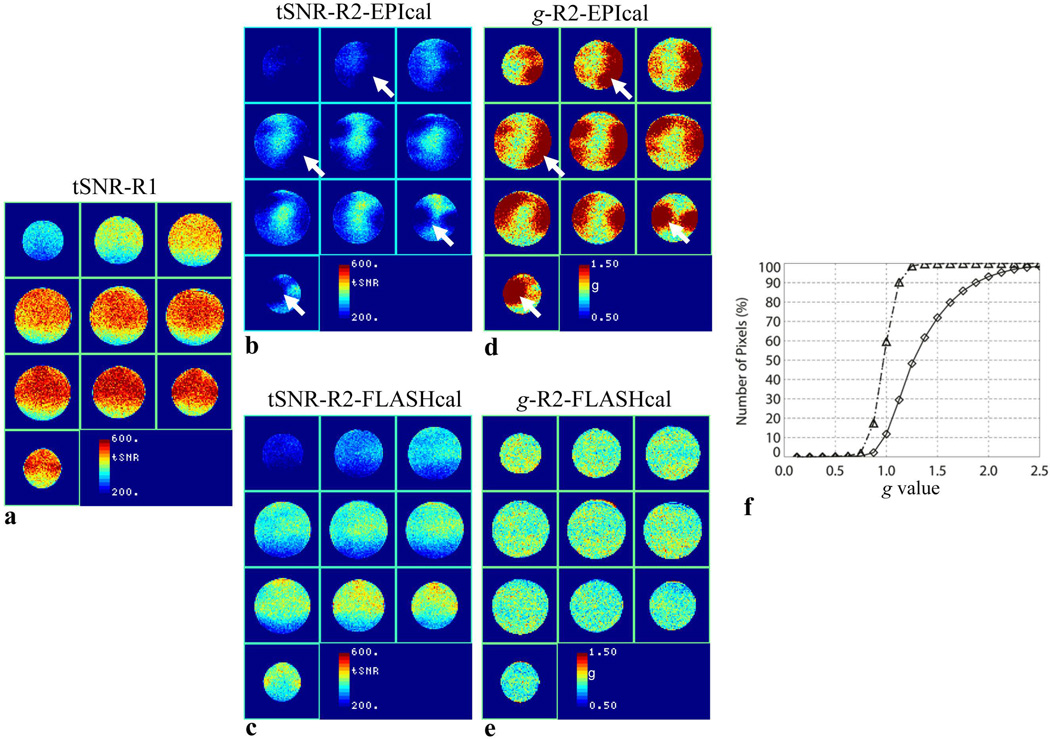
The temporal SNR and g-factor maps calculated from the phantom EPI data acquired at 3.4 mm in-plane resolution (64 × 64 matrix) are shown in Fig 1. As expected, the tSNR of data acquired without GRAPPA acceleration (Fig. 1a) is higher than that of data acquired with GRAPPA R2. (Figs. 1b and 1c). However, it can be seen that the GRAPPA R2 data reconstructed using the EPI calibration scan (Fig. 1b) exhibit large areas of very low tSNR. In contrast, when the same GRAPPA R2 raw data are reconstructed using the FLASH calibration scan, the tSNR maps obtained are fairly uniform without regions of reduced tSNR (Fig. 1c). The difference in the tSNR when using different calibration scans is better visualized through the calculated g-factor maps (Figs. 1d and 1e). The areas corresponding to low tSNR in data reconstructed with the EPI calibration scan (Fig 1b) exhibit high g values (Fig. 1d), while the g-factor maps of data reconstructed with FLASH calibration scan are relatively flat without high values (Fig. 1e). Figure 1f shows the histograms of the data shown in Figs. 1d and 1e. It can be seen that the histogram corresponding to the data reconstructed with EPI calibration scan is shifted to the right towards higher g values while the curve for data reconstructed using the FLASH calibration scan is symmetrical around g = 1. The median g value for EPI calibration reconstruction is 1.25, while that for FLASH calibration reconstruction is 0.97. g is greater than 1.1 and 1.5 in 74% and 28% of pixels, respectively, for EPI calibration reconstruction compared to only in 15% and 0.1% of pixels, respectively, when using the FLASH calibration scan (Fig. 1f). This means that, in addition to increased noise due to reduced sampling, the temporal noise standard deviation is increased by 10% or more in the majority of the pixels when GRAPPA R2 raw data are reconstructed using the EPI calibration scan. This additional noise penalty is greatly reduced when using a FLASH calibration scan.
Figure 1.
tSNR maps of 64 × 64 matrix EPI series obtained using the phantom, (a) without acceleration (R1), (b) with GRAPPA R2 using EPI calibration, and (c) with GRAPPA R2 using FLASH calibration. (d) and (e), g-factor maps corresponding to (b) and (c), respectively. (f), cumulative histograms of (d) (diamond) and (e) (triangle). The arrows point to selected areas of reduced tSNR and corresponding high g The phase-encoding direction is oriented in the vertical direction.
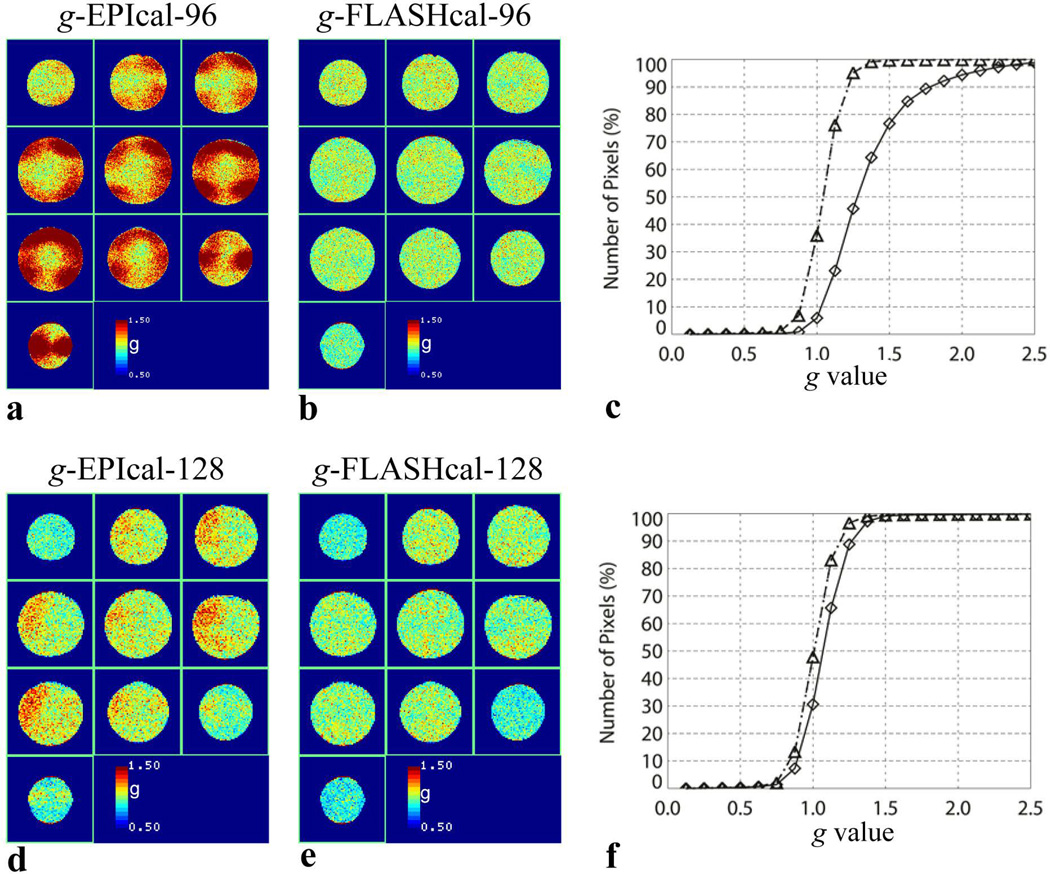
Figure 2 shows the g-factor maps and histograms obtained for higher resolution scans. At 2.7 mm in-plane resolution (96 × 96 matrix), high g values are observed for a majority of pixels when using the EPI calibration scan (Fig. 2a), while this effect is absent in the data reconstructed with the FLASH scan (Fig. 2b). The histograms of this data show that the median g value for EPI calibration reconstruction is 1.28, while that for FLASH calibration reconstruction is 1.05 (Fig. 2c). g is greater than 1.1 and 1.5 in 81% and 24% of pixels, respectively, for EPI calibration reconstruction compared to only in 33% and 0.3% of pixels, respectively, when using the FLASH calibration scan (Fig. 2c).
Figure 2.
(a) and (b), g-factor maps of 96 × 96 matrix EPI series with GRAPPA R2 using EPI calibration and FLASH calibration, respectively. (c) cumulative histograms of (a) (diamond) and (b) (triangle). (d) and (e), g-factor maps of 128 × 128 matrix images with GRAPPA R2 using EPI calibration and FLASH calibration, respectively. (f), cumulative histograms of (d) (diamond) and (e) (triangle).
The high g values are greatly reduced in the 1.7 mm in-plane resolution (128 × 128 matrix) data even when using the EPI calibration scan (Fig. 2d). Therefore, in this case, the improvement due to the FLASH calibration is less obvious (Figs. 2e, 2f). The median g values for EPI and FLASH calibration reconstructions are 1.07 and 1.01, respectively (Fig 2f). g is greater than 1.1 and 1.5 in 42% and 0.9% of pixels, respectively, for EPI calibration reconstruction and in 25% and 0.5% of pixels, respectively, when using the FLASH calibration scan (Fig. 2f).
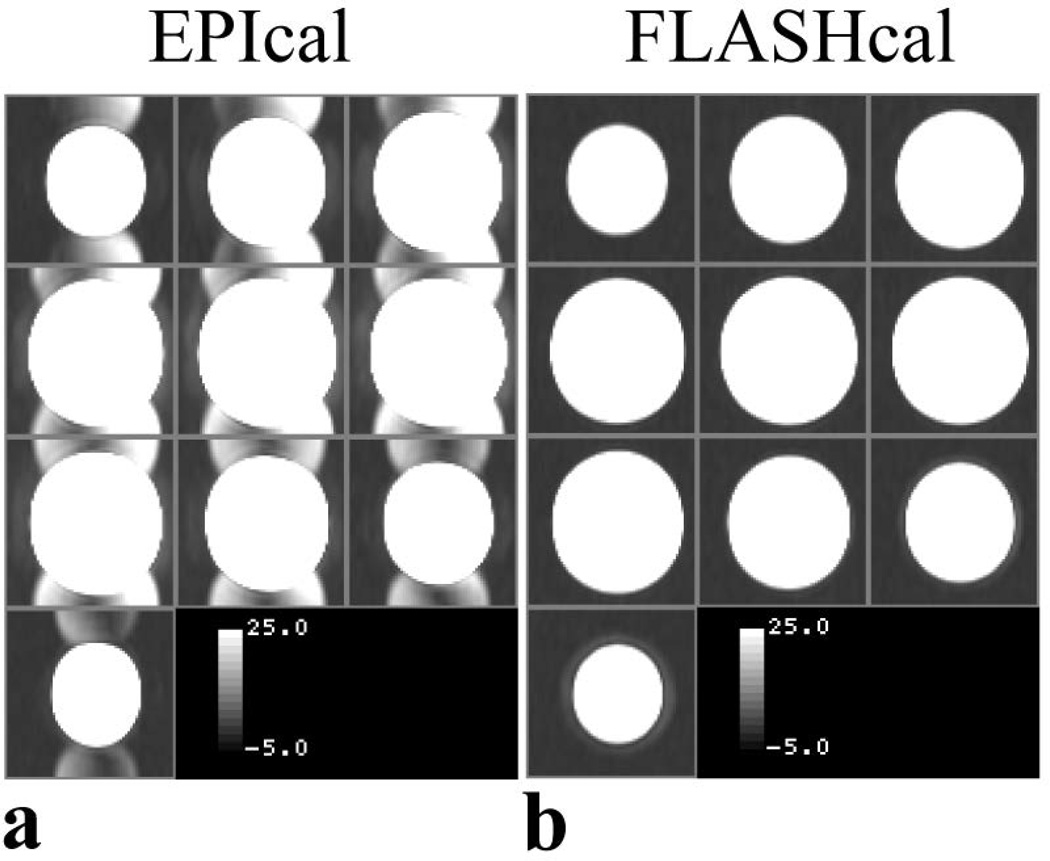
Figure 3 shows typical EPI and FLASH calibration data acquired for a 64 × 64 matrix GRAPPA R2 scan. The figure shows the 2D Fourier transforms of the 24 line calibration data acquired with the EPI (Fig 3a) and FLASH (Fig. 3b) acquisition schemes. The average SNR of the center slice of the FLASH calibration images was ~400, and that of the EPI calibration images was ~3 times higher. However, a half field-of-view shifted ghost (~3% of the main image) is observed in the EPI calibration images (Fig. 3a) while no ghost is present in the FLASH calibration images (Fig. 3b). The level of ghost in the EPI data is typical in human MRI scanners. The presence of a ghost indicates a residual phase mismatch between the odd-even raw data lines in the EPI calibration data used to calculate the GRAPPA coefficients. The SNR of the 96 and 128 matrix EPI calibration images were found to be 50 % and 35 % of the 64 matrix data, respectively.
Figure 3.
(a) and (b), images of EPI and FLASH calibration (24 lines) scan data, respectively. Images are displayed with the same window settings to show the difference in the ghost level in the two scans.
Quantitative data of phase mismatch between the odd-even lines in EPI calibration data acquired for a 64 matrix GRAPPA R2 scan are shown in Figure 4. Before EPI phase correction, a large, linear frequency dependent phase difference (~4 degrees/pixel) exists between odd-even lines (Fig. 4b). The phase gradient differs between channels by up to ~0.35 degrees/pixel. All slices exhibited similar behavior (data not shown). As expected, the phase difference is significantly reduced after phase correction (Fig. 4c). However, it is seen that a small residual constant and linear phase difference exists even after phase correction. The residual constant phase error after phase correction was found to be between −1.5 to −4.0 degrees depending on the slice (Fig. 4d), and the linear term was 0.05 degrees/pixel and similar for all slices. The residual errors after phase correction were similar for all coil channels. The constant and linear residual phase errors in the calibration data acquired for the 96 matrix R2 scan were found to be between −0.01 to 2.3 degrees and −0.3 degrees/pixel, respectively. The 128 matrix calibration data showed somewhat smaller constant and linear residual phase errors of −0.3 to 1.1 degrees and 0.06 degrees/pixel, respectively.
Figure 4.
Magnitude and phase data of the center echo of an EPI GRAPPA calibration data set (24 lines) acquired on a phantom using a 20 channel coil. (a), magnitude signal of line 12 from all coils. (b) and (c), phase difference between line 12 and the adjacent lines before and after EPI phase correction, respectively. (a) – (c) show data from a selected slice and different lines correspond to different channels. In these plots, the horizontal axis represents the readout direction after Fourier transformation. (d) and (e), constant and linear phase gradient between line 12 and the adjacent lines after phase correction (shown in (c)) for all slices (shown as different lines) and coils, respectively.
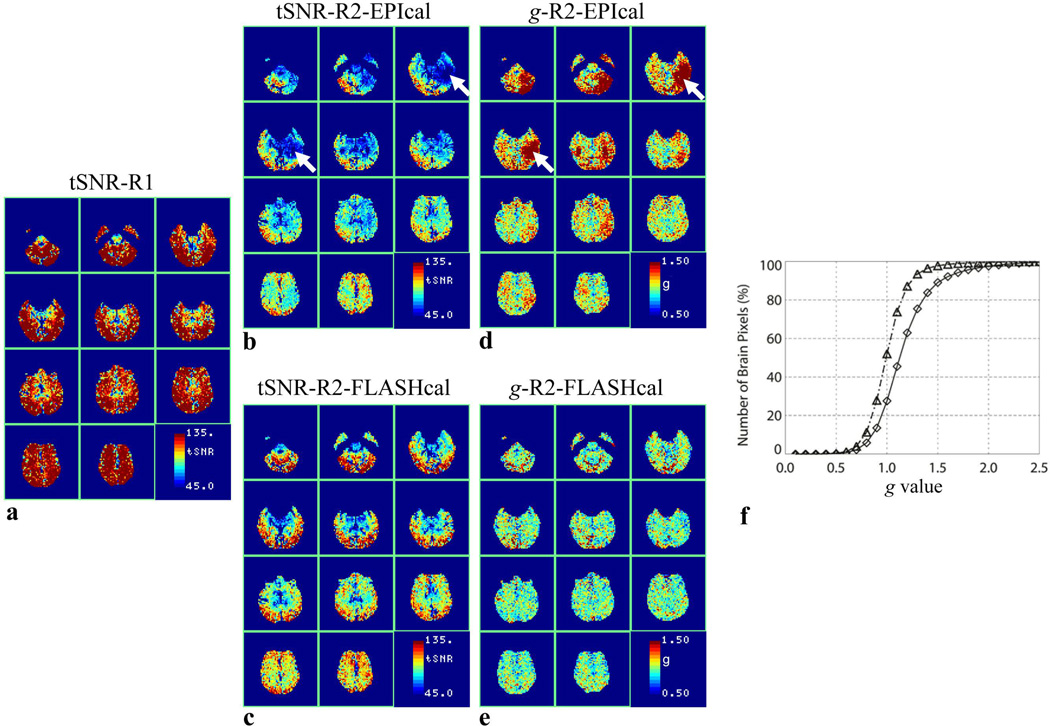
The temporal SNR and g-factor maps calculated from the 3.4 mm in-plane resolution (64 × 64 matrix) human data are shown in Fig. 5. Similar to phantom data, the tSNR maps of human data reconstructed using the EPI calibration scan also show large areas with unexpectedly low tSNR (Fig. 5b). The tSNR of these areas is restored to the expected range in images reconstructed using the FLASH calibration scan (Fig. 5c). The corresponding g-factor maps show large areas with high values when using the EPI calibration scan (Fig. 5d) but not in data reconstructed with the FLASH calibration scan (Fig. 5e). The median g value for EPI calibration reconstruction is 1.13, while that for FLASH calibration reconstruction is 0.99 (Fig. 5f). g is greater than 1.1 and 1.5 in 55% and 12% of pixels, respectively, for EPI calibration reconstruction compared to only in 27% and 2% of pixels, respectively, when using the FLASH calibration scan (Fig. 5f). In addition to uniform g-factor throughout the brain, data reconstructed with the FLASH calibration scan show a global reduction in the g values compared to those obtained using the EPI calibration scan.
Figure 5.
tSNR maps of axial EPI series obtained from a subject in the resting state (a) without GRAPPA acceleration (R1), (b) with GRAPPA R2 using EPI calibration, and (c) with GRAPPA R2 using FLASH calibration. (d) and (e), g-factor maps corresponding to (b) and (c), respectively. The arrows point to selected areas of reduced tSNR and corresponding high g. (f), cumulative histograms of (d) (diamond) and (e) (triangle). Images are shown in the radiological display convention and the phase-encoding direction is oriented along anterior to posterior.
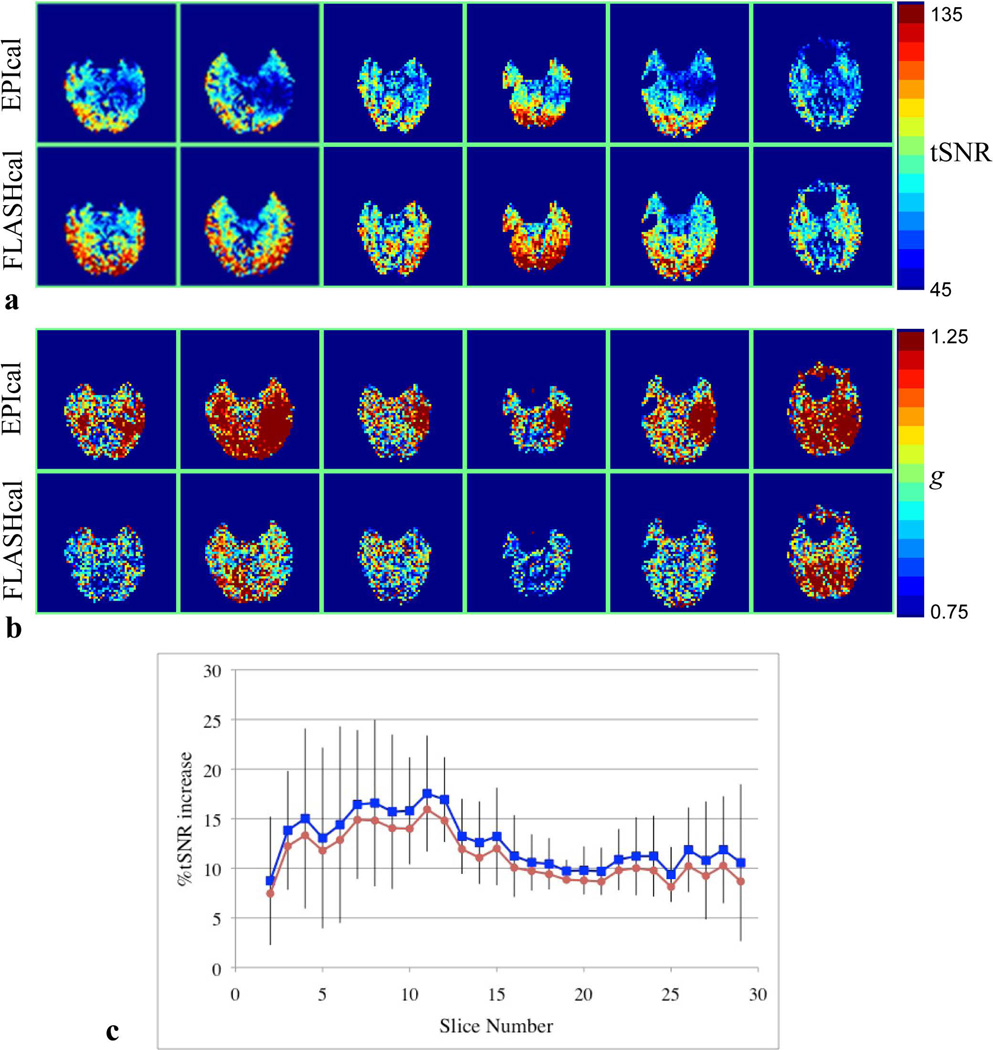
Figure 6 shows the temporal SNR and g-factor maps obtained from all the subjects. Reduced tSNR and high g areas could be identified in similar slice locations in all subjects when using the EPI calibration scan for GRAPPA reconstruction (Figs. 6a and 6b, top rows). The tSNR and g values in these areas are restored to the expected range when using the FLASH calibration scan (Figs. 6a and 6b, bottom rows). Figure 6c shows the average increase in tSNR for each slice when using the FLASH calibration scan for reconstruction over the EPI calibration scan. The gain in tSNR in the inferior slices is higher than the superior slices. The whole brain average tSNR increased by ~12 % when the FLASH based calibration scan was used for reconstruction. Figure 6c also shows that the average gain in tSNR is similar in data analyzed with and without physiological noise correction.
Figure 6.
(a), tSNR maps of a selected slice of the GRAPPA R2 EPI series from each one of the subjects studied (columns) using EPI (top row) and FLASH (bottom row) calibration scans. (b), g-factor maps corresponding to images shown in (a). (c), Slice-wise mean tSNR improvement of GRAPPA R2 EPI series when using the FLASH calibration scan compared to that obtained when using the EPI calibration scan. The plots in blue (squares) and red (circles) correspond to data analyzed with and without physiological noise correction, respectively. Error bars represent the standard deviations across subjects for physiological noise corrected data. The slice shown in (a) and (b) corresponds to either slice #9 or 10 in (c) in different subjects. In (c), slice #1 corresponds to the most inferior slice near the base of the brain.
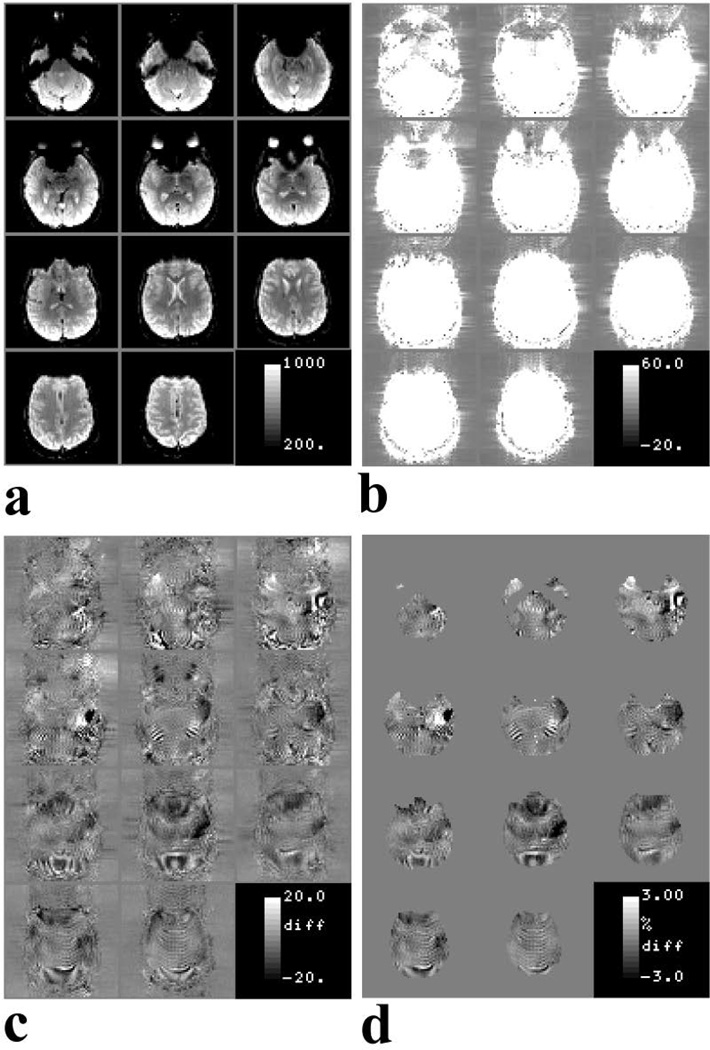
A comparison of the individual EPI quality obtained using the two calibration scans is shown in Fig. 7. The temporal mean images obtained when using the EPI calibration scan for GRAPPA R2 reconstruction shows typical EPI data quality with minimal artifacts and ghosts (Fig.7a and 7b). The difference of the temporal mean images obtained using EPI calibration and those obtained using FLASH calibration show ~ 3% residual signal inside and outside the brain (Fig.7c and 7d). This data indicates that use of the FLASH calibration scan does not significantly affect the quality of the individual images. Therefore, use of a FLASH calibration scan can improve the tSNR of the EPI series (see Figs 1–2 and 4–5) without any degradation of the image quality.
Figure 7.
(a), Temporal mean images of GRAPPA R2 EPI series obtained using EPI calibration. (b), images in (a) displayed to show the low level ghost outside the brain. (c) Difference of the mean images obtained using EPI and FLASH calibration scans. The display window has been adjusted to show the low level residual signal. (d), difference images of (c) shown as a percentage of the mean images obtained using the EPI calibration scan.
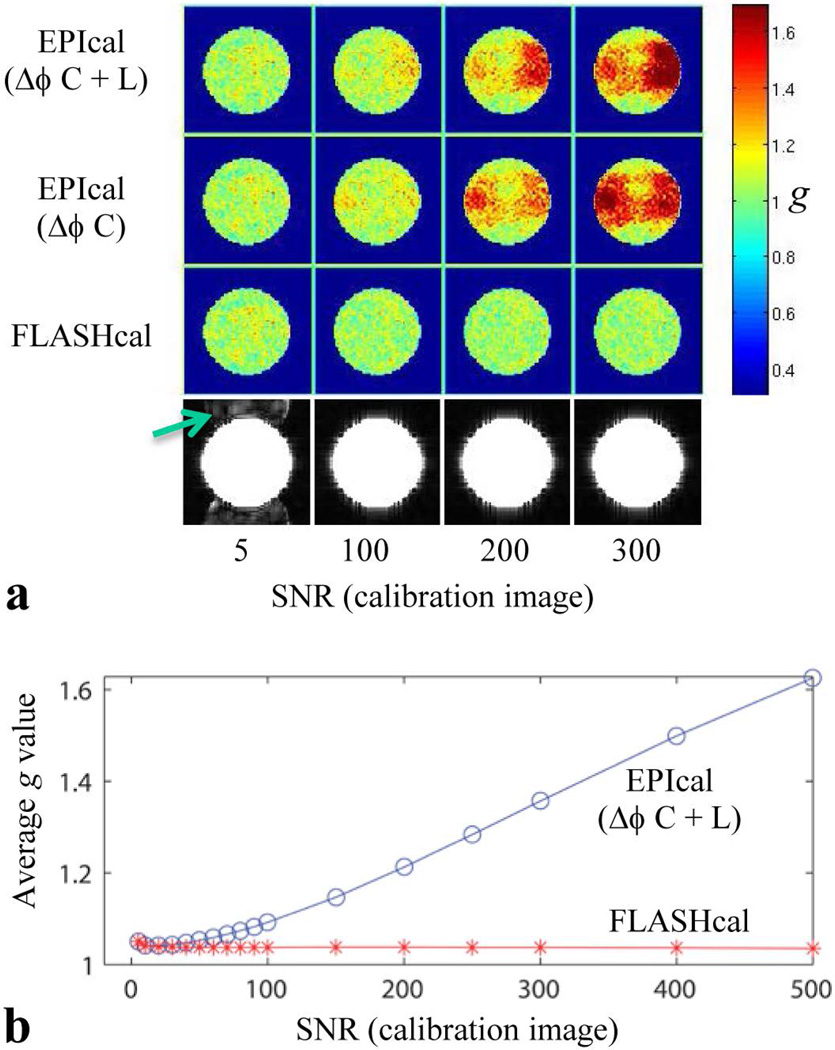
Figure 8 shows simulated g-factor maps for different phase errors and SNR of the GRAPPA calibration data. For this simulation, the constant and linear phase errors of 2.5 deg and 0.05 degrees/pixel, respectively, were applied to all the coil elements. These phase errors represent values determined experimentally (Fig. 4). As expected, when there is no phase error between the alternating lines in the calibration data (simulating a FLASH acquisition), the g-factor values are very low for all SNR values of the calibration data (Fig. 8a second row from the bottom). However, when using a calibration scan with phase error (simulating an EPI acquisition), areas of high g-factor values are obtained at higher SNR values (Fig. 8a two top rows, right columns). Figure 8b shows the simulated average g values when using EPI and FLASH calibration data over a wide range of calibration scan SNR. It can be seen that the FLASH g values remain constant and low throughout the whole SNR range while the EPI g values increase rapidly with SNR. The simulated data also indicate that the pattern of the high g-factor region depends on the combination of the phase error terms (constant or constant plus linear) present in the data. At very low SNR of the calibration scan, the GRAPPA reconstructed images exhibit ghost artifacts (Fig. 8, bottom row, arrow) while the g-factor values are unaffected by the phase error in the calibration scan (Fig. 8, left column). In both, simulated and experimental data, high g-factor areas are seen when using the EPI calibration data while such areas are absent when using the FLASH calibration data. Therefore, simulated data demonstrate that the improvement in g-factor maps of phantom data when using a FLASH calibration scan is due to elimination of phase errors.
Figure 8.
(a), Representative simulated GRAPPA mean images (bottom row) and g-factor maps (top 3 rows) for FLASH and EPI calibration data at different SNR of the calibration scan image. Different columns from left to right correspond to calibration scan SNR values of 5, 100, 200 and 300. Different rows of g-factor maps from top to bottom correspond to EPI calibration with constant plus linear phase error (Δϕ C+L), EPI calibration with constant phase error only (Δϕ C) and FLASH calibration with no phase error, respectively. A constant phase error of 2.5 degrees and a linear phase error of 0.05 degrees/pixel were applied to all the coil elements. For all images, the phase-encoding is along the vertical direction. (b), plot of average g value vs SNR (5 to 500) of the calibration scan for EPI (Δϕ C+L) and FLASH.
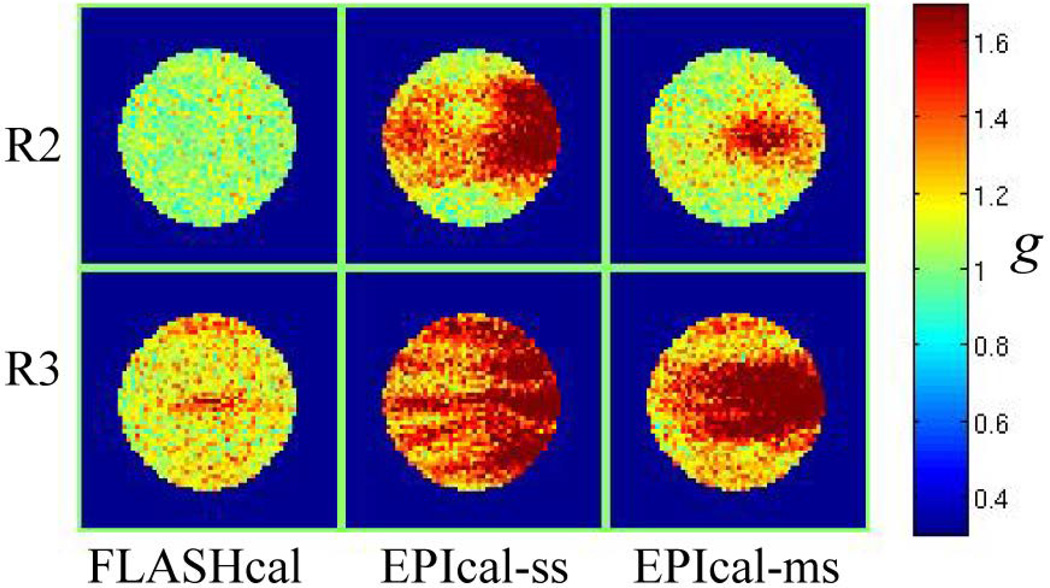
Figure 9 compares simulated GRAPPA g-factor maps when using FLASH (without phase error) and single/multi-shot EPI (with phase error) calibration data for acceleration factors 2 and 3. The data show that the FLASH calibration scans provide improved g-factors maps compared to EPI calibration scans in all cases. Additionally, the g-factor maps appear better when using multi-shot EPI calibration data compared to single-shot data. Since the two simulated calibration data sets differ only in how the phase errors appear along the phase-encoding direction, this observation is attributed to the lower rate (every 2nd or 3rd line) of phase discontinuities in the multi-shot data compared to every line in the single-shot data.
Figure 9.
Simulated GRAPPA g-factor maps for acceleration factor 2 (R2, top row) and 3 (R3, bottom row). Different columns correspond to maps obtained with different calibration scans (SNR = 300): FLASH (left column), single-shot EPI (middle column) and multi-shot EPI (right column). FLASH calibration data correspond to the case of zero phase error between odd-even lines, while EPI calibrations correspond to data with a constant 2.5 degree plus a linear 0.05 degrees/pixel phase error between odd-even lines. For all images, the phase-encoding is along the vertical direction.
DISCUSSION
In this study, we have demonstrated that the tSNR of GRAPPA accelerated EPI can be improved by using a FLASH based calibration scan for image reconstruction without adverse effects on image quality. Therefore, this approach should directly benefit fMRI studies. Use of an EPI based GRAPPA calibration scan produced EPI image series with significantly reduced tSNR in large areas. These areas also showed increased temporal noise due to GRAPPA reconstruction as quantified by g-factor maps calculated using the tSNR maps of image series acquired without and with acceleration. When GRAPPA calibration data were acquired using a FLASH based acquisition scheme, the tSNR and g-factor maps of reconstructed images were more uniform across the FOV without regions of abnormally low or high values, respectively. This effect was most prominent in low resolution (3.7 mm) phantom (Fig. 1) and human (Figs. 5 and 6) data. At 1.7 mm resolution, the additional increase in temporal noise when using the EPI calibration scan was small. However, use of a FLASH calibration scan reduced the temporal noise due to GRAPPA reconstruction at all three resolutions studied (Figs. 1 and 2).
The tSNR reduction observed when using the EPI calibration data is attributed to uncorrected phase errors. In this work, image reconstruction routines supplied by the manufacturer were used. The EPI calibration data were subjected to standard odd/even echo phase correction before using the data for calculation of the GRAPPA kernel. However, results show that a residual phase error between odd/even lines remained in the EPI calibration data (Fig. 3a and Fig. 4). On the other hand, FLASH calibration data were not subjected to phase correction and no phase errors are present in the data used for GRAPPA kernel calculation (Fig 3b). Since phase errors in the calibration data will cause errors in the calculated GRAPPA kernel, the FLASH calibration scan is expected to provide a more accurate kernel and an improved g-factor map.
In phantom data, EPI calibration scans produced improved g-factor maps at higher resolution (Figs. 2d) compared to lower resolutions (Fig.1d and 2a). The calibration data at higher matrix size contained lower residual phase errors and lower SNR compared to low resolution data. The improved g-factor maps observed at higher matrix size is attributed to these factors. Further, the increased number of data points in the calibration data at higher matrix size may also have contributed to the improved g-factor.
The spatial location of the regions with increased temporal noise when using the EPI calibration scan was different in phantom and human data. Phantom data showed high g-factor regions that varied across the slices. In human data, the most prominent decreases in tSNR were observed in the left hemisphere in slices though the basal ganglia. Since human and phantom EPI data generally show different ghost levels and patterns, it is likely that EPI calibration data in phantoms and human contained different residual phase errors and, therefore, different g-factor maps.
In this work, the g-factor maps were calculated by dividing two experimentally determined tSNR maps. Since the tSNR maps were not noise free, the ratio of these maps contained noise leading to experimental g values distributed around 1 (Figs. 1, 2, and 5). Additionally, in human data, the presence of physiological noise causes the loss in SNR in accelerated images to be less than (14). Therefore, in the presence of significant physiological noise, the experimental g values of human data calculated assuming loss can lead to values less than 1 as seen in some cases of human data (Fig. 6b).
The hypothesis that residual phase errors in the EPI calibration scan are the source of increased temporal noise was confirmed by the simulation studies (Figs. 8 and 9). Simulation data showed that the g-factor maps are strongly influenced by the residual phase errors in the calibration scan and the SNR. The effect of a given phase error on the g-factor maps was found to be more pronounced at higher SNR levels. Therefore, these effects are expected to be more important in GRAPPA EPI scans acquired at lower resolutions and/or at higher field strengths. Simulations also showed that the exact pattern of the g-factor map depends on the residual phase error terms (constant or linear) present in the calibration data. These observations explain the experimental results showing g-factor variation based on the image matrix size, slice location and the object imaged.
It is known that accurate determination of the GRAPPA kernel is crucial to minimizing additional noise and artifacts due to the reconstruction in accelerated scans. Much of the work on understanding noise amplification and artifacts in GRAPPA has focused on calibration data that was acquired with internal calibration lines (3,15). For example, in the recent work of Bauer et al. (15), the authors investigated the noise and artifact properties of the reconstructed images as a function of the number of reference lines and the size of the GRAPPA kernel. A large kernel resulted in residual aliasing artifacts, whereas a small kernel resulted in noise amplification. Similarly, image quality increased with increasing number of reference lines, but only up to a certain point. In this work we have shown that phase errors in the calibration scan can have significant impact on the noise amplification.
Data showing reduced tSNR with GRAPPA accelerated EPI was initially included in a paper by Cheng (6). That study concentrated on the variation of GRAPPA reconstruction noise across multiple time series and found that noise across multiple runs could be stabilized by using the EPI calibration data acquired at the beginning of the first run to reconstruct all runs. Recently, Polimeni et al. studied the tSNR characteristics of GRAPPA accelerated EPI when employing segmented EPI calibration scans (16). That study showed that the use of conventional consecutive-slice segmented calibration scans leads to discontinuous tSNR along the slice direction due to respiration induced phase discontinuities between the EPI segments. Further, the same study showed that the use of a consecutive-segment fast low flip angle EPI (FLEET) or a FLASH calibration scan can be used to eliminate the tSNR discontinuities. In addition, the results of that study indicate that FLEET and FLASH calibration scans produce similar tSNR on phantoms (16). These results agree with the simulated data presented here, where it is shown that at low SNR values of the calibration data, the g values obtained when using an EPI calibration scan with phase errors can be similar to those obtained when using a FLASH calibration scan (Fig. 8b). However, the current study was conducted using single-shot EPI calibration scans, and the adverse effects of tSNR were observed on phantoms as well as humans. Therefore, increased noise demonstrated here cannot be explained by motion or respiration induced dynamic field changes.
Other approaches can be employed to reduce phase-errors in the calibration data and improve the g-factor maps. The residual phase errors arise most likely due to the differences in eddy currents in the 3-echo navigator signal, used to estimate the required phase correction, and the calibration scan EPI readout (17). Therefore, when using EPI based calibration scans, improved EPI phase-correction algorithms could also be used to minimize odd-even line phase errors and improve the g-factor maps. When employing a two-shot EPI calibration scans, it should also be possible to combine data acquired with inverted readout gradients to minimize residual phase errors.
This study shows the importance of the calibration scan acquisition scheme when using GRAPPA accelerated EPI. A GRAPPA calibration scan based on a FLASH acquisition scheme was found to improve the tSNR of EPI time series. Therefore, use of a FLASH calibration acquisition scheme can enhance the functional sensitivity of GRAPPA accelerated EPI fMRI scans in detecting active regions with small effect size.
ACKNOWLEDGEMENT
This research was supported by the intramural research programs of the National Institute of Neurological Disorders and Stroke, National Institute of Mental Health and National Institute on Deafness and Other Communication Disorders at NIH.
REFERENCES
- 1.Sodickson DK, Manning WJ. Simultaneous acquisition of spatial harmonics (SMASH): fast imaging with radiofrequency coil arrays. Magn Reson Med. 1997;38(4):591–603. doi: 10.1002/mrm.1910380414. [DOI] [PubMed] [Google Scholar]
- 2.Pruessmann KP, Weiger M, Scheidegger MB, Boesiger P. SENSE: sensitivity encoding for fast MRI. Magn Reson Med. 1999;42(5):952–962. [PubMed] [Google Scholar]
- 3.Griswold MA, Jakob PM, Heidemann RM, Nittka M, Jellus V, Wang J, Kiefer B, Haase A. Generalized autocalibrating partially parallel acquisitions (GRAPPA) Magn Reson Med. 2002;47(6):1202–1210. doi: 10.1002/mrm.10171. [DOI] [PubMed] [Google Scholar]
- 4.Breuer FA, Kannengiesser SA, Blaimer M, Seiberlich N, Jakob PM, Griswold MA. General formulation for quantitative G-factor calculation in GRAPPA reconstructions. Magn Reson Med. 2009;62(3):739–746. doi: 10.1002/mrm.22066. [DOI] [PubMed] [Google Scholar]
- 5.Robson PM, Grant AK, Madhuranthakam AJ, Lattanzi R, Sodickson DK, McKenzie CA. Comprehensive quantification of signal-to-noise ratio and g-factor for image-based and k-space-based parallel imaging reconstructions. Magn Reson Med. 2008;60(4):895–907. doi: 10.1002/mrm.21728. [DOI] [PMC free article] [PubMed] [Google Scholar]
- 6.Cheng H. Variation of noise in multi-run functional MRI using generalized autocalibrating partially parallel acquisition (GRAPPA) J Magn Reson Imag. 2012;35(2):462–470. doi: 10.1002/jmri.22891. [DOI] [PubMed] [Google Scholar]
- 7.Talagala SL, Sarlls JE, Inati SJ. Improved temporal SNR of accelerated EPI using a FLASH based GRAPPA reference scan. Proceedings of International Society of Magnetic Resonance in Medicine. 2013;21:2658. [Google Scholar]
- 8.Griswold MA, Breuer F, Blaimer M, Kannengiesser S, Heidemann RM, Mueller M, Nittka M, Jellus V, Kiefer B, Jakob PM. Autocalibrated coil sensitivity estimation for parallel imaging. NMR in biomedicine. 2006;19(3):316–324. doi: 10.1002/nbm.1048. [DOI] [PubMed] [Google Scholar]
- 9.Cox RW. AFNI: software for analysis and visualization of functional magnetic resonance neuroimages. Comp Biomed Res. 1996;29(3):162–173. doi: 10.1006/cbmr.1996.0014. [DOI] [PubMed] [Google Scholar]
- 10.Constantinides CD, Atalar E, McVeigh ER. Signal-to-noise measurements in magnitude images from NMR phased arrays. Magn Reson Med. 1997;38(5):852–857. doi: 10.1002/mrm.1910380524. [DOI] [PMC free article] [PubMed] [Google Scholar]
- 11.Glover GH, Li TQ, Ress D. Image-based method for retrospective correction of physiological motion effects in fMRI: RETROICOR. Magn Reson Med. 2000;44(1):162–167. doi: 10.1002/1522-2594(200007)44:1<162::aid-mrm23>3.0.co;2-e. [DOI] [PubMed] [Google Scholar]
- 12.Hansen MS, Beatty P. ISMRM 2014 Sunrise Course on Parallel Imaging, http://hansenms.github.io/sunrise. Volume. 2014 [Google Scholar]
- 13.Sodickson DK. Tailored SMASH image reconstructions for robust in vivo parallel MR imaging. Magn Reson Med. 2000;44(2):243–251. doi: 10.1002/1522-2594(200008)44:2<243::aid-mrm11>3.0.co;2-l. [DOI] [PubMed] [Google Scholar]
- 14.de Zwart JA, van Gelderen P, Kellman P, Duyn JH. Application of sensitivity-encoded echo-planar imaging for blood oxygen level-dependent functional brain imaging. Magn Reson Med. 2002;48(6):1011–1020. doi: 10.1002/mrm.10303. [DOI] [PubMed] [Google Scholar]
- 15.Bauer S, Markl M, Honal M, Jung BA. The effect of reconstruction and acquisition parameters for GRAPPA-based parallel imaging on the image quality. Magn Reson Med. 2011;66(2):402–409. doi: 10.1002/mrm.22803. [DOI] [PubMed] [Google Scholar]
- 16.Polimeni JR, Bhat H, Witzel T, Benner T, Feiweier T, Inati SJ, Renvall V, Heberlein K, Wald LL. Reducing sensitivity losses due to respiration and motion in accelerated echo planar imaging by reordering the autocalibration data acquisition. Magn Reson Med. 2015 doi: 10.1002/mrm.25628. 10.1002/mrm.25628. [DOI] [PMC free article] [PubMed] [Google Scholar]
- 17.Poser BA, Barth M, Goa PE, Deng W, Stenger VA. Single-shot echo-planar imaging with Nyquist ghost compensation: interleaved dual echo with acceleration (IDEA) echo-planar imaging (EPI) Magn Reson Med. 2013;69(1):37–47. doi: 10.1002/mrm.24222. [DOI] [PMC free article] [PubMed] [Google Scholar]


