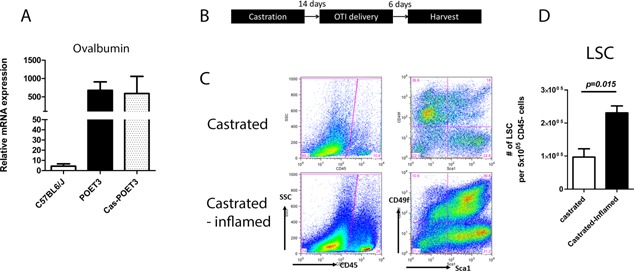
Figure 3.

Inflammation driven prostate progenitor expansion is testicular‐androgen independent. A: Relative mRNA expression of OVA in intact and castrated POET‐3 mice. Values of relative mRNA expression were means ± SE for n = 3 per group. B: Scheme summarizing experimental time frame of inflammation on castrated mice. C: FACS plot of infiltrated CD45+ cells (left panel) and LSC population (right panel) in castrated mice, with and without induction of inflammation. D: Bar graphs of LSC in androgen depleted non‐inflamed and inflamed prostates (Student's t test was determined by n = 3 animals each group; error bar = SE).
