Abstract
There are now hundreds of thousands of pathogenicity assertions that relate genetic variation to disease, but most of this clinically utilized variation has no accepted quantitative disease risk estimate. Recent disease-specific studies have used control sequence data to reclassify large amounts of prior pathogenic variation, but there is a critical need to scale up both the pace and feasibility of such pathogenicity reassessments across human disease. In this manuscript we develop a shareable computational framework to quantify pathogenicity assertions. We release a reproducible “digital notebook” that integrates executable code, text annotations, and mathematical expressions in a freely accessible statistical environment. We extend previous disease-specific pathogenicity assessments to over 6,000 diseases and 160,000 assertions in the ClinVar database. Investigators can use this platform to prioritize variants for reassessment and tailor genetic model parameters (such as prevalence and heterogeneity) to expose the uncertainty underlying pathogenicity-based risk assessments. Finally, we release a website that links users to pathogenic variation for a queried disease, supporting literature, and implied disease risk calculations subject to user-defined and disease-specific genetic risk models in order to facilitate variant reassessments.
Introduction
1.1. Clinical genomics in 2015
Just 15 years since the completion of the Human Genome Project, researchers today can sequence a whole genome for less than $1,000. Fundamental advancements in sequencing platforms [1] coupled with concerted data-sharing efforts [2] have led to widespread and diverse uses of genomic data. Decades before the advent of next-generation sequencing, clinicians and geneticists were using targeted gene testing in diagnosis and prognosis, for example in calculating the familial risk of cystic fibrosis [3]. More recently, whole-genome and whole-exome sequencing have led to the discovery of causal lesions for numerous hitherto unsolved Mendelian disorders [4]. Other common clinical uses of genomic data include familial risk stratification for diseases such as hypertrophic cardiomyopathy [5], drug targeting based on activating mutations for cancers such as non-small-cell lung carcinoma [6], and genetic counseling for disorders such as trisomy 21 using fetal DNA circulating in maternal plasma (non-invasive prenatal testing, NIPT) [7].
While these efforts have led to real gains in diagnosis and treatment, it is now a central challenge of clinical genomics to sort through an unwieldy literature of genetic associations: in aggregate, there are hundreds of thousands of genetic associations across the entire spectrum of human disease [8]. The usual scale for summarizing findings to the clinician and patient is based on “pathogenicity,” [9], or the capacity of a genomic variant to cause disease. Pathogenicity is a qualitative categorical concept, and its usual clinical scale consists of the values “Benign,” “Likely Benign,” “Variant of Uncertain Significance,” “Likely Pathogenic,” and “Pathogenic” [9].
1.2. Recent inconsistencies between pathogenicity assertions
Although pathogenicity assertions have been in use for decades clinically, only recently have systematic reinvestigations of pathogenicity been possible due to the widespread availability of large-scale sequencing data from the general population. The typical study design involves identifying all pathogenic variants for a given disease and then assessing the frequency of this variation in the general population. If the aggregate or individual variant frequency exceeds a disease-specific threshold, then pathogenicity for a variant or group of variants is challenged. This frequency threshold depends on the mode of inheritance (e.g. autosomal dominant), age-of-onset, prevalence in the tested population, molecular heterogeneity (fraction of disease due to a given variant), and desired penetrance cutoff (probability an individual with the variant expresses disease). For example, for an autosomal dominant disease caused by highly penetrant alleles, variant pathogenicity is called into question if the aggregate pathogenic genotype frequency exceeds the prevalence of the disease.
Several recent studies have used this approach to question the quality of pathogenicity ratings and reclassify pathogenicity assertions. Testing large-scale non-diseased populations has challenged prior pathogenicity assertions for X-linked intellectual disability [10], hypertrophic cardiomyopathy [11], non-syndromic hearing loss [12], and several other diseases. However, this is a small subset of the thousands of disorders with assertions regarding pathogenic genetic variation [8]. There is a critical need to scale up both the pace and feasibility of systematic reinvestigations of pathogenic variation using large-scale sequencing data from control populations.
1.3. The need for reproducible, shareable, and disease-specific quantitative investigations of pathogenic variation
It is now a central challenge in clinical genomics to reassess a scattered literature of disease-associated genetic variation as well as the large burden of novel variants discovered in whole genome or whole-exome sequencing. After achieving the “$1,000 genome,” we may face the “$100,000 analysis.” [13]. Several specific challenges hinder robust interpretation of potentially pathogenic genetic variation. First, pathogenicity assertions are typically not quantitative risk estimates. Second, it is usually unclear how a pathogenic variant should be interpreted in distinct clinical contexts with different prior probabilities (e.g., pathogenicity in males versus females or for patients with co-morbid conditions). Third, there is no accepted “false discovery rate” for the majority of clinically utilized pathogenic variation and, further, multiple recent re-investigations suggest that it is far greater than previously appreciated [10], [12], [14]. Fourth, and relatedly, assertions are based on a fragmented literature. It remains a challenge to assimilate findings from diverse studies with different analytic and design parameters [15]. Such re-investigations have generally concentrated on a single disease or closely related set of diseases at a time [10], [12], [14], and have required considerable bioinformatics resources to subset, clean, and work with pathogenic variation and sequence data. There is a need for a new digital platform to efficiently estimate, analyze, and share quantitative disease risk estimates for pathogenic variation.
In this manuscript we develop a shareable computational framework to quantify pathogenicity assertions that have been reported in the literature. We release a reproducible “digital notebook” which integrates executable code, text annotations, and mathematical expressions to enable investigators to study how variation in the general population and genetic model parameters dictate risk estimates underneath pathogenicity assertions. This notebook is written in the interactive computing environment IPython [16]. We extend previous disease-specific reinvestigations of pathogenicity to over 6,000 diseases and 160,000 assertions in ClinVar [17]. We document how reported pathogenicity assertions can mask large uncertainty over a wide range of risk estimates, a critical consideration for clinicians and patients using such data for treatment and diagnosis. We link pathogenicity assertions to their supporting literature and current ClinVar annotations. Investigators can use this platform to carry out rapid disease-specific quantitative analyses for pathogenic variants. Disease experts, such as genetic counselors, can tune population parameters (such as prevalence and heterogeneity) to expose the determinants of pathogenicity and prioritize pathogenicity assertions for reassessment. All code is made freely available.
2. Methods
2.1. Genetic models
Consider a population of n individuals. For simplicity, first consider a single bi-allelic site where the reference allele frequency is p and non-reference allele frequency is q = 1 − p. Under Hardy-Weinberg equilibrium, genotypes AA (homozygous reference), Aa (heterozygous), and aa (homozygous alternate) have frequencies p2, 2pq, and q2, respectively. Then the genotype frequency of q, the fraction of individuals who carry at least one q allele, denoted G(q), is given by
For a locus with k distinct alleles (by state) under Hardy-Weinberg equilibrium, this equation still holds,
We define the penetrance of a genotype as the conditional probability of expressing disease D for an individual possessing the genotype V, P(D|V) = (P(V|D)P(D))/P(V), where h ≡ P(D|V) is an indicator of the molecular heterogeneity of the disease, P(D) is the prevalence, and P(V) is the genotype frequency. Penetrance is a population-specific parameter—for a given variant, penetrance can vary substantially based on clinical context (e.g. general population vs. testing laboratory population). We consider autosomal dominant, autosomal recessive, additive, and multiplicative genetic risk models. Under these risk models, we can write genotype frequencies and relative risks given a non-reference allele frequency q and per allele risk γ for a bi-allelic locus as follows:
2.2. Clinical variant annotations
The ClinVar database [www.ncbi.nlm.nih.gov/clinvar] aggregates genotype-phenotype assertions across human disease [17]. ClinVar assertions are summarized on a qualitative pathogenicity scale: (Benign, Likely benign, Uncertain significance, Likely pathogenic, Pathogenic). The database further includes supporting evidence where available, such as in vitro and in silico studies of pathogenicity. The database collects submissions from investigators around the world and can be used to resolve conflicts [8]. If many investigators independently assert the same relationship, this information is used to bolster the evidence for a variant-disease relationship. In this manuscript, we use the clinvar_20150629 version of the ClinVar database retrieved from ANNOVAR [18].
2.3. Allele frequency data from the general population
We incorporated allele frequency data from the NHLBI Exome Sequence Project (ESP) [19] and the Broad Exome Aggregation Consortium (ExAc) [20]. These data include allele frequencies from 6,503 individuals (ESP) and 60,706 individuals (ExAc). Both databases contain frequency data separated by population groups (e.g. in ESP, allele frequency data is provided separately for the 2,203 African Americans and 4,300 European Americans that constitute ESP). ExAc has been filtered for known causes of severe pediatric diseases, as it is intended for use as a “general population” resource to filter variants [20].
2.4. Open source software stack
The analysis in this manuscript is performed entirely in the interactive computing environment IPython [16]. IPython combines text annotations, executable code, mathematical expressions (LaTeX), and embedded HTML in a single digital notebook. We also built a D3 visualization [21] to allow users to explore pathogenicity assertions in the browser along with supporting evidence and user-controlled genetic model parameters to compute penetrance. Genomic sequence data and ClinVar annotations were retrieved using both ANNOVAR [18] and the ClinVar website [17].
3. Results
3.1. A reproducible and shareable workflow for quantifying pathogenicity assertions
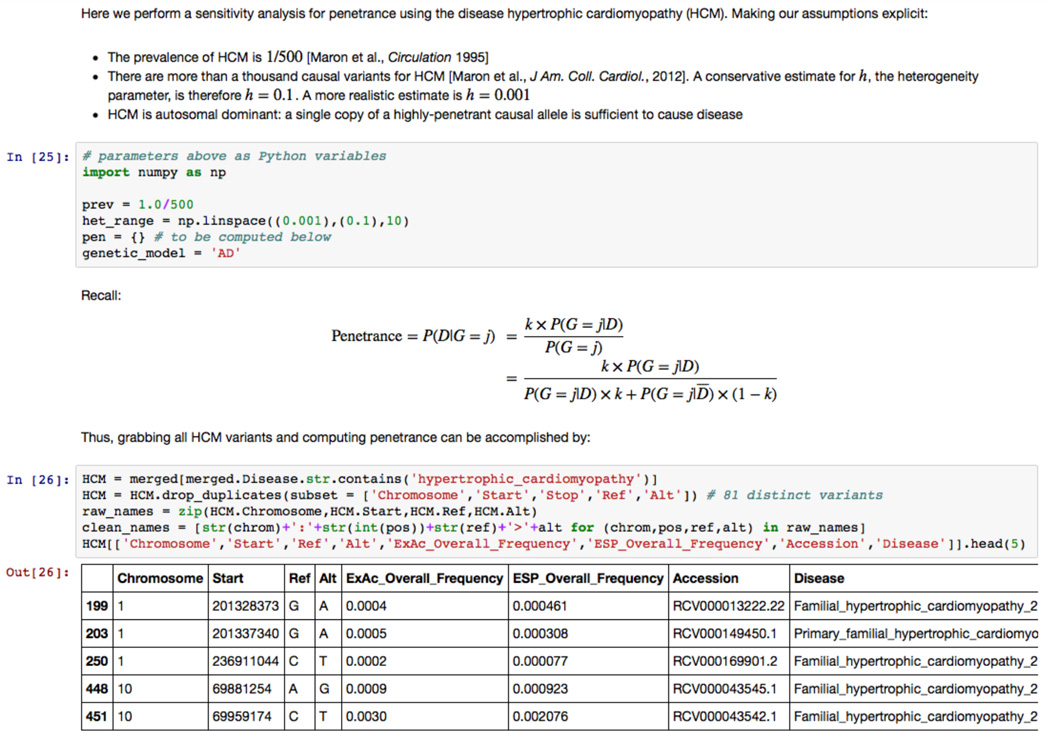
We developed a reproducible and shareable platform for clinical genomics annotations (Figure 1). We have released a digital notebook written in the interactive computing environment IPython [16] that integrates executable code, text annotations, mathematical expressions, and embedded HTML. Investigators can freely download this IPython notebook file, reproduce all data-gathering steps, choose any disease from ClinVar, and specify the prevalence, heterogeneity, and genetic model to estimate the penetrance of all ClinVar variants for the selected disease. All sensitivity analyses described in this manuscript can be reproduced and customized in the IPython notebook. Further, investigators can add cells of their own code and text to specify different disease-specific genetic risk models and assumptions required to compute penetrance. The analysis steps and final risk summary information, whether quantitative risks or qualitative assertions, can be stored alongside supporting data and assumptions in a single document. Customized disease-specific notebooks can be shared with collaborators to be run and customized locally.
Figure 1. A reproducible and shareable workflow for quantifying pathogenicity assertions.
Screenshot from the IPython “digital notebook” that accompanies this manuscript. The interactive computing notebook combines executable code (written in blocks), mathematical expressions, and text annotations. Code is provided to retrieve ClinVar annotations, PubMed references, and frequency data for any disease in ClinVar. The user can explicitly specify genetic model assumptions to compute penetrance and perform sensitivity analyses. Available at: https://github.com/manrai/Pathogenicity_Notebook.
3.2. A diseaseome-wide investigation of pathogenicity assertions
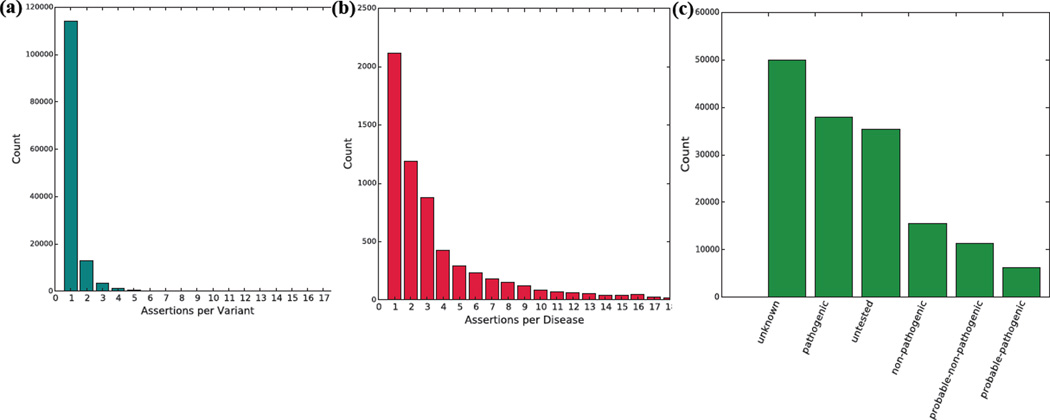
We used our computational framework to perform a diseaseome-wide analysis of pathogenicity assertions in ClinVar (Figure 2). Using the clinvar_20150629 version of ClinVar retrieved from ANNOVAR, we observed 132,584 distinct variants, as defined by unique values of (Chromosome, Start Position, Stop Position, Reference Allele, Alternate Allele) tuples in hg19 coordinates. These 132,584 variants gave rise to 160,487 distinct pathogenicity assertions about disease. As such, the majority of variants—114,107 out of 132,584 variants (86%)—were included in only a single pathogenicity assertion (Figure 2a). The 160,487 total assertions spanned 6,427 distinct disease names, although 42,761 assertions (27%) had disease names of “not specified” or “not provided.” Of the 117,726 remaining assertions, just five out of 6,425 diseases (Lung Cancer, Malignant Melanoma, Hereditary Cancer-Predisposing Syndrome, Familial Cancer of Breast, Lynch Syndrome) accounted for 59,829 assertions (51%). 1,524 out of 6,425 diseases (24%) had at least five assertions (Figure 2b). Of the 160,487 total assertions, 85,455 (53.2%) were either “unknown” or “untested”; 37,871 (23.6%) were “pathogenic”; 15,483 (9.6%) were “nonpathogenic”; 11,357 (7.1%) were “probable-non-pathogenic”; 6,189 (3.9%) were “probable-pathogenic”; 3,964 (2.5%) were “other”; and 168 (0.1%) were classified as “drug-response” (Figure 2c).
Figure 2. A diseaseome-wide investigation of pathogenicity assertions in ClinVar.
(a) Distribution of 160,487 pathogenicity assertions across 132,584 distinct variants. 86% of variants had exactly one assertion. (b) Truncated distribution of pathogenicity assertions by disease. (c) Clinical significance values for assertions in ClinVar. 85,455 (53.2%) of the 160,487 total assertions were either “untested” or “unknown.” “Pathogenic” assertions were the second largest overall group.
3.3. Uncertainty in the disease risk conveyed by pathogenic variation
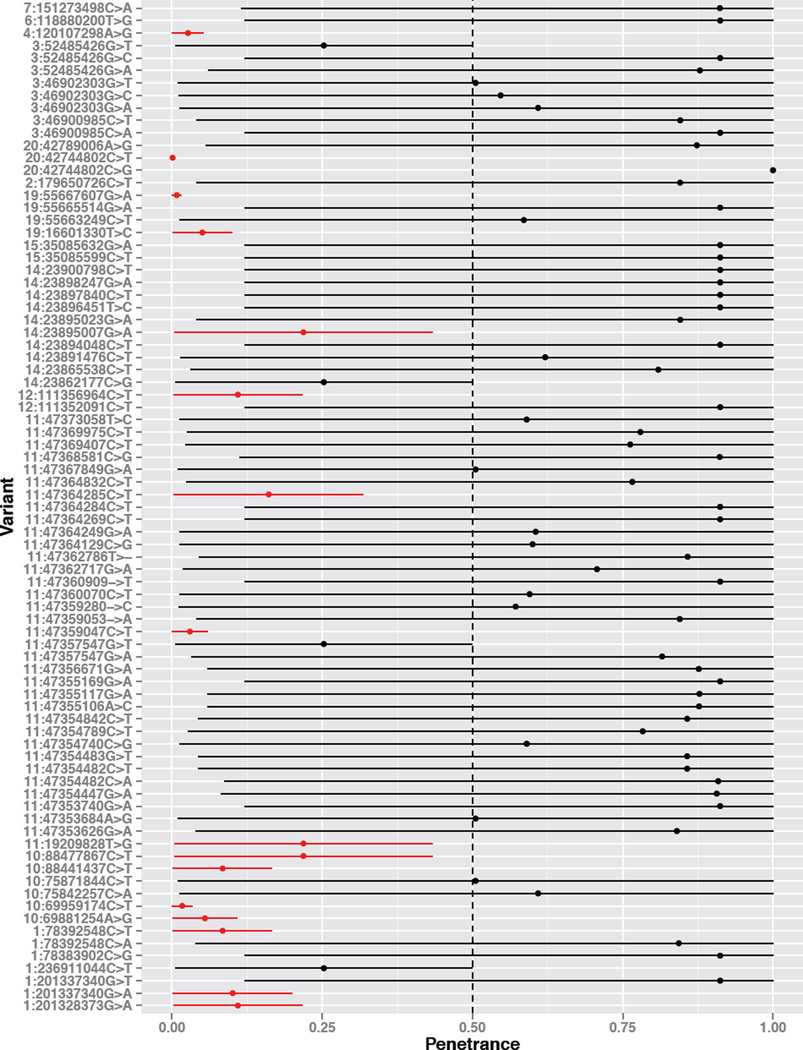
The penetrance of a pathogenic variant—the probability that individuals with the variant express disease—depends on the allele frequency in both case and control individuals, mode of inheritance, age-of-onset, heterogeneity, and prevalence of the disease. To study this dependence, we analyzed the disease hypertrophic cardiomyopathy (HCM), and documented how penetrance values across all pathogenic single nucleotide variants (SNVs) for HCM vary under clinically plausible parameter values (Figure 3). We retrieved 81 distinct pathogenic SNVs with frequency data available in ExAc or ESP for HCM. We used the widely-accepted prevalence of 1:500 individuals [22] and varied the molecular heterogeneity parameter from conservative values (h = 0.1, 10% of HCM is explained by a single variant) to a more accepted model (e.g. h = 0.001) given that greater than a thousand causal variants have been identified for HCM [5]. All variants display substantial variability based on the input genetic model parameters (Figure 3), however, several pathogenic variants have consistently low penetrance due to their elevated non-reference allele frequency.
Figure 3. Uncertainty in the disease risk conveyed by pathogenic variation.
Shown are the 81 pathogenic SNVs from ClinVar for hypertrophic cardiomyopathy with ExAc or ESP frequency data available. We computed a range of penetrance values for each variant by varying heterogeneity linearly in the range [0.001, 0.1]. Several variants have consistently low penetrance given their elevated non-reference allele frequency. Variants that were lower than the 50% penetrance cutoff throughout these simulations are colored in red.
3.4. Frequency of ClinVar variants in the general population
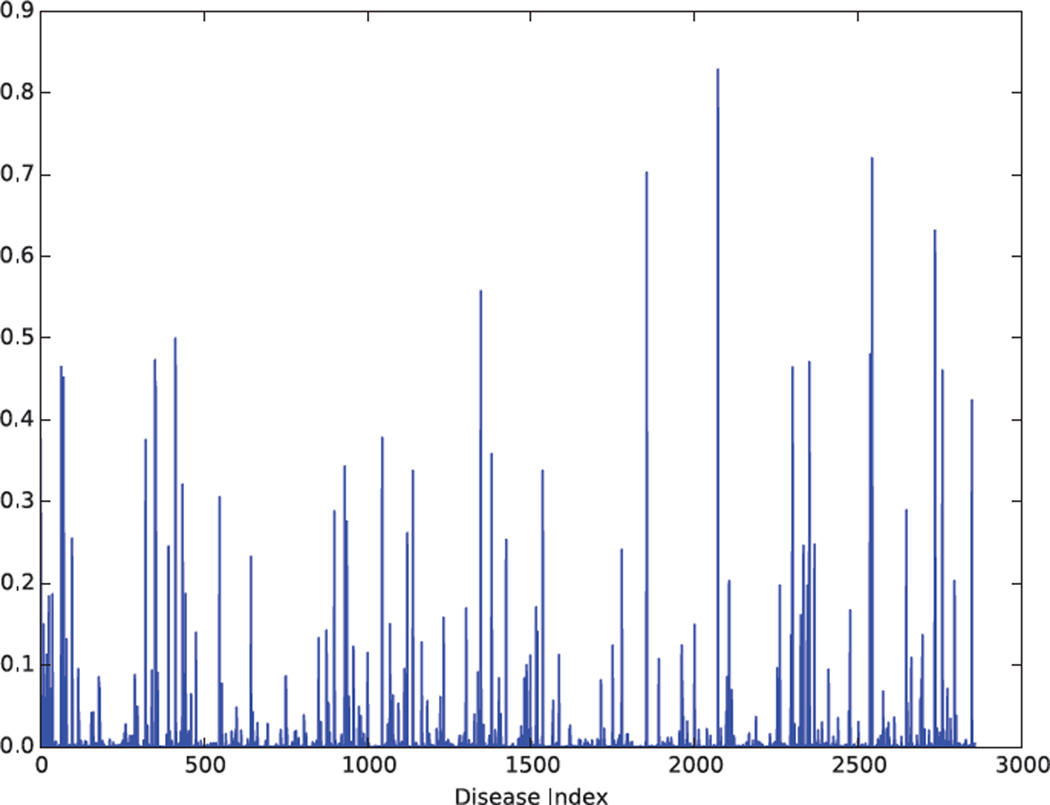
We studied the frequency of pathogenic variation in ClinVar by disease. Many diseases had pathogenic variants with summed minor allele frequencies that were incompatible with even moderately penetrant causal alleles (Figure 4). Considering only pathogenic SNV variation, 110 distinct disease terms in ClinVar had a summed minor allele frequency greater than 0.05 (Figure 4). The five highest frequency diseases were Neutrophil-Specific Antigens NA1/NA2, Severe Combined Immunodeficiency Autosomal Recessive T-Cell Negative B-Cell Positive NK-Cell Positive, Metachromatic Leukodystrophy, Trimethylaminuria, and Trimethylaminuria Mild.
Figure 4. Summed frequency of pathogenic SNVs by disease.
Many diseases have summed pathogenic SNV minor allele frequencies that far exceed the prevalence of the disease. 110 distinct disease terms have a summed minor allele frequency greater than 0.05.
3.5. User-directed investigations of pathogenicity
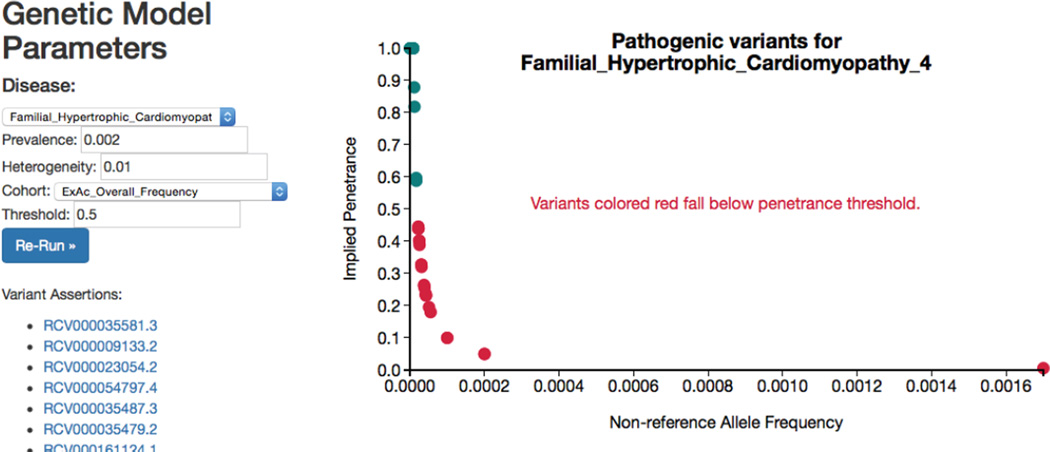
We built a website to enable investigators to conduct disease-specific analyses of pathogenic variation. After selecting a disease and specifying a genetic model, the investigator is provided with all ClinVar entries for variants with questionable pathogenicity as governed by the user-controlled parameters, as well as the supporting literature for these variants. Investigators can set genetic model parameters based on, for example, genetic testing laboratory experience from other patients with the same disease. Investigators are then provided with implied penetrance values for each variant under these assumptions as well as supporting literature references in order to efficiently prioritize pathogenic variants for reassessment.
4. Discussion
4.1. Summary of findings
We developed a reproducible and shareable computational framework to quantify pathogenicity assertions across disease. We used this platform to extend previous disease-specific reinvestigations of pathogenicity to over 6,000 diseases and 160,000 assertions in ClinVar. For investigators wishing to conduct disease-specific quantitative reassessments of pathogenic variation, we released a digital notebook written in the interactive computing environment IPython that integrates executable code, text, and mathematical expressions to specify explicit genetic model assumptions and quantify pathogenicity assertions. We documented the uncertainty in disease risk estimates for pathogenic variants using, as an example, all pathogenic SNV variation for the inherited condition hypertrophic cardiomyopathy. We released a website that allows users to quickly explore pathogenic variation for individual diseases, prioritize variants for reassessment, and obtain ClinVar records and supporting literature for variants that fall below an adjustable clinical threshold for penetrance.
4.2. Disease-specific reassessments of pathogenicity
Bottom-up approaches to reassessing pathogenicity allow investigators to specify genetic model assumptions and filter pathogenicity assertions tailored to the individual disease in which they have expertise. The clinical utility of genomic sequence data depends heavily on prior probabilities and genetic model parameters [23], and as such it is critical to incorporate these quantities into clinical decision-making. Expertise from clinical genetic testing laboratories in measuring genetic heterogeneity and other parameters will improve reassessments going forward. It will be increasingly important to quantify our understanding of the uncertainty of pathogenicity assertions, and share these data widely to collectively improve clinical decision-making.
4.3. The publishable unit
Digital notebooks such as IPython/Jupyter [16] offer several advantages as a method of documenting research progress. These notebooks combine executable code divided into understandable blocks with text markup, the precision of mathematical notation, figures, and embedded HTML in an easily shareable and coherent document that lets each user tailor code and analyses for their goals. Building off of IPython, the Jupyter project (https://jupyter.org) is language agnostic, enabling users to contribute to analysis workflows such as the Pathogenicity Notebook using other popular programming languages for data analysis. Using these tools, findings can be delivered alongside the underlying data and assumptions. For pathogenicity reassessments, a digital notebook could serve as a new publishable unit of analysis.
4.4. Future work
It is important to stress that frequencies retrieved from ExAc and ESP are estimates of population parameters. Future work could incorporate this uncertainty into disease-specific reassessments and study the generalizability of penetrance estimates across different ethnicities using these databases. It is also important to note that using frequency data from the general population will not reclassify very rare variation that is erroneously classified as pathogenic. Additionally, a low penetrance for a particular variant does not eliminate the possibility that the variant acts in concert with other variants to impact disease. Future investigators could extend the IPython notebook published here with new data sources and genetic models for their diseases of interest. The feasibility of quantitative pathogenicity reassessments will grow both with the availability of large-scale control sequence data as well as with domain expertise to specify quantitative parameters needed to compute penetrance (e.g. heterogeneity, prevalence). The future of decision theory in clinical genomics is bright if we rigorously vet pathogenicity assertions using shared data and assumptions.
Figure 5. Exploring pathogenicity ratings.
Screenshot from a website that enables users to explore disease-specific pathogenic variation. The user can select the disease, prevalence, heterogeneity, cohort used for frequency data, and penetrance threshold, and run an analysis for matching ClinVar variants. The user is linked to variant assertions in ClinVar to re-evaluate pathogenicity assertions systematically. A live version of this site can be found at http://people.fas.harvard.edu/~manrai/pathogenicity_explorer.
Table 1.
Genetic risk models. q denotes the non-reference allele frequency, γ is the per allele risk.
| Genetic model | Affected genotype frequencies (relative risk) |
|---|---|
| Autosomal dominant | q2 + 2pq (γ) |
| Autosomal recessive | q2 (γ) |
| Additive | q2 (2γ), 2pq (γ) |
| Multiplicative | q2 (γ2), 2pq (γ) |
Acknowledgments
The authors thank members of the Kohane and Patel laboratories for helpful discussions. This work was supported by U54LM008748 (AKM, BLW, and ISK) and 5K99ES023504, R21ES025052, and a PhRMA Foundation award (CJP).
Contributor Information
Arjun K Manrai, Department of Biomedical Informatics, Harvard Medical School, 10 Shattuck St., Boston, MA, 02115, USA, Manrai@post.harvard.edu.
Brice L Wang, Illinois Mathematics and Science Academy, 1500 Sullivan Rd., Aurora, IL 60506, Bwang@imsa.edu.
Chirag J Patel, Department of Biomedical Informatics, Harvard Medical School, 10 Shattuck St., Boston, MA, 02115, USA, Chirag_Patel@hms.harvard.edu.
Isaac S Kohane, Department of Biomedical Informatics, Harvard Medical School, 10 Shattuck St., Boston, MA, 02115, USA, Isaac_Kohane@hms.harvard.edu.
References
- 1.Schuster SC. Next-generation sequencing transforms today’s biology. Nat. Methods. 2008 Jan;5(1):16–18. doi: 10.1038/nmeth1156. [DOI] [PubMed] [Google Scholar]
- 2.Mailman MD, Feolo M, Jin Y, Kimura M, Tryka K, Bagoutdinov R, Hao L, Kiang A, Paschall J, Phan L, Popova N, Pretel S, Ziyabari L, Lee M, Shao Y, Wang ZY, Sirotkin K, Ward M, Kholodov M, Zbicz K, Beck J, Kimelman M, Shevelev S, Preuss D, Yaschenko E, Graeff A, Ostell J, Sherry ST. The NCBI dbGaP database of genotypes and phenotypes. Nat. Genet. 2007 Oct;39(10):1181–1186. doi: 10.1038/ng1007-1181. [DOI] [PMC free article] [PubMed] [Google Scholar]
- 3.Kerem B, Rommens J, Buchanan J, Markiewicz D, Cox T, Chakravarti A, Buchwald M, Tsui L. Identification of the cystic fibrosis gene: genetic analysis. Science (80-.) 1989 Sep;245(4922):1073–1080. doi: 10.1126/science.2570460. [DOI] [PubMed] [Google Scholar]
- 4.Bamshad MJ, Ng SB, Bigham AW, Tabor HK, Emond MJ, Nickerson DA, Shendure J. Exome sequencing as a tool for Mendelian disease gene discovery. Nat. Rev. Genet. 2011 Nov;12(11):745–755. doi: 10.1038/nrg3031. [DOI] [PubMed] [Google Scholar]
- 5.Maron BJ, Maron MS, Semsarian C. Genetics of hypertrophic cardiomyopathy after 20 years: clinical perspectives. J Am. Coll. Cardiol. 2012 Aug;60(8):705–715. doi: 10.1016/j.jacc.2012.02.068. [DOI] [PubMed] [Google Scholar]
- 6.Pao W, Girard N. New driver mutations in non-small-cell lung cancer. Lancet. Oncol. 2011 Feb;12(2):175–180. doi: 10.1016/S1470-2045(10)70087-5. [DOI] [PubMed] [Google Scholar]
- 7.Chiu RWK, Akolekar R, Zheng YWL, Leung TY, Sun H, Chan KCA, Lun FMF, Go ATJI, Lau ET, To WWK, Leung WC, Tang RYK, Au-Yeung SKC, Lam H, Kung YY, Zhang X, van Vugt JMG, Minekawa R, Tang MHY, Wang J, Oudejans CBM, Lau TK, Nicolaides KH, Lo YMD. Non-invasive prenatal assessment of trisomy 21 by multiplexed maternal plasma DNA sequencing: large scale validity study. BMJ. 2011 Jan;342(jan11_1):c7401. doi: 10.1136/bmj.c7401. [DOI] [PMC free article] [PubMed] [Google Scholar]
- 8.Rehm HL, Berg JS, Brooks LD, Bustamante CD, Evans JP, Landrum MJ, Ledbetter DH, Maglott DR, Martin CL, Nussbaum RL, Plon SE, Ramos EM, Sherry ST, Watson MS. ClinGen - The Clinical Genome Resource. N Engl. J. Med. 2015 May;372(23):2235–2242. doi: 10.1056/NEJMsr1406261. [DOI] [PMC free article] [PubMed] [Google Scholar]
- 9.Richards S, Aziz N, Bale S, Bick D, Das S, Gastier-Foster J, Grody WW, Hegde M, Lyon E, Spector E, Voelkerding K, Rehm HL. Standards and guidelines for the interpretation of sequence variants: a joint consensus recommendation of the American College of Medical Genetics and Genomics and the Association for Molecular Pathology. Genet. Med. 2015 Mar;17(5):405–423. doi: 10.1038/gim.2015.30. [DOI] [PMC free article] [PubMed] [Google Scholar]
- 10.Piton A, Redin C, Mandel J-L. XLID-causing mutations and associated genes challenged in light of data from large-scale human exome sequencing. Am. J. Hum. Genet. 2013 Aug;93(2):368–383. doi: 10.1016/j.ajhg.2013.06.013. [DOI] [PMC free article] [PubMed] [Google Scholar]
- 11.Andreasen C, Nielsen JB, Refsgaard L, Holst AG, Christensen AH, Andreasen L, Sajadieh A, Haunsø S, Svendsen JH, Olesen MS. New population-based exome data are questioning the pathogenicity of previously cardiomyopathy-associated genetic variants. Eur. J. Hum. Genet. 2013 Sep;21(9):918–928. doi: 10.1038/ejhg.2012.283. [DOI] [PMC free article] [PubMed] [Google Scholar]
- 12.Shearer AE, Eppsteiner RW, Booth KT, Ephraim SS, Gurrola J, Simpson A, Black-Ziegelbein EA, Joshi S, Ravi H, Giuffre AC, Happe S, Hildebrand MS, Azaiez H, Bayazit YA, Erdal ME, Lopez-Escamez JA, Gazquez I, Tamayo ML, Gelvez NY, Leal GL, Jalas C, Ekstein J, Yang T, Usami S, Kahrizi K, Bazazzadegan N, Najmabadi H, Scheetz TE, Braun TA, Casavant TL, LeProust EM, Smith RJH. Utilizing ethnic-specific differences in minor allele frequency to recategorize reported pathogenic deafness variants. Am. J. Hum. Genet. 2014 Oct;95(4):445–453. doi: 10.1016/j.ajhg.2014.09.001. [DOI] [PMC free article] [PubMed] [Google Scholar]
- 13.Mardis ER. The $1,000 genome, the $100,000 analysis? Genome Med. 2010 Jan;2(11):84. doi: 10.1186/gm205. [DOI] [PMC free article] [PubMed] [Google Scholar]
- 14.Jabbari J, Jabbari R, Nielsen MW, Holst AG, Nielsen JB, Haunsø S, Tfelt-Hansen J, Svendsen JH, Olesen MS. New exome data question the pathogenicity of genetic variants previously associated with catecholaminergic polymorphic ventricular tachycardia. Circ. Cardiovasc. Genet. 2013 Oct;6(5):481–489. doi: 10.1161/CIRCGENETICS.113.000118. [DOI] [PubMed] [Google Scholar]
- 15.Patel CJ, Burford B, Ioannidis JPA. Assessment of vibration of effects due to model specification can demonstrate the instability of observational associations. J Clin. Epidemiol. 2015 Jun; doi: 10.1016/j.jclinepi.2015.05.029. [DOI] [PMC free article] [PubMed] [Google Scholar]
- 16.Perez F, Granger BE. IPython: A System for Interactive Scientific Computing. Comput. Sci. Eng. 2007 May;9(3):21–29. [Google Scholar]
- 17.Landrum MJ, Lee JM, Riley GR, Jang W, Rubinstein WS, Church DM, Maglott DR. ClinVar: public archive of relationships among sequence variation and human phenotype. Nucleic Acids Res. 2014 Jan;42(Database issue):D980–D985. doi: 10.1093/nar/gkt1113. [DOI] [PMC free article] [PubMed] [Google Scholar]
- 18.Wang K, Li M, Hakonarson H. ANNOVAR: functional annotation of genetic variants from high-throughput sequencing data. Nucleic Acids Res. 2010 Sep;38(16):e164. doi: 10.1093/nar/gkq603. [DOI] [PMC free article] [PubMed] [Google Scholar]
- 19.NHLBI GO Exome Sequencing Project (ESP) Exome Variant Server. [Accessed: 25-Jul-2015]; [Online]. Available: http://evs.gs.washington.edu/EVS/ [Google Scholar]
- 20.“Exome Aggregation Consortium (ExAC) [Accessed: 05-May-2015]; [Online]. Available: http://exac.broadinstitute.org. [Google Scholar]
- 21.M B, V O, J H. D3: Data-Driven Documents. IEEE Trans. Vis. Comput. Graph. 17(17):2301–2309. doi: 10.1109/TVCG.2011.185. [DOI] [PubMed] [Google Scholar]
- 22.Maron BJ, Gardin JM, Flack JM, Gidding SS, Kurosaki TT, Bild DE. Prevalence of Hypertrophic Cardiomyopathy in a General Population of Young Adults : Echocardiographic Analysis of 4111 Subjects in the CARDIA Study. Circulation. 1995 Aug;92(4):785–789. doi: 10.1161/01.cir.92.4.785. [DOI] [PubMed] [Google Scholar]
- 23.Kohane IS, Masys DR, Altman RB. The incidentalome: a threat to genomic medicine. JAMA. 2006 Jul;296(2):212–215. doi: 10.1001/jama.296.2.212. [DOI] [PubMed] [Google Scholar]


