Abstract
Much recent research aims to identify evidence for Drug-Drug Interactions (DDI) and Adverse Drug reactions (ADR) from the biomedical scientific literature. In addition to this “Bibliome”, the universe of social media provides a very promising source of large-scale data that can help identify DDI and ADR in ways that have not been hitherto possible. Given the large number of users, analysis of social media data may be useful to identify under-reported, population-level pathology associated with DDI, thus further contributing to improvements in population health. Moreover, tapping into this data allows us to infer drug interactions with natural products—including cannabis—which constitute an array of DDI very poorly explored by biomedical research thus far.
Our goal is to determine the potential of Instagram for public health monitoring and surveillance for DDI, ADR, and behavioral pathology at large. Most social media analysis focuses on Twitter and Facebook, but Instagram is an increasingly important platform, especially among teens, with unrestricted access of public posts, high availability of posts with geolocation coordinates, and images to supplement textual analysis.
Using drug, symptom, and natural product dictionaries for identification of the various types of DDI and ADR evidence, we have collected close to 7000 user timelines spanning from October 2010 to June 2015. We report on 1) the development of a monitoring tool to easily observe user-level timelines associated with drug and symptom terms of interest, and 2) population-level behavior via the analysis of co-occurrence networks computed from user timelines at three different scales: monthly, weekly, and daily occurrences. Analysis of these networks further reveals 3) drug and symptom direct and indirect associations with greater support in user timelines, as well as 4) clusters of symptoms and drugs revealed by the collective behavior of the observed population.
This demonstrates that Instagram contains much drug- and pathology specific data for public health monitoring of DDI and ADR, and that complex network analysis provides an important toolbox to extract health-related associations and their support from large-scale social media data.
Keywords: Complex Network Analysis, Social Media, Drug Interaction, Public Health, Instagram, relational inference
1. Introduction
The analysis of social media data has recently allowed unprecedented access to collective human behavior. The new field of Computational Social Science has brought together Informatics and Complex Systems methods to study society via social media and online data in a quantitative manner not previously possible. From studying social protest1 to predicting the Stock Market,2 most of the work has focused on Twitter—though Facebook3 and Instagram4 have also received some attention lately. This approach shows great promise in monitoring public health, given the ability to measure the behavior of a very large number of human subjects.5 For instance, several studies have shown that social media analysis is useful to track and predict influenza spread,5–7 as well as the measurement of depression.8 In particular, the potential for adverse drug reaction (ADR) extraction from Twitter has been recently demonstrated.9,10
There is still, however, much work to be done in order to fulfill the potential of social media in the monitoring of public health. For instance, analysis of social media data may be useful to identify under-reported pathology, particularly in the case of conditions associated with a perceived social stigma, such as mental disorders.11 Given access to an extremely large population, it is reasonable to expect that social media data may provide early warnings about potential drug-drug interactions (DDI) and ADR.9 These unprecedented windows into collective human behavior may also be useful to study the use and potential interactions and effects of natural products—including cannabis. The pharmacology of such products constitute an array of DDI and ADR very poorly explored by biomedical research so far, and thus an arena where social media mining could provide important novel discoveries and insight.
Most work on social media pertaining to public health monitoring that we are aware of has relied on data from Twitter or Facebook. However, Instagram is an increasingly important platform, with unrestricted access of public posts, high availability of posts with geolocation coordinates, and images to supplement textual analysis. While Instagram has been used to qualitatively observe the type of content people post regarding health situations such as Ebola outbreaks,12 its potential for large-scale quantitative analysis in public health has not been established. Instagram currently has more than 300 million users.13 It surpasses Twitter and Facebook for preferred social network among teens (12–24) in the US. In 2014 there were approximately more than 64 million active users in the US and this number is to surpass 111 million in 2019.14 Therefore, our goal here is to explore the potential of this very important social media platform for public health monitoring and surveillance of DDI, ADR, and behavioral pathology at large. Specifically, we use literature mining and network science methods to automatically characterize and extract temporal signals for DDI and ADR from a sub-population of Instagram users.
We focused on posts and users with mentions of drugs known to treat depression (e.g. fluoxetine). The methodology developed can be easily replicated for different clinical interests (e.g. epilepsy drugs). The goal is to show that Instagram is a very rich source of data to study drug interactions and reactions that may arise in a clinical context of choice, and not depression per se. Using four different multi-word dictionaries (drug and pharmacology, natural products, cannabis, and ADR terminology), we have collected close to 7000 user timelines spanning from October 2010 to June 2015. We analyzed co-mentions in three distinct time-windows: monthly, weekly and daily. This allows the potential extraction of ADR and DDI that manifest at different time scales. From this data, we demonstrate that Instagram user timelines contain substantial data of interest to characterize DDI, ADR, and natural product use. To explore this data we have developed a monitoring tool to easily observe user-level timelines associated with drug and symptom terms of interest, which we describe below. To explore population-level associations at the different temporal scales, we compute knowledge networks that our previous work has shown to be useful for automated fact-checking,15 protein-protein interaction extraction,16 and recommender systems.17,18 To illustrate the potential of data-driven, population-level associations, we use spectral methods to reveal network modules of symptoms and drugs, for instance those involved in psoriasis pathology. Our Instagram analysis relies on the distance closure of complex networks18 built at distinct time resolutions, which is a novel development from related approaches to uncover ADR in Twitter.9
2. Data and Methods
We harvested from Instagram all posts containing hashtags that matched 7 drugs known to be used in the treatment of depression (# posts): fluoxetine (8,143), sertraline (574), paroxetine (470), citalopram (426), trazodone (227), escitalopram (117), and fluvoxamine (22). Synonyms were resolved to the same drug name according to DrugBank;19 for instance, Prozac is resolved to fluoxetine, see supporting information (SI) for table of synonyms used. This resulted in a total of 9,975 posts from 6,927 users, whose complete time-lines, spanning the period from October 2010 to June 2015, were collected. In total, these timelines contain 5, 329, 720 posts, which is the depression timeline dataset we analyze below.
A subset of a previously developed pharmacokinetics ontology20 was used to obtain a drug dictionary. The full ontology contains more than 100k drugs, proteins and pharmacokinetic terms. Here we used only names of FDA-approved drugs, along with their generic name and synonyms, resulting in 17,335 drug terms. The natural product (NP) dictionary was built using terms from the list of herbal medicines and their synonyms provided by MedlinePlus.21 It contains 179 terms (see SI). The Cannabis dictionary was assembled by searching the web for terms known to be used as synonyms for cannabis, resulting in 26 terms (see SI) optimized for precision and recall on a subset of posts (data not shown). The symptom dictionary was extracted from BICEPP22 by collecting all entities defined as an Adverse Effect, with a few manual edits to include more synonyms; it is comprised of 250 terms.
Timeline posts were tagged with all dictionary terms (n-grams) for a total of 299,312 matches. Uppercase characters were converted to lowercase, and hashtag terms were treated like all other harvested text for the purpose of dictionary matches. We found matches for 414 drugs, 133 of which with more than 10 matches. These numbers are 148/99 and 74/46 for symptoms and NP, respectively, for a total of 636 terms. This is a substantial number of dictionary terms, given that only 7 drugs prescribed for depression were used to harvest the set of timelines. The top 25 matches for each dictionary are provided in SI. Notice that the term ‘depression’ was removed because of its expected high appearance. Matches in the cannabis dictionary (e.g. 420, marijuana, hashish) were aggregated into the term cannabis to be treated as a NP. The top 10 mentions are (counts shown): cannabis (66,540), anorexia (26,872), anxiety (26,309), pain (15,677), suicide (11,616), mood (11,532), fluoxetine (9,961), suicidal (8,909), ginger (7,289), insomnia (5,917).
Given the set X of all matched terms (|X| = 636), we first compute a symmetric co-occurrence graph Rw(X) for time-window resolutions w = 1 month, 1 week and 1 day. These graphs are easily represented by adjacency matrices Rw, where entries rij denote the number of time-windows where terms xi and xj co-occur, in all user timelines. A matrix Rw is computed for each time-window resolution independently. To obtain a normalized strength of association among the set of terms X, we computed proximity graphs,18 Pw(X) for each time-window resolution w. Thus, the entries of the adjacency matrix Pw of a proximity graph are given by:
| (1) |
where pij ∈ [0, 1] and pii = 1; pij = 0 for terms xi and xj that never co-occur in the same time-window in any timeline, and pij = 1 when they always co-occur. This measure is the probability that two terms are mentioned in the same time window, given that one of them was mentioned.17,18 To ensure enough support exists in the data for proximity associations, we computed proximity weights only when rii + rjj − rij ≥ 10; if rii + rjj − rij < 10, we set pij = 0.
Proximity graphs are associative knowledge networks. As in any other co-occurrence method, the assumption is that items that frequently co-occur are associated with a common phenomenon. These knowledge networks have been used successfully for automated fact-checking,15 protein-protein interaction extraction,16 and recommender systems.17,18 Here we use them to reveal strong associations of DDI-related terms for public health monitoring. We also compute distance graphs Dw(X) for the same time-window resolutions, using the map:
| (2) |
In some of our analysis below, we compute the metric closure of the distance graphs, which is isomorphic to a specific transitive closure of the proximity graph.18 The metric closure is equivalent to computing the shortest paths between every pair of nodes in the distance graph. Thus, is the length (sum of distance edge weights) of the shortest path between terms xi and xj in the original distance graph Dw(X), and is known to scale well.15
3. A Monitoring tool for user-level behavior
From the analysis of user timelines, it is clear that Instagram is a social media platform with much data relevant for public-health monitoring. Users often discuss personal health-related information such as diagnoses and drugs prescribed. Photos posted (e.g. Figure 1) often depict pills and packaging, along with discussions of intake schedules, expectations and feelings.
Fig. 1.
Sample of images from collected posts related to fluoxetine.
- User A on May 25, 2014:“#notmypic .. Say hello to my new friend! Fluoxetina! Side effects by now are a bit of nausea and inquietude.. Better than zoloft! Yesterday night i started to cry while i was with my 2 friends because my ex, bulimia’s stress.. I’m sure they thought i’m crazy so i felt like i had to explain my reasons with one of those friends.. Now i’m terrified of his reaction, he is even a friend of my ex.. Don’t know what to expect.. It’s so hard telling someone about ED and bulimia . I’m also thinking about a b/p session today after 2 days clean, maybe it’s not the right solution. Idk. #bulimia #bulimic #mia #ed #edfamily #eatingdisorder #prorecovery #bingepurge #purge #binge #fat #prozac #fluoxetine #depression #meds”
- User B on May 13, 2015:“I start fluoxetine tomorrow, the doctor switched me from citalopram to this so let’s hope it goes better this time #anxietymeds #depressionmeds #citalopram #fluoxetine #anxiety #depression”
- User B on May 14, 2015 (one day later):“ok so I don’t know if it’s the tablets that are doing this but I feel the lowest I’ve ever felt and I’m hoping it’s not the tablets. Hopefully it’s just a bad day, not that there are many good days I hope tomorrow is a better day for everyone, especially if you are feeling the same way I am. #fluoxetine #depression #anxiety #depressionmeds #anxietymeds”
- User C on Feb 05 2014:“i survived another trip to the clinic, saw a specialist, did a test that explained i’m an INFJ (introvert) which is apperently only 1% of the population. Added risperidone and upped ritalin as well as prozac. considering this keeps me ‘sane’ and able to assimilate into the chaos of everyday life i think this counts as my #100happydays today #findhappinessineachday #bipolar #borderlinepersonalitydisorder #INFJ #manicdepression #goinggovernment #prozac #lamotragine #ritalin #risperidone”
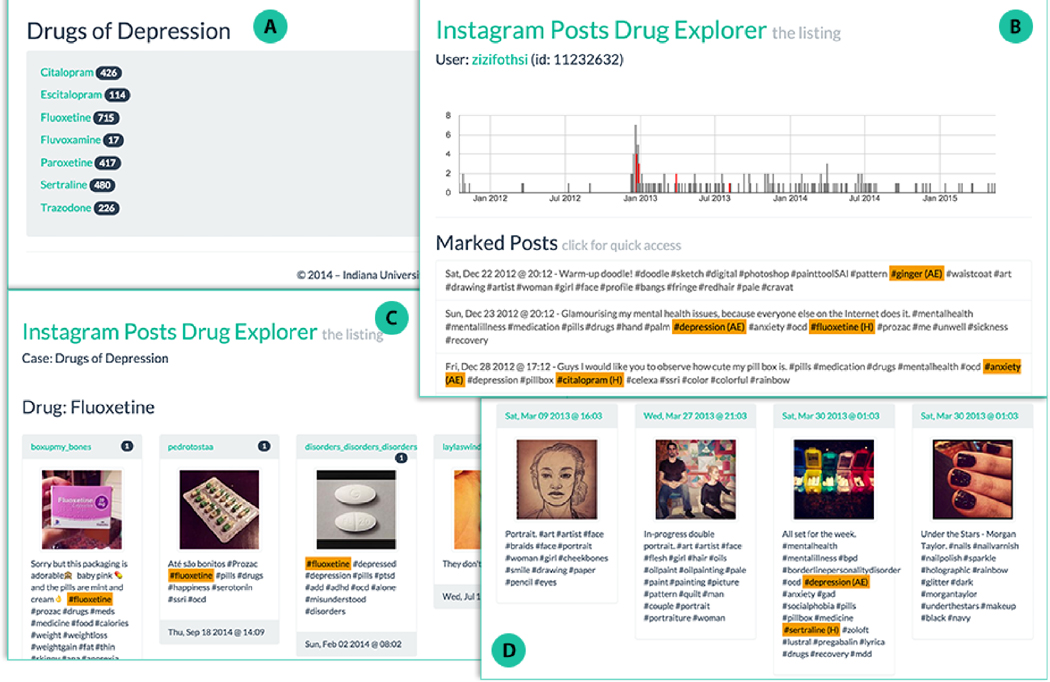
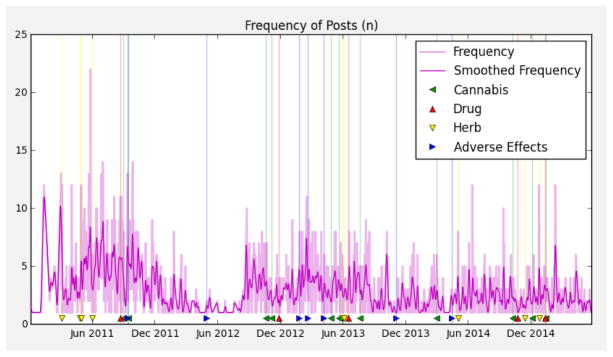
Given the rich data users post on Instagram, from the perspective of public-health monitoring, it is useful to be able to quickly navigate and extract posts and user timelines associated with drugs and symptoms of interest. For that purpose, we developed the Instagram Drug Explorera, a web application to explore, tag, and visualize the data. This tool also allows downstream improvement of our dictionaries by observing important discourse features not tagged. Figure 2 shows four screenshots with some of the current features: A) the possibility of defining multiple drugs of interest per project; B) a user timeline view that tags class-specific dictionary matches and displays post frequency in time and where individual posts can be quickly selected to be C) visualized separately; D) a summary of posts from user timelines of interest. Another feature (not shown) is the display of geo-located posts using overlay maps, which can be useful, for instance, to monitor users in places of interest, such as schools, clinics, and hospitals. Using this tool to inspect and select timelines with high number of matches, we were able to identify particularly relevant user timelines such as the one depicted in Figure 3, which contains matches from all four dictionaries, and varying post frequency.
Fig. 2.
Instagram Drug Explorer. See text for explanation.
Fig. 3.
User timeline showing daily frequency of posts in time; dictionary terms from are tagged in time.
4. Network analysis of associations in population-level behavior
Using the proximity or the isomorphic distance graphs (§2), we can explore strong pairwise term associations that arise from the collection of 5, 329, 720 posts from the population of 6, 927 users in the study. The assumption is that dictionary terms that tend to co-occur in a substantial number of user timelines may reveal important interactions among drugs, symptoms, and natural products. Moreover, because we computed these knowledge networks at different time resolutions, we can explore term associations at different time scales: day, week, and month. Naturally, a statistical term correlation is not necessarily a causal interaction; also a drug-symptom association may reveal a condition treated by the drug, rather than an adverse reaction. But large-scale analysis of social media data for relational inference must start with the identification of multivariate correlations, which can be subsequently refined, namely with supervised classification and NLP methods. Here, as a first step in the analysis of Instagram data for public health monitoring, we use unsupervised network science methods to extract term associations of potential interest.
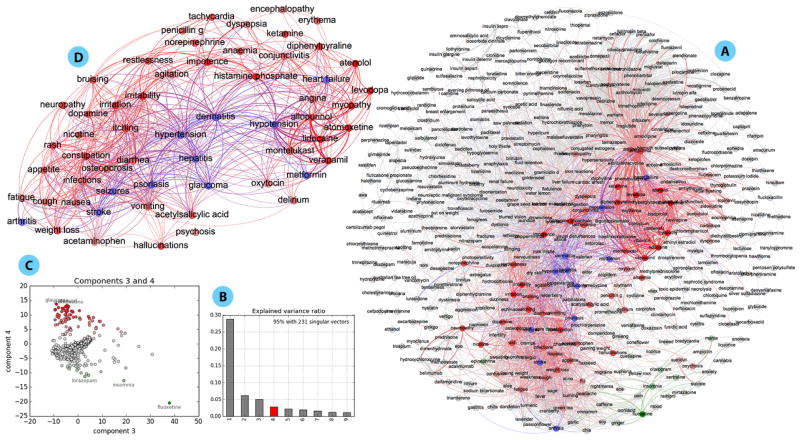
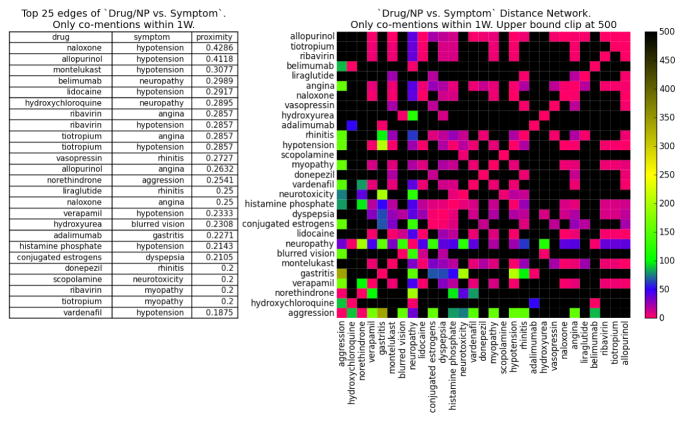
Consider the proximity networks Pw(X) for time resolution w = 1 week. The full network contains |X| = 636 terms (see Figure 5A for its largest connected component); Figure 4 (left) lists the top 25 drug/NP vs symptom associations, as well as the adjacency matrix of the distance subgraph Dw(X) for these drug/NP and symptom pairs (right). The proximity and distance graphs are isomorphic (§2), but proximity edge weights (left) are directly interpretable as a co-occurrence probability (eq. 1), while the isomorphic nonlinear map to distance (eq. 2) provides greater discrimination in the visualization of the adjacency matrix (right).
Fig. 5.
A. Largest connected component of the proximity network for 1 week time resolution; weights shown only for pij ≥ 0.05 with unconnected terms removed. Edges are colored according to correlation with PC 4. B. Spectrum of the PCA of the proximity network adjacency matrix. C. Biplot of correlation of terms with PC 3 and 4; red (green) terms are most (anti-) correlated with PC4. D. Subgraph depicting the network of terms most correlated with PC4, which is related to Psoriasis; blue nodes depict conditions linked to this complex disease (see text for details); weights shown only for pij ≥ 0.05.
Fig. 4.
drug/NP vs symptom subnetwork: (left) Top 25 pairs with largest proximity correlation. (right) adjacency matrix of distance subnetwork; nearest (furthest) term pairs in red (black).
Of the 25 to associations listed in Figure 4 (left), 12 are known or very likely ADR, 7 do not have conclusive studies but are deemed possible ADR from patient reports, 4 refer to associations between drugs/NP and symptoms they are indicated to treat, 1 has been shown to not be ADR, and 1 is unknown (evidence in SI). Thus, the strongest edges in the 1 week resolution network are relevant drug/NP-symptom associations. Furthermore, our methodology allows an analyst to collect (via the Drug Explorer tool §3) all the individual timelines and posts that support every association (edge) in the proximity networks, supporting a much more detailed study of the affected population—including for the purpose of fine-tuning dictionaries and mining techniques to better capture the semantics of specific populations.
The proximity networks Pw(X) also allow us to visualize, explore and search the “conceptual space” of drugs, symptoms, and NP as they co-occur in the depression timeline dataset. The largest connected component of the proximity network for w = 1 week is shown in Figure 5A. The network representation allows us to find clusters of associations, beyond term pairs, which may be related via the same underlying phenomenon. Many multivariate and network analysis methods can be used to uncover modular organization.23 To exemplify, here we use the Principal Component Analysis (PCA)24 of the proximity network adjacency matrix, which reveals potential phenomena of interest.
For instance, Figure 5, depicts a set of terms correlated with principal component (PC) 4 (red)—others could be chosen (see SI). The subnetwork of these terms is depicted in Figure 5D. and it reveals a set of terms denoting a complex interaction of conditions which are coherent with what is becoming known about Psoriasis. Several of the edges associate terms related to heart disease, stroke, hypertension, hypotension, and diabetes which are high risks for Psoriasis patients,25 including potential drug interactions (Metformin for Diabetes, Verapimil for high blood pressure and Stroke). This subnetwork also reveals associations with Psoriasis which are currently receiving some attention, such as with viral hepatitis26 and seizure disorder.27 Naturally, the network also includes many terms associated with skin infections and immune reactions. The Psoriasis subnetwork is just an example of a multi-term phenomenon of interest that is represented in the whole network; other PCA components are shown in SI, including additional analysis of the Psoriasis subnetwork. Importantly, we can identify users who may be experiencing this cluster of symptoms by following the posts and timelines behind the weights in the subnetwork, which is useful for public health monitoring.
While the Psoriasis subnetwork was discovered purely by data-driven analysis, another way to use these networks is to to query them for specific terms most associated with a set of drugs or symptoms of interest. This problem of finding which other items A ⊆ X are near a set of query items Q ⊆ X (including a subnetwork of interest) is common in recommender systems and information retrieval.17 The answer set A can be computed as:
| (3) |
where Φ is an operator of choice, pij is the proximity weight between terms xi and xj (§2), and α is a desired threshold. If we are interested in a set of terms A which are strongly related to every term in query set Q, then we use Φ = min. If we are interested in terms strongly related to at least one term in Q, then Φ = max. For a compromise between the two, we can use Φ = avg (average). Consider the query Q = {fluoxetine, anorexia} on the network of Figure 5A (w = 1 week). Using Φ = min, we obtain an answer set with terms strongly related to both query terms (ordered by relevance): A = {suicidal, suicide, anxiety, pain, mood, cinnamon, insomnia, soy, headache, mania, chia, cannabis }. For the query Q = {psoriasis, heart failure, stroke } using Φ = avg, we obtain (ordered by relevance): A = {infections, diarrhea, hypertension, seizures, hepatitis, constipation, dermatitis, glaucoma, vomiting }, which relates to the discussion above. Additional query examples and details of the network search interface are shown in SI.
Proximity Pw(X) networks are useful to discover associations between terms which co-occur in time windows w of user timelines (§4). But they are also useful to infer indirect associations between terms. In other words, terms that do not co-occur much in user timelines, but which tend to co-occur with the same other terms. In network science indirect associations are typically obtained via the computation of shortest path algorithms on the isomorphic distance graphs Dw(X).18 Terms which are very strongly connected via indirect paths, but weakly connected via direct edges, break transitivity criteria.18 We have previously shown that such indirect paths are useful to predict novel trends in recommender systems,18 and are also instrumental to infer factual associations in knowledge networks.15 In this context, the hypothesis is that strongly indirectly associated terms may reveal unknown DDI and ADR.
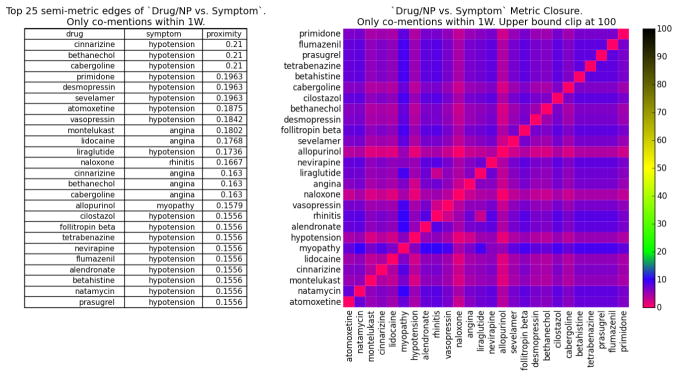
To find the term pairs that most break transitivity we compute all shortest paths in the networks (via Dijkstra’s algorithm): the metric closure . Figure 6 lists the top 25 drug/NP vs symptom associations which most break transitivity. In other words, these are term pairs which are very strongly associated via indirect paths, but very weakly associated directly. Of the extracted associations listed in the table of Figure 6, 6 are known or likely ADR, 3 are possible ADR from patient reports but no conclusive study, 2 refer to associations between drugs/NP and symptoms they are indicated to treat, and all other 14 are unknown (evidence provided in SI). Thus, unlike the case of direct associations (Figure 4), there is less evidence for the indirect associations in the literature. This could be because they are false associations, or because they have not been discovered yet. Validating these associations empirically is left for forthcoming work; here the goal is to show how network analysis methods can be used to select such latent associations which are highly implied by indirect paths (transitivity) but are not directly observed in user post co-mentions.
Fig. 6.
drug/NP vs symptom subnetwork after shortest path calculation. (left) Top 25 non-transitive term pairs. (right) adjacency matrix of distance subnetwork after shortest path calculation.
Similarly to what was done with direct associations above, we can also query the proximity network obtained after shortest path computation (the isomorphic proximity graph to via eq. 2). For instance, if we query the original w = 1 week proximity network (the one depicted in Figure 5A) with Q = {psoriasis, metformin} (a type 2 diabetes drug), using Φ = min, we obtain A = {montelukast, hypertension, dermatitis, hypotension, hepatitis} as the top 5 terms—montelukast is a drug used to treat allergies. If we now use the same query Q on the metric closure network instead, the top 5 answer set becomes AC = {montelukast, hypotension, naloxone, allopurinol, hypertension} (full query results in SI). In other words, after computing shortest paths, naloxone (a synthetic opiate antagonist used to reverse the effects, including addiction, caused by narcorics) and allopurinol (a drug used to treat gout, kidney stones, and decrease levels of uric acid in cancer patients), become more strongly associated with the query terms. These indirect associations to do not occur very strongly in the observed Instagram timeline data, but are strongly implied by indirect paths in the network of term proximity. In this case, the latent associations may provide additional evidence supporting recent observations that psoriasis (an autoimmune condition) is linked to heart disease, cancer, diabetes and depression.25
5. Discussion and Future Directions
Our preliminary analysis demonstrates that there exists a substantial health-related user community in Instagram who posts about their health conditions and medications. The drug, NP and symptom dictionaries we employed extracted a large number of posts with such data, enough to build knowledge networks of hundreds of terms representing the pharmacology and symptomatic “conceptual space” of Instagram users posting about depression. Our results and software further demonstrate that such space can be navigated for public health monitoring, whereby analysts can search and visualize user timelines of interest. Furthermore, the network representation of this space allows us to extract population-level term associations and subnetworks of terms arising from underlying (modular) phenomena of interest—such as the Psoriasis network involving various related conditions. Thus, Instagram data shows great potential for public health monitoring and surveillance for DDI and ADR.
Direct associations in the knowledge networks are substantiated by actual co-mentions in posts from user timelines, which can subsequently be retrieved by public health analysts using our drug explorer application. In our preliminary work, the top extracted direct associations are shown to be backed by the literature, but we intend to pursue the systematic validation of such associations in future work. Network methods also allow us to uncover indirect associations among terms. These may reveal latent, yet unknown, associations, and as such, very relevant for public health monitoring. Studying the network of indirect associations can be further used to understand community structure as well as redundancy in the data, which we intend to study next.
We have analyzed posts and user timelines related to depression only. Adding additional conditions of interest (e.g. epilepsy or psoriasis) to extract additional posts would monitor different communities, and would likely improve the overall extraction of associations, which we intend to test in the near future. While the drug dictionary is quite well developed already, the NP and symptoms dictionaries need to be further developed, especially towards increasing the terminology associated with symptoms as well as on catching particular linguistic expressions of symptoms in Instagram. The development of named entity recognition tailored to Instagram is another avenue we intend to pursue, starting from and expanding what has already been done for Twitter.10
The methodology we describe here allows us to discern drug, NP and symptom associations derived from user timeline co-mentions at different timescales. All the results displayed pertain to a one week window, however we also computed day and month windows. The comparison of results at different timescales would allow, in principle, the discovery of more immediate as well as more delayed interactions. Such a comparison is also something we intend to pursue in forthcoming work. Finally, the timeseries analysis of user timelines can be used to detect discernible changes in behavior for users and groups of users. One could track, for instance, critical changes in mood associated with the onset of depression,28 which constitutes yet another exciting avenue to pursue with this line of research.
Our preliminary analysis demonstrates that Instagram is a very powerful source of data of potential benefit to monitor and uncover DDI and ADR. Moreover, our work shows that complex network analysis provides an important toolbox to extract health-related associations and their support from large-scale social media data.
Acknowledgments
This work was supported by a grant from the National Institutes of Health, National Library of Medicine Program, grant 01LM011945-01“BLR: Evidence-based Drug-Interaction Discovery: In-Vivo, In-Vitro and Clinical,” and a grant from Persistent Systems. RBC is supported by CAPES Foundation Grant No. 18668127. The funders had no role in study design, data collection and analysis, decision to publish, or preparation of the manuscript.
Footnotes
References
- 1.Varol O, Ferrara E, Ogan CL, Menczer F, Flammini A. Evolution of online user behavior during a social upheaval, in. Proc. 2014 ACM Conference on Web Science; WebSci ‘142014. [Google Scholar]
- 2.Bollen J, Mao H, Zeng X. Journal of Computational Science. 2011;2:1. doi: 10.1016/j.jocs.2010.12.003. [DOI] [PMC free article] [PubMed] [Google Scholar]
- 3.Bakshy E, Messing S, Adamic LA. Science. 2015 May;348:1130. doi: 10.1126/science.aaa1160. [DOI] [PubMed] [Google Scholar]
- 4.Ferrara E, Interdonato R, Tagarelli A. Online popularity and topical interests through the lens of instagram. Proc. 25th ACM Conf. on Hypertext and Social Media; HT ‘142014. [Google Scholar]
- 5.Kautz H. Data mining social media for public health applications. 23rd Int. Joint Conf. on Artificial Intelligence (IJCAI 2013); AAAI Press; 2013. [Google Scholar]
- 6.Signorini A, Segre AM, Polgreen PM. PLoS ONE. 2011;6:e19467. doi: 10.1371/journal.pone.0019467. [DOI] [PMC free article] [PubMed] [Google Scholar]
- 7.Sadilek A, Kautz H, Silenzio V. Modeling spread of disease from social interactions. Sixth AAAI Int. Conf, on Weblogs and Social Media (ICWSM); AAAI Press; 2012. [Google Scholar]
- 8.Choudhury MD, Counts S, Horvitz E. Social media as a measurement tool of depression in populations. Proc. 5th Annual ACM Web Science Conf; ACM; 2013. WebSci’13. [Google Scholar]
- 9.Hamed AA, Wu X, Erickson R, Fandy T. J of biomedical informatics. 2015;56:157. doi: 10.1016/j.jbi.2015.05.015. [DOI] [PubMed] [Google Scholar]
- 10.Sarker A, Gonzalez G. Journal of biomedical informatics. 2015;53:196. doi: 10.1016/j.jbi.2014.11.002. [DOI] [PMC free article] [PubMed] [Google Scholar]
- 11.Pescosolido BA. Annual Review of Sociology. 2015 doi: 10.1146/annurev-soc-071312-145702. [DOI] [PMC free article] [PubMed] [Google Scholar]
- 12.Seltzer E, Jean N, Kramer-Golinkoff E, Asch D, Merchant R. Public Health. 2015 Sep;129:1273. doi: 10.1016/j.puhe.2015.07.025. [DOI] [PubMed] [Google Scholar]
- 13.Instagram Blog, 300 million. http://blog.instagram.com/post/104847837897.
- 14.Statista, Number of monthly active instagram users from january 2013 to december 2014 (in millions). http://www.statista.com/statistics/253577/
- 15.Ciampaglia GL, Shiralkar P, Rocha LM, Bollen J, Menczer F, Flammini A. PLoS ONE. 2015;10:e0128193. doi: 10.1371/journal.pone.0128193. [DOI] [PMC free article] [PubMed] [Google Scholar]
- 16.Abi-Haidar A, Kaur J, Maguitman A, Radivojac P, Rechtsteiner A, Verspoor K, Wang Z, Rocha LM. Genome Biology. 2008 Sep;9:S:11. doi: 10.1186/gb-2008-9-s2-s11. [DOI] [PMC free article] [PubMed] [Google Scholar]
- 17.Rocha LM, Simas T, Rechtsteiner A, Giacomo MD, Luce R. Mylibrary@lanl: Proximity and semi-metric networks for a collaborative and recommender web service. 2005 IEEE/WIC/ACM International Conference on Web Intelligente (WI’05); IEEE Press; 2005. [Google Scholar]
- 18.Simas T, Rocha LM. Network Science. 2015 Jun;3:227. [Google Scholar]
- 19.Wishart D, Knox C, Guo A, Cheng D, Shrivastava S, Tzur D, Gautam B, Hassanali M. Nucleic Acids Res. 2008 Jan;36:D901. doi: 10.1093/nar/gkm958. [DOI] [PMC free article] [PubMed] [Google Scholar]
- 20.Wu H-Y, Karnik S, Subhadarshini A, Wang Z, Philips S, Han X, Chiang C, Liu L, Bous-tani M, Rocha LM, Quinney SK, Flockhart D, Li L. BMC Bioinformatics. 2013;14:1. doi: 10.1186/1471-2105-14-35. [DOI] [PMC free article] [PubMed] [Google Scholar]
- 21.MedlinePlus. Herbal medicine. http://1.usa.gov/1IF33ng.
- 22.Lin FP-Y, Anthony S, Polasek TM, Tsafnat G, Doogue MP. BMC Bioinformatics. 2011 Apr;12:112. doi: 10.1186/1471-2105-12-112. [DOI] [PMC free article] [PubMed] [Google Scholar]
- 23.Fortunato S. Physics Reports. 2010;486:75. [Google Scholar]
- 24.Wall ME, Rechtsteiner A, Rocha LM. A practical approach to microarray data analysis. Springer; 2003. Singular value decomposition and principal component analysis; pp. 91–109. [Google Scholar]
- 25.WebMD. Psoriasis linked to heart disease, cancer studies also show link to increased risk of diabetes and depression. http://wb.md/1IF3hL3.
- 26.Cohen AD, Weitzman D, Birkenfeld S, Dreiher J. Dermatology. 2010;220:218. doi: 10.1159/000286131. [DOI] [PubMed] [Google Scholar]
- 27.OMK, IS, CT, GMP, MKD JAMA Neurology. 2014;71:569. [Google Scholar]
- 28.van de Leemput IA, Wichers M, Cramer AO, Borsboom D, Tuerlinckx F, Kuppens P, van Nes EH, Viechtbauer W, Giltay EJ, Aggen SH, et al. PNAS. 2014;111:87. doi: 10.1073/pnas.1312114110. [DOI] [PMC free article] [PubMed] [Google Scholar]


