

Abstract
The moa (Dinornithiformes) are large to gigantic extinct terrestrial birds of New Zealand. Knowledge about niche partitioning, feeding mode and preference among moa species is limited, hampering palaeoecological reconstruction and evaluation of the impacts of their extinction on remnant native biota, or the viability of exotic species as proposed ecological ‘surrogates'. Here we apply three-dimensional finite-element analysis to compare the biomechanical performance of skulls from five of the six moa genera, and two extant ratites, to predict the range of moa feeding behaviours relative to each other and to living relatives. Mechanical performance during biting was compared using simulations of the birds clipping twigs based on muscle reconstruction of mummified moa remains. Other simulated food acquisition strategies included lateral shaking, pullback and dorsoventral movement of the skull. We found evidence for limited overlap in biomechanical performance between the extant emu (Dromaius novaehollandiae) and extinct upland moa (Megalapteryx didinus) based on similarities in mandibular stress distribution in two loading cases, but overall our findings suggest that moa species exploited their habitats in different ways, relative to both each other and extant ratites. The broad range of feeding strategies used by moa, as inferred from interspecific differences in biomechanical performance of the skull, provides insight into mechanisms that facilitated high diversities of these avian herbivores in prehistoric New Zealand.
Keywords: ratite, dinornithiformes, finite-element analysis, biomechanics, moa
1. Introduction
Ratites, together with tinamous, form the palaeognaths, the sister group to all remaining modern birds. They include the extant ostrich (Africa), emu, cassowaries (Australia, New Guinea), rheas (South America) and kiwi (New Zealand) [1]. Their diversity is greatly augmented by recently extinct ratites, including the gigantic elephant birds of Madagascar and the moa of New Zealand [2]. Moa, represented by nine known species and six genera, went extinct around 550 years ago [3,4]. With mammalian browsers absent from New Zealand, the only other terrestrial browsers that shared habitat with moa were New Zealand geese (Cnemiornis) and Finsch's duck (Chenonetta finschi) [5]. Moa therefore played a particularly important role in the evolution of New Zealand's unique and distinctive flora as ‘ecosystem engineers’ [6–8]. The loss of this once abundant, morphologically diverse taxon probably reduced seed dispersal opportunities for some plant species [9–11], triggered the ecological release of others [12], and caused changes in understorey density, fire frequency and regeneration patterns.
These large to gigantic avian herbivores (20–200 kg) [13] are thought to have fed on a range of foods including flowers, fruits, leaves, shoots and branches of forbs, shrubs and trees, but niche partitioning among moa is poorly understood [14,15]. Up to six moa species, and commonly three to four, overlapped in geographical range [13,16,17], but on the basis of coprolite data are thought to have partitioned their niches by diet and habitat preferences [15]. Two apparent extremes in diet are the little bush moa (Anomalopteryx didiformis) and the coastal moa (Euryapterx curtus). Anomalopteryx didiformis is thought to have mostly eaten fibrous material from trees and shrubs [13,15,18,19] while E. curtus is thought to have fed on leaves and fruit [18,20]. Coprolite evidence suggests that A. didiformis was a forest specialist, the heavy-footed moa (Pachyornis elephantopus) fed in herbfields and grasslands, the upland moa (Megalapteryx didinus) was a habitat generalist and the South Island giant moa (Dinornis robustus) fed primarily in the transition zone between forest and grassland [15].
Clear distinctions in skull morphology among moa [18,21] may reflect differences in biomechanical performance and feeding strategies. The crested moa (Pachyornis australis), A. didiformis and M. didinus have bills that are relatively narrow in dorsal view compared with D. robustus, and especially E. curtus. Euryapertyx curtus also has the most rounded bill-tip in dorsal view. The bill-tip of D. robustus is rounded relative to other moa included in the present study. Pachyornis australis and M. didinus, and especially A. didiformis, have more pointed bill-tips (figure 1). Both P. australis and A. didiformis have large temporal fossa and mandibles which are deep in lateral view, suggesting relatively large jaw adducting musculature. It has been proposed that the sharp-edged mandible of A. didiformis was well adapted for cutting twigs, while the skull morphology of M. didinus may have been limiting in this regard [13,18].
Figure 1.

VM stress contour plots from FEA of ratite crania in dorsal view. The models are subjected to four loading conditions: unilateral clip, pullback, lateral shake and dorsoventral pull.
Greenwood & Atkinson [21] speculated that moa feeding involved a clamp and pull, similar to that observed in ostriches and emus [12]. At least one species of moa, D. robustus, could either cut off or break off stems of up to 6 mm in diameter [10]. Anderson [22] noted that twig material found in some moa gizzards appeared to have been sheared from the branch with the sharp edge of the bill. Moa had larger neck muscles than living ratites, as indicated by their upper cervical vertebrae, which may have allowed them to apply a greater tugging force [13,18,22].
Identifying feeding mechanisms used by moa could yield insights into how extant ratites may compare in their interaction with present-day habitats, impacting on the viability of proposals for the introduction of non-endemic extant ratites to New Zealand [8,12,23]. Such ‘rewilding’, whereby exotic species are introduced into ecosystems they have not previously occupied to serve as ecological substitutes for extinct taxa, remains controversial [24–26]; however, islands, such as those comprising New Zealand, have become a key target for rewilding projects [23,26,27]. Some have advocated reintroducing moa ‘reconstructed’ from ancient DNA [28,29]. As the viability of acquiring ancient DNA advances [30,31], so too does the interest and controversy over resurrecting extinct species [32].
Although qualitative interpretations have been proposed [13,18,21], to date no quantitative comparison of skull biomechanics has been conducted for any moa species, and the relationships between cranio-mandibular shape and feeding behaviour remain untested [15]. Here we use a three-dimensional (3D) biomechanical approach, finite-element analysis (FEA), to investigate the feeding mechanics and behaviour of five moa species, comprising representatives from five of the six known genera (electronic supplementary material, figure S1). We compare these with two extant ratites with different feeding behaviours and diets, the emu (Dromaius novaehollandiae) and southern cassowary (Casuarius casuarius) [33]. FEA is a computer-based engineering technique that has been used widely in comparative biomechanics [34,35] and has previously been used to infer diet in living and extinct taxa, including birds [36–41]. Here we ask (i) whether there are variations in the magnitudes and distributions of stress in ratite skulls under specific loading conditions, and (ii) whether these are indicative of different feeding behaviours and diets among moa and extant ratites.
As the largest extant bird to inhabit forests and the closest modern analogue in body shape to moa [18], C. casuarius is an obvious choice for comparison with moa as most of pre-Polynesian New Zealand consisted of forested areas [18]. Cassowaries are the largest living frugivorous ratites [42–44]. Based on proposed similarities in diet [18], we predict that E. curtus shared similar feeding behaviour to C. casuarius. We also include D. novaehollandiae, which has a broad diet and feeding behaviour similar to the ostrich and rheas, consisting of invertebrates and plant material (e.g. grasses, seeds, buds, leaves, herbs and fruit) [45–48]. Dromaius novaehollandiae has been proposed as a potential ‘replacement’ for moa [14,49].
2. Material and methods
(a). Computed tomography and magnetic resonance imaging scanning
The 3D models of ratite skulls were digitally constructed from computed tomographic (CT) data of E. curtus (formerly E. geranoides or E. gravis), a large Pleistocene individual from South Island, P. australis, D. robustus, A. didiformis, M. didinus, C. casuarius and D. novaehollandiae (see electronic supplementary material, table S3 for specimen information). Modelling of jaw adductors was based on magnetic resonance imaging (MRI) of mummified M. didinus (figure 2a; see the electronic supplementary material). Permission was obtained from all museum institutions to use these specimens for the present study.
Figure 2.

(a) Illustration of mummified Megalapteryx didinus NMNZ S400 (credit: Peter Trusler 1985) and (b) digital segmentation of its major jaw closing muscles. (c) Truss elements inserted to mirror line of action of each muscle subdivision used for each FEM, and position of bite restraint for unilateral clip and H-frame for extrinsic loads. Landmarks selected on each FEM to measure VM stress were positioned at equidistant points along the (d) mid-sagittal plane and (e) mandible.
(b). Body mass and muscle force estimation
Femoral circumferences were collected for all specimens, and the allometric relationship between femur circumference and body mass M = 1.08 × Cf2.28 ± 0.2 (where M is mass and Cf is femur circumference) was used to estimate specimen-specific body masses [50]. The use of femoral circumference data to estimate body mass has been widely used in birds and other taxa [51,52]. Volumetric methods are potentially more accurate, but require complete material [53,54], which was unavailable here.
The four major jaw closing muscles preserved in the mummified M. didinus specimen (figure 2b) were used to determine muscle origin and insertion areas and lines of action for all ratites. These were Pseudotemporalis superficialis, Adductor externus medialis, Pterygoideus medialis and Pterygoideus lateralis. Maximum muscle force of M. didinus was determined for each muscle subdivision by multiplying an estimated force of 0.3 N mm−2 for vertebrate striated muscle by the muscle's maximum cross-sectional area taken from MRI data [55] (electronic supplementary material, table S1).
Prediction of muscle forces was scaled according to body mass following a two-thirds power relationship, whereby muscle force is proportional to cross-sectional area while body mass is proportional to volume [56]. All else being equal, larger animals have relatively less available muscle force in proportion to body mass compared with smaller animals [57]. Muscle forces were scaled using the following equation [58]:
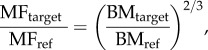 |
where MFtarget is the muscle force of target specimen (subject of our calculation), MFref is muscle force generated by reference specimen, BMtarget is body mass of target specimen and BMref is body mass of reference specimen. The calculations are based on the premise that when a body is scaled geometrically by a factor of k in all dimensions, the volume increases by a factor of k3, but the muscle cross-sectional area scales by a factor of k2. We used the above equation to determine muscle force generated by a moa specimen when scaled by the same factor (k) in all dimensions. Specimen-specific estimated muscle forces of M. didinus specimen NMNZ S400 were used as MFref to estimate MFtarget of all other ratite finite-element models (FEMs) during a unilateral clip.
(c). Finite-element model assembly
Volume meshes of each skull were created in Mimics (v. 16.0) and 3-matic (v. 8.0). All FEMs comprised at least 1.9 million 4-noded tetrahedral elements (tet4) (electronic supplementary material, table S2). FEMs were assembled using Strand7 (v. 2.4.6) following previously published procedures [37,38,41,58]. All FEMs were homogeneous and tet4 elements were isotropic. FEMs were assigned a Young's modulus (13.65 GPa) and Poisson's ratio (0.35) as previously applied to avian cranial FEMs [59]. A gape angle of 6.4 degrees was applied to all FEMs based on the minimum gape required to fit a 10 mm width twig at the bite point of M. didinus for an intrinsic load (figure 2c). This species was selected as a reference because of the exceptional quality of the mummified soft tissue present for this specimen.
(d). Restraints
Models were restrained at the occipital condyle for all load cases. A rigid link (infinitely stiff for compression, extension and rotation) spanning the foramen magnum was created. This was split in half and restrained at the centre node for all degrees of freedom (global x, y, z restraint for translation and rotation). This restrains the FEM of the cranium in virtual space. A network of beams was tessellated around each of the muscle beam attachment nodes to minimize stress artefacts arising from single node loadings.
(e). Loading cases
A unilateral clip was applied to simulate the bird clipping a twig with force concentrated to one side [60]. The restraint was placed slightly posterior to the median caudal margin of the premaxilla (figure 2c). Three further load cases were solved for each FEM, simulating movements of the skull relative to the plant material being removed: a pullback, lateral shake and dorsoventral pull. A pullback simulates the bill holding and pulling an object. A lateral shake simulates the head moving to the side, while a dorsoventral pull simulates head depression. For all extrinsic cases loads were 10 times the specimen's estimated body mass (electronic supplementary material, table S3). The factor by which extrinsic loads are multiplied is arbitrary. This does not influence interpretation in a comparative context if applied universally [58,61,62].
(f). Von Mises stress
Relative mechanical performance was assessed on the basis of visual output in Strand7 and statistical analysis of Von Mises (VM) stress distribution for each skull using PAST (v. 3.06) [63]. Mean ‘brick’ element stresses were compared between species. For each FEM, ten equidistant points were selected along the mid-sagittal plane and mandible (figure 2d,e), following Attard et al. [58] (see the electronic supplementary material) such that the points are homologous [64] where the outline is the unit of homology, not the individual point. Differences in geometry and stress distribution in the mandible are more likely to reflect differences in feeding behaviour than are differences in the cranium because it is less constrained by the need to perform other functions [38,65]. As this is a comparative study, the stress results are only of value in this context (i.e. it is relative stress magnitudes that are important, not actual values) [34,38,40]. General protocols applied in this study have been applied and validated previously [38].
Principal component (PC) axes were used to create phylomorphospaces following Sidlauskas [66] in the Rhetenor module of the software Mesquite [67]. Phylomorphospace ordinates were scaled by branch length and phylogenetic relationships for all species were derived from a pruned version of the total evidence phylogeny constructed by Mitchell et al. [33]. To quantify phylogenetic signal in stress values for each loading case, the first three PC axes, as graphed in electronic supplementary material, figures S2–S5, were tested using Blomberg's K statistic [68]. Blomberg's K statistic was calculated using the R package Picante (v. 1.6–2) [69]. The total evidence phylogeny of Mitchell et al. [33] was used as phylogenetic framework. Values of greater than 1 for the K statistic indicate that close relatives are more similar in stress values under a particular loading case than expected given the topology and branch lengths, whereas values of less than 1 indicate less phylogenetic signal than expected under a BM model.
3. Results
(a). Body mass estimates
Specimen-specific predicted body masses based on long-bone circumference [50] are listed in the electronic supplementary material, table S3. All specimens except D. novaehollandiae were within ranges reported in the literature; however, the E. curtus and D. robustus specimens were, respectively, relatively large and small for their species.
(b). Von Mises stress
Visual output of stress for all loading cases is shown in figures 1 and 3. Extractions of PCs are shown in the electronic supplementary material, table S4. Results are below and in the electronic supplementary material. Casuarius casuarius experienced very low stress along the cranial casque for all loads (figure 1), preventing meaningful comparison with other taxa at landmarks 3–10, and it was excluded from statistical analysis of stress along the mid-sagittal plane.
Figure 3.

VM stress contour plots from FEA of ratite mandibles in lateral view. FEMs were subjected to four loading conditions; unilateral clip, pullback, lateral shake and dorsoventral pull.
(c). Unilateral clip (intrinsic loading case)
The distribution and magnitude of stress along the mandible during a unilateral clip differed considerably between the two extant ratites and moa species. Both extant ratites experienced relatively low stress along the mandible, obtaining the lowest PC1 scores (73.2%; electronic supplementary material, figure S2) of all species analysed. All moa, except E. curtus, grouped together with comparatively higher PC1 and PC2 scores (accounting for variance at landmarks 1 and 10, respectively) that signified relatively high stress along the mandible (electronic supplementary material, figures S2 and S3).
Peak stress along the mandible and mid-sagittal plane for a unilateral clip was highest for E. curtus and M. didinus. Euryapteryx curtus had the highest PC1 scores along the mandible of all ratites and along the mid-sagittal plane among moa (electronic supplementary material, figure S2), with loading positive overall in both cases (electronic supplementary material, figure S6), suggesting that the skull of E. curtus exhibits higher stress than the other moa species. Anomalopteryx didiformis had the lowest PC1 scores among moa for stress measured both along the mandible and mid-sagittal plane (electronic supplementary material, figure S2). The Kruskal–Wallis test revealed that interspecific differences were not significant (mandible: χ2 = 3.69, p = 0.71; mid-sagittal plane: χ2 = 2.33, p = 0.80).
(d). Pullback (extrinsic loading case)
Mandibular stresses during a pullback differed greatly between the extant ratites. Dromaius novaehollandiae experienced two points of peak stress while C. casuarius experienced one (electronic supplementary material, figure S3). Before Bonferroni correction, mandibular landmark stress was significantly higher in D. novaehollandiae compared with C. casuarius (χ2 = 11.31, p = 0.05). Dromaius novaehollandiae and A. didiformis were the only pairwise comparison between an extant and extinct ratite to show significant differences in mandibular stress values during a pullback before Bonferroni correction (χ2 = 11.31, p = 0.04). Stress was comparatively higher in D. novaehollandiae (figure 3).
A pullback along the mid-sagittal plane revealed greater similarities in stress between moa species compared with D. novaehollandiae along PC1 (84.8%; electronic supplementary material, figure S3). Before Bonferroni correction, stress values for D. robustus along the mid-sagittal plane were significantly greater than for M. didinus and D. novaehollandiae (χ2 = 29.07, p = 0.02–0.03), and values for E. curtus were marginally greater than in M. didinus (χ2 = 27.09, p = 0.05). Interspecific differences were not significant along the mandible or mid-sagittal plane after Bonferroni correction (electronic supplementary material, table S5).
(e). Lateral shake (extrinsic loading case)
Surprisingly, D. novaehollandiae and M. didinus shared similar mandibular stress distributions and magnitudes during a lateral shake, grouping together in the PCA plot. Although E. curtus had similar PC scores to these two species, the output of stress distribution displayed in the line graph revealed discrete differences (electronic supplementary material, figure S4), suggesting similarities in biomechanical performance for D. novaehollandiae and M. didinus under this loading. As overall stress along the mandible for a lateral shake was highest in these two species (excepting E. curtus), neither D. novaehollandiae nor M. didinus appear well adapted to acquire food in this manner (figure 3; electronic supplementary material, figure S4).
Pairwise comparisons for mandibular stress after Bonferroni correction showed P. australis exhibited lower stress than M. didinus and D. novaehollandiae (χ2 = 26.57, p = 0.03–0.05; electronic supplementary material, figure S4). Before Bonferroni correction, P. australis was distinguished from all species (χ2 = 26.57, p < 0.01) except E. curtus and C. casuarius. Pachyornis australis also had the lowest relative mean ‘brick’ stress in the mandible (electronic supplementary material, figure S7). Anomalopteryx didiformis and D. robustus grouped together on the PCA, and exhibited lower mandibular stresses than other moa, except P. australis (electronic supplementary material, figure S4). Dromaius novaehollandiae was significantly different from C. casuarius, P. australis and D. robustus (χ2 = 26.57, p = 0.002–0.02) after Bonferroni correction.
(f). Dorsoventral pull (extrinsic loading case)
The distributions and magnitudes of stress varied considerably between moa species along the mandible for a dorsoventral pull. Pachyornis australis had the lowest overall magnitudes, excepting A. didiformis, before Bonferroni correction (χ2 = 14.88, p < 0.02; electronic supplementary material, figure S5), and had the lowest mean ‘brick’ mandibular stress (electronic supplementary material, figures S5 and S7). Pachyornis australis was significantly different only from M. didinus after Bonferroni correction (χ2 = 14.88, p = 0.03). Dorsoventral and unilateral loading cases both show K > 1, indicating significantly more signal than expected under Brownian motion, yet p-values were only significant for mandibular stress during a dorsoventral pull for PC1 (p = 0.01) and PC2 (p = 0.03; electronic supplementary material, table S4).
4. Discussion
As skulls are most resistant to loads applied through their preferred loading regime [70], differences in stress magnitudes and distributions probably reflect differences in biting and feeding styles of extinct moa. Phylogenetic signal in stresses shown in PCA plots was only significant for a dorsoventral pull based on Blomberg's K statistic values, and results from comparative FEA suggest considerable differences in mechanical performance between moa species. This may reflect food partitioning among sympatric species to reduce competitive interactions. Results further suggest that the skull of A. didiformis was better adapted to a unilateral clip, supporting the proposition that its relatively short, sharp-edged bill was better suited to cutting than those of other moas [18].
For all loads, we found that E. curtus exhibited the highest stresses along the mid-sagittal plane, and highest or second highest mandibular stresses relative to all other species. This suggests that E. curtus had a relatively weak skull and a diet more limited in breadth, as previously hypothesized [18]. Cross-sections of its bill [13] show that the bone in the mandible of this species is relatively thin and near the tip is more dorsoventrally flattened. It is much thinner than that of Dinornis species, in which the whole bill is far more dorsoventrally flattened, and in lateral view the tip is clearly more deeply curved than in all other ratites considered in this study. The rounded bill-tip of E. curtus appears better-adapted to plucking soft leaves and fruit directly from vegetation or from the ground, whereas more pointed bills of other moa appear better suited to clipping and pulling fibrous leaves and twigs. These findings support the contention that E. curtus acted as fruit seed dispersers, as do cassowaries in North Queensland [71,72]. Biomechanical limitations of the skull, reflecting a narrower dietary niche, may have compelled E. curtus to travel further than other moas in the search for suitable food. It may also explain why this species was limited to lowland grassland–shrubland–forest mosaics, where fruiting shrubs and forbs are abundant and diverse.
Our results point to means whereby moa species once considered to be dietary generalists (e.g. P. australis, M. didinus and D. robustus [15]) were able to coexist. Pachyornis australis was best suited to performing a lateral shake and dorsoventral pull (see electronic supplementary material, figures S4 and S5). Anomalopteryx didiformis was better adapted than all ratites at performing a pullback based on overall low stresses. Of loads investigated in this study, M. didinus appears best suited to perform a pullback, while D. robustus was better adapted to perform a lateral shake.
The distribution of mandibular stresses in C. casuarius for a lateral shake and pullback was very different to that of all moa, being relatively low and more evenly distributed. Ratites with beaks that are more cylindrical in cross-section, particularly M. didinus and D. novaehollandiae, might be better adapted for specialized twisting motions, because of increased versatility and precision, as suggested for other avian groups [73,74].
Our results also show dissimilarities in cranio-mandibular mechanical performance between living ratites and moa, indicating that moa used different feeding mechanisms to fulfil different ecological roles. In particular, stress distribution patterns along the mandible for a unilateral clip and dorsoventral pull separated both extant ratites from the moas, suggesting that most moas were better adapted to withstand forces generated through clipping vegetation or head depression to remove foliage.
It has been argued that deer, introduced to New Zealand between 1851 and 1926 [75,76], have similar feeding preferences to extant ratites and may, in part, perform as ecological surrogates for moa [77]. However, coprolite evidence shows that moa ate a high proportion of plant taxa that are typically avoided by ungulates, including some toxic to mammals [78]. Ratites may be less likely to cause damage to litter-dwelling microfauna and their habitat through trampling than hard-hoofed deer [77], but notwithstanding some evidence for overlap in biomechanical performance between the emu and a single moa species (M. didinus), our results suggest that extant ratites would be poor replacements for moa. At best, this could only partially fill ecological roles of moa and would not restore ecosystem function. A similar conclusion has been reached on the basis of trace fossil data [15]. Introducing extant ratites to New Zealand may pose a higher risk compared with introductions involving smaller herbivores, as extant ratites have relatively large home ranges [79,80], making them harder to manage [26]. Other concerns include introduction of exotic diseases that may spread to native species [81].
5. Conclusion
Our results suggest a broad range of browsing behaviours among moa genera based on biomechanical simulation, and, further, that moa deployed feeding strategies that were generally distinct from those of extant ratites. The diversity of moa communities was likely to have been sustained by partitioning of resources, facilitated, at least in part, through differences in feeding behaviour consistent with differences in cranio-mandibular mechanics.
Supplementary Material
Acknowledgements
We thank the Museum of New Zealand Te Papa Tongarewa, Canterbury Museum and South Australia Museum for loan of specimens for CT scanning. We especially thank Peter Trusler for providing his painting of M. didinus in figure 2 and Alan Tennyson of Museum of New Zealand Te Papa Tongarewa for organizing MRI scanning of this specimen. Thanks to Ashok Ilankovan from Materialise for his assistance in establishing protocols to calculate maximum muscle cross-sectional area from CT data.
Data accessibility
Virtual 3D PDFs of all skulls based on surface meshes can be viewed for free using the most recent version of Adobe Reader, in addition to nastran files of the volume meshes. These files have been placed in the Dryad Digital Repository: http://dx.doi.org/10.5061/dryad.hf0rm.
Authors' contributions
M.R.G.A. conceived and designed the study, collected and analysed the data, and prepared the manuscript. L.A.B.W. analysed the data and helped draft the manuscript. T.H.W., P.S. and P.J. participated in the design of the study, provided data and edited the manuscript. W.C.H.P. helped collect the data and helped draft the manuscript. S.W. conceived the study, participated in the design of the study and edited the manuscript. All authors gave approval for publication.
Competing interests
We declare we have no competing interests.
Funding
Australian Research Council funded to S.W. (DP140102659 and DP140102656), T.H.W. (DE130101133) and L.A.B.W. (DE150100862). L.A.B.W. is also supported by the Swiss National Science Foundation (SNF) (PBZHP3_141470 and P300P3_151189). W.C.H.P. is supported by the Surgical and Orthopaedic Research Laboratory.
References
- 1.Harshman J, et al. 2008. Phylogenomic evidence for multiple losses of flight in ratite birds. Proc. Natl Acad. Sci. USA 105, 13 462–13 467. ( 10.1073/pnas.0803242105) [DOI] [PMC free article] [PubMed] [Google Scholar]
- 2.Worthy TH, Scofield RP. 2012. Twenty-first century advances in knowledge of the biology of moa (Aves: Dinornithiformes): a new morphological analysis and moa diagnoses revised. NZ J. Zool. 39, 87–153. ( 10.1080/03014223.2012.665060) [DOI] [Google Scholar]
- 3.Perry GLW, Wheeler AB, Wood JR, Wilmshurst JM. 2014. A high-precision chronology for the rapid extinction of New Zealand moa (Aves, Dinornithiformes). Quat. Sci. Rev. 105, 126–135. ( 10.1016/j.quascirev.2014.09.025) [DOI] [Google Scholar]
- 4.Allentoft ME, Heller R, Oskam CL, Lorenzen ED, Hale ML, Gilbert MTP, Jacomb C, Holdaway RN, Bunce M. 2014. Extinct New Zealand megafauna were not in decline before human colonization. Proc. Natl Acad. Sci. USA 111, 4922–4927. ( 10.1073/pnas.1314972111) [DOI] [PMC free article] [PubMed] [Google Scholar]
- 5.Caughley G. 1989. New Zealand plant-herbivore systems: past and present. NZ J. Ecol. 12, 3–10. [Google Scholar]
- 6.Batcheler C. 1989. Moa browsing and vegetation formations, with particular reference to deciduous and poisonous plants. NZ J. Ecol. 12, 57–65. [Google Scholar]
- 7.Cooper A, Atkinson IA, Lee WG, Worthy TH. 1993. Evolution of the moa and their effect on the New Zealand flora. Trends Ecol. Evol. 8, 433–437. ( 10.1016/0169-5347(93)90005-A) [DOI] [PubMed] [Google Scholar]
- 8.Lee WG, Wood JR, Rogers GM. 2010. Legacy of avian-dominated plant-herbivore systems in New Zealand. NZ J. Ecol. 34, 28–47. [Google Scholar]
- 9.Clout MN, Hay JR. 1989. The importance of birds as browsers, pollinators and seed dispersers in New Zealand forests. NZ J. Ecol. 12, 27–33. [Google Scholar]
- 10.Burrows CJ, McCulloch B, Trotter MM. 1981. The diet of moas. Rec. Canterbury. Mus. 9, 309–336. [Google Scholar]
- 11.Thorsen MJ, Seddon PJ, Dickinson KJM. 2011. Faunal influences on New Zealand seed dispersal characteristics. Evol. Ecol. 25, 1397–1426. ( 10.1007/s10682-011-9470-1) [DOI] [Google Scholar]
- 12.Bond WJ, Lee WG, Craine JM. 2004. Plant structural defences against browsing birds: a legacy of New Zealand's extinct moas. Oikos 104, 500–508. ( 10.1111/j.0030-1299.2004.12720.x) [DOI] [Google Scholar]
- 13.Atkinson IAE, Greenwood RM. 1989. Relationships between moas and plants. NZ J. Ecol. 12, 67–96. [Google Scholar]
- 14.Nicholls H. 2006. Restoring nature's backbone. PLoS Biol. 4, e202 ( 10.1371/journal.pbio.0040202) [DOI] [PMC free article] [PubMed] [Google Scholar]
- 15.Wood JR, Wilmshurst JM, Richardson SJ, Rawlence NJ, Wagstaff SJ, Worthy TH, Cooper A. 2013. Resolving lost herbivore community structure using coprolites of four sympatric moa species (Aves: Dinornithiformes). Proc. Natl Acad. Sci. USA 110, 16 910–16 915. ( 10.1073/pnas.1307700110) [DOI] [PMC free article] [PubMed] [Google Scholar]
- 16.Scarlett RJ. 1974. Moa and man in New Zealand. Notornis 21, 1–12. [Google Scholar]
- 17.Anderson AJ. 1982. Habitat preferences of moa in central Otago, A.D. 1000–1500, according to palaeobotanical and archaeological evidence. J. R. Soc. NZ 12, 321–336. ( 10.1080/03036758.1982.10415351) [DOI] [Google Scholar]
- 18.Worthy TH, Holdaway RH. 2002. Prehistoric life of New Zealand. The lost world of the Moa. Bloomington, IN: Indiana University Press. [Google Scholar]
- 19.Wood JR, Wilmshurst JM, Worthy TH, Cooper A. 2012. First coprolite evidence for the diet of Anomalopteryx didiformis, an extinct forest ratite from New Zealand. NZ J. Ecol. 36, 164–170. [Google Scholar]
- 20.Wood JR, Wilmshurst JM. 2013. Pollen analysis of coprolites reveals dietary details of heavy-footed moa (Pachyornis elephantopus) and coastal moa (Euryapteryx curtus) from Central Otago. NZ J. Ecol. 37, 151–155. [Google Scholar]
- 21.Greenwood RM, Atkinson IAE. 1977. Evolution of divaricating plants in New Zealand in relation to moa browsing. Proc. NZ Ecol. Soc. 24, 21–33. [Google Scholar]
- 22.Anderson A. 2003. Prodigious birds: moas and moa-hunting in New Zealand. Cambridge, UK: Cambridge University Press. [Google Scholar]
- 23.Atkinson IAE. 1988. Presidential address: opportunities for ecological restoration. NZ J. Zool. 11, 1–12. [Google Scholar]
- 24.Seddon PJ, Griffiths CJ, Soorae PS, Armstrong DP. 2014. Reversing defaunation: restoring species in a changing world. Science 345, 406–412. ( 10.1126/science.1251818) [DOI] [PubMed] [Google Scholar]
- 25.Jaffe E. 2006. Brave old world: the debate over rewilding North America with ancient animals. Sci. News 170, 314–316. ( 10.2307/4017407) [DOI] [Google Scholar]
- 26.Hansen DM. 2010. On the use of taxon substitutes in rewilding projects on islands. Islands Evol. 19, 111–146. [Google Scholar]
- 27.Kaiser-Bunbury CN, Traveset A, Hansen DM. 2010. Conservation and restoration of plant–animal mutualisms on oceanic islands. Perspect. Plant Ecol. Evol. Syst. 12, 131–143. ( 10.1016/j.ppees.2009.10.002) [DOI] [Google Scholar]
- 28.Howard BC. 2013. Pictures: extinct species that could be brought back. National Geographic. See http://news.nationalgeographic.com/news/2013/03/pictures/130305-bring-back-extinct-species/ (accessed 18 August 2015).
- 29.Edwards S, Small V. 2014. Time to bring back…the moa. The Dominion Post (Wellington, New Zealand). See http://www.stuff.co.nz/national/10216641/Time-to-bring-back-the-moa (accessed 18 August 2015).
- 30.Green RE, et al. 2006. Analysis of one million base pairs of Neanderthal DNA. Nature 444, 330–336. ( 10.1038/nature05336) [DOI] [PubMed] [Google Scholar]
- 31.Pask AJ, Behringer RR, Renfree MB. 2008. Resurrection of DNA function in vivo from an extinct genome. PLoS ONE 3, e2240 ( 10.1371/journal.pone.0002240) [DOI] [PMC free article] [PubMed] [Google Scholar]
- 32.Friese C, Marris C. 2014. Making de-extinction mundane? PLoS Biol. 12, e1001825 ( 10.1371/journal.pbio.1001825) [DOI] [PMC free article] [PubMed] [Google Scholar]
- 33.Mitchell KJ, Llamas B, Soubrier J, Rawlence NJ, Worthy TH, Wood J, Lee MSY, Cooper A. 2014. Ancient DNA reveals elephant birds and kiwi are sister taxa and clarifies ratite bird evolution. Science 344, 898–900. ( 10.1126/science.1251981) [DOI] [PubMed] [Google Scholar]
- 34.Rayfield EJ. 2007. Finite element analysis and understanding the biomechanics and evolution of living and fossil organisms. Annu. Rev. Earth Planet. Sci. 35, 541–576. ( 10.1146/annurev.earth.35.031306.140104) [DOI] [Google Scholar]
- 35.Panagiotopoulou O. 2009. Finite element analysis (FEA): applying an engineering method to functional morphology in anthropology and human biology. Ann. Hum. Biol. 36, 609–623. ( 10.1080/03014460903019879) [DOI] [PubMed] [Google Scholar]
- 36.Degrange FJ, Tambussi CP, Moreno K, Witmer LM, Wroe S. 2010. Mechanical analysis of feeding behavior in the extinct ‘terror bird’ Andalgalornis steulleti (Gruiformes: Phorusrhacidae). PLoS ONE 5, e11856 ( 10.1371/journal.pone.0011856) [DOI] [PMC free article] [PubMed] [Google Scholar]
- 37.Attard MRG, Chamoli U, Ferrara TL, Rogers TL, Wroe S. 2011. Skull mechanics and implications for feeding behaviour in a large marsupial carnivore guild: the thylacine, Tasmanian devil and spotted-tailed quoll. J. Zool. 285, 292–300. ( 10.1111/j.1469-7998.2011.00844.x) [DOI] [Google Scholar]
- 38.Wroe S, Ferrara TL, McHenry CR, Curnoe D, Chamoli U. 2010. The craniomandibular mechanics of being human. Proc. R. Soc. B 277, 3579–3586. ( 10.1098/rspb.2010.0509) [DOI] [PMC free article] [PubMed] [Google Scholar]
- 39.Soons J, Herrel A, Genbrugge A, Aerts P, Podos J, Adriaens D, de Witte Y, Jacobs P, Dirckx J. 2010. Mechanical stress, fracture risk and beak evolution in Darwin's ground finches (Geospiza). Phil. Trans. R. Soc. B 365, 1093–1098. ( 10.1098/rstb.2009.0280) [DOI] [PMC free article] [PubMed] [Google Scholar]
- 40.Rayfield EJ, Norman DB, Horner CC, Horner JR, Smith PM, Thomason JJ, Upchurch P. 2001. Cranial design and function in a large theropod dinosaur. Nature 409, 1033–1037. ( 10.1038/35059070) [DOI] [PubMed] [Google Scholar]
- 41.McHenry CR, Wroe S, Clausen PD, Moreno K, Cunningham E. 2007. Supermodeled sabercat, predatory behavior in Smilodon fatalis revealed by high-resolution 3D computer simulation. Proc. Natl Acad. Sci. USA 104, 16 010–16 015. ( 10.1073/pnas.0706086104) [DOI] [PMC free article] [PubMed] [Google Scholar]
- 42.Hvass H, Vevers G. 1975. Birds of the world. London, UK: Eyre Methuen. [Google Scholar]
- 43.Wright D. 2005. Diet, keystone resources and altitudinal movement of dwarf cassowaries in relation to fruiting phenology in a Papua New Guinean rainforest. In Tropical fruits and frugivores (eds Dew JL, Boubli JP), pp. 205–236. Rotterdam, The Netherlands: Springer. [Google Scholar]
- 44.McKey D. 1975. The ecology of coevolved seed dispersal systems. In Coevolution of animals and plants (eds Gilbert LD, Raven PH), pp. 159–191. Austin, TX: University of Texas Press. [Google Scholar]
- 45.Noble JC. 1991. On ratites and their interactions with plants. Rev. Chil. Hist. Nat. 64, 85–118. [Google Scholar]
- 46.Nayman J. 1972. Atlas of wildlife. London, UK: Heinemann. [Google Scholar]
- 47.Robinson ER, Seely MK. 1975. Some food plants of ostriches in the Namib Desert Park, South West Africa. Madoqua 4, 99–100. [Google Scholar]
- 48.Davies SJF. 1976. The natural history of the emu in comparison with that of other ratites. In Proc. XVI Int. Orn. Congr., pp. 109–120. [Google Scholar]
- 49.Wood JR, Rawlence NJ, Rogers GM, Austin JJ, Worthy TH, Cooper A. 2008. Coprolite deposits reveal the diet and ecology of the extinct New Zealand megaherbivore moa (Aves, Dinornithiformes). Quat. Sci. Rev. 27, 2593–2602. ( 10.1016/j.quascirev.2008.09.019) [DOI] [Google Scholar]
- 50.Anderson JF, Hall-Martin A, Russell DA. 1985. Long-bone circumference and weight in mammals, birds, and dinosaurs. J. Zool. 207, 53–61. ( 10.1111/j.1469-7998.1985.tb04915.x) [DOI] [Google Scholar]
- 51.Campbell KE Jr, Marcus L. 1992. The relationship of hindlimb bone dimensions to body weight in birds. In Papers in avian paleontology honoring Pierce Brodkorb, incorporating the Proc. of the II Int. Symp. of the Society of Avian Paleontology and Evolution (ed. Campbell KE Jr), pp. 395–412. Science Series 36 Los Angeles, CA: Natural History Museum of Los Angeles County. [Google Scholar]
- 52.Field DJ, Lynner C, Brown C, Darroch SAF. 2013. Skeletal correlates for body mass estimation in modern and fossil flying birds. PLoS ONE 8, e82000 ( 10.1371/journal.pone.0082000) [DOI] [PMC free article] [PubMed] [Google Scholar]
- 53.Brassey CA, Maidment SCR, Barrett PM. 2015. Body mass estimates of an exceptionally complete Stegosaurus (Ornithischia: Thyreophora): comparing volumetric and linear bivariate mass estimation methods. Biol. Lett. 11, 20140984 ( 10.1098/rsbl.2014.0984) [DOI] [PMC free article] [PubMed] [Google Scholar]
- 54.Brassey CA, Sellers WI. 2014. Scaling of convex hull volume to body mass in modern primates, non-primate mammals and birds. PLoS ONE 9, e91691 ( 10.1371/journal.pone.0091691) [DOI] [PMC free article] [PubMed] [Google Scholar]
- 55.Weijs WA, Hillen B. 1985. Cross-sectional areas and estimated intrinsic strength of the human jaw muscles. Acta Morphol. Neerl. Scand. 23, 267–274. [PubMed] [Google Scholar]
- 56.Wroe S, Chamoli U, Parr WCH, Clausen P, Ridgely R, Witmer L. 2013. Comparative biomechanical modeling of metatherian and placental saber-tooths: a different kind of bite for an extreme pouched predator. PLoS ONE 8, e66888 ( 10.1371/journal.pone.0066888) [DOI] [PMC free article] [PubMed] [Google Scholar]
- 57.Boyer DM, Seiffert ER, Gladman JT, Bloch JI. 2013. Evolution and allometry of calcaneal elongation in living and extinct primates. PLoS ONE 8, e67792 ( 10.1371/journal.pone.0067792) [DOI] [PMC free article] [PubMed] [Google Scholar]
- 58.Attard MRG, Parr WCH, Wilson LAB, Archer M, Hand SJ, Rogers TL, Wroe S. 2014. Virtual reconstruction and prey size preference in the mid cenozoic thylacinid, Nimbacinus dicksoni (Thylacinidae, Marsupialia). PLoS ONE 9, e93088 ( 10.1371/journal.pone.0093088) [DOI] [PMC free article] [PubMed] [Google Scholar]
- 59.Rayfield EJ. 2011. Strain in the ostrich mandible during simulated pecking and validation of specimen-specific finite element models. J. Anat. 218, 47–58. ( 10.1111/j.1469-7580.2010.01296.x) [DOI] [PMC free article] [PubMed] [Google Scholar]
- 60.Soons J, Genbrugge A, Podos J, Adriaens D, Aerts P, Dirckx J, Herrel A. 2015. Is beak morphology in Darwin's finches tuned to loading demands? PLoS ONE 10, e0129479. ( 10.1371/journal.pone.0129479) [DOI] [PMC free article] [PubMed] [Google Scholar]
- 61.Wroe S, Clausen P, McHenry C, Moreno K, Cunningham E. 2007. Computer simulation of feeding behaviour in the thylacine and dingo as a novel test for convergence and niche overlap. Proc. R. Soc. B 274, 2819–2828. ( 10.1098/rspb.2007.0906) [DOI] [PMC free article] [PubMed] [Google Scholar]
- 62.Wroe S. 2008. Cranial mechanics compared in extinct marsupial and extant African lions using a finite-element approach. J. Zool. 274, 332–339. ( 10.1111/j.1469-7998.2007.00389.x) [DOI] [Google Scholar]
- 63.Hammer Ø, Harper DAT, Ryan PD. 2001. PAST: Paleontological Statistics Software Package for education and data analysis. Palaeontol. Electron. 4, 9. [Google Scholar]
- 64.MacLeod N. 1999. Generalizing and extending the eigenshape method of shape space visualization and analysis. Paleobiology 25, 107–138. [Google Scholar]
- 65.Figueirido B, Palmqvist P, Pérez-Claros JA. 2009. Ecomorphological correlates of craniodental variation in bears and paleobiological implications for extinct taxa: an approach based on geometric morphometrics. J. Zool. 277, 70–80. ( 10.1111/j.1469-7998.2008.00511.x) [DOI] [Google Scholar]
- 66.Sidlauskas B. 2008. Continuous and arrested morphological diversification in sister clades of Characiform fishes: a phylomorphospace approach. Evolution 62, 3135–3156. ( 10.1111/j.1558-5646.2008.00519.x) [DOI] [PubMed] [Google Scholar]
- 67.Maddison WP, Maddison DR. 2001. Mesquite: a modular system for evolutionary analysis. Version 2.75. See http://mesquiteproject.org.
- 68.Blomberg SP, Garland T Jr, Ives AR, Crespi B. 2003. Testing for phylogenetic signal in comparative data: behavioral traits are more labile. Evolution 57, 717–745. ( 10.1554/0014-3820(2003)057%5B0717:TFPSIC%5D2.0.CO;2) [DOI] [PubMed] [Google Scholar]
- 69.Kembel SW, Cowan PD, Helmus MR, Cornwell WK, Morlon H, Ackerly DD, Blomberg SP, Webb CO. 2010. Picante: R tools for integrating phylogenies and ecology. Bioinformatics 26, 1463–1464. ( 10.1093/bioinformatics/btq166) [DOI] [PubMed] [Google Scholar]
- 70.Dumont ER, Piccirillo J, Grosse IR. 2005. Finite-element analysis of biting behavior and bone stress in the facial skeletons of bats. Anat. Rec. A 283A, 319–330. ( 10.1002/ar.a.20165) [DOI] [PubMed] [Google Scholar]
- 71.Stocker GC, Irvine AK. 1983. Seed dispersal by cassowaries (Casuarius casuarius) in North Queensland's rainforests. Biotropica 15, 170–176. ( 10.2307/2387825) [DOI] [Google Scholar]
- 72.Westcott DA, Bentrupperbäumer J, Bradford MG, McKeown A. 2005. Incorporating patterns of disperser behaviour into models of seed dispersal and its effects on estimated dispersal curves. Oecologia 146, 57–67. ( 10.1007/s00442-005-0178-1) [DOI] [PubMed] [Google Scholar]
- 73.Herrel A, Podos J, Huber SK, Hendry AP. 2005. Bite performance and morphology in a population of Darwin's finches: implications for the evolution of beak shape. Funct. Ecol. 19, 43–48. ( 10.1111/j.0269-8463.2005.00923.x) [DOI] [Google Scholar]
- 74.Price T. 1987. Diet variation in a population of Darwin's finches. Ecology 68, 1015–1028. ( 10.2307/1938373) [DOI] [Google Scholar]
- 75.Thomson GM. 1922. The naturalisation of animals and plants in New Zealand. Cambridge, UK: Cambridge University Press. [Google Scholar]
- 76.Donne TE. 1924. The game animals of New Zealand: an account of their introduction, acclimatization, and development. London, UK: John Murray. [Google Scholar]
- 77.Forsyth DM, Wilmshurst JM, Allen RB, Coomes DA. 2010. Impacts of introduced deer and extinct moa on New Zealand ecosystems. NZ J. Ecol. 34, 48–65. [Google Scholar]
- 78.Caughley G. 1983. The deer wars: the story of deer in New Zealand. Auckland, New Zealand: Heinemann. [Google Scholar]
- 79.Moore LA. 2007. Population ecology of the southern cassowary Casuarius casuarius johnsonii, Mission Beach north Queensland. J. Ornithol. 148, 357–366. ( 10.1007/s10336-007-0137-1) [DOI] [Google Scholar]
- 80.Navarro JL, Martella MB. 2008. The relevance of captive breeding to conservation of native ratites in Argentina: an overview. Aust. J. Exp. Agric. 48, 1302–1307. ( 10.1071/EA08155) [DOI] [Google Scholar]
- 81.Caro T, Sherman P. 2009. Rewilding can cause rather than solve ecological problems. Nature 462, 985–985. ( 10.1038/462985b) [DOI] [PubMed] [Google Scholar]
Associated Data
This section collects any data citations, data availability statements, or supplementary materials included in this article.
Supplementary Materials
Data Availability Statement
Virtual 3D PDFs of all skulls based on surface meshes can be viewed for free using the most recent version of Adobe Reader, in addition to nastran files of the volume meshes. These files have been placed in the Dryad Digital Repository: http://dx.doi.org/10.5061/dryad.hf0rm.