

Abstract
The α-ketoglutarate metabolite, 2-hydroxyglutarate (2-HG), has emerged as an important mediator in a subset of cancers and rare inherited inborn errors of metabolism. Because of potential enantiospecific metabolism, chiral analysis is essential for determining the biochemical impacts of altered 2-HG metabolism. We have developed a novel application of chiral liquid chromatography–electron capture/atmospheric pressure chemical ionization/mass spectrometry, which allows for the quantification of both (R)-2-HG (D-2-HG) and (S)-2-HG (L-2-HG) in human cell lines. This method avoids the need for chiral derivatization, which could potentially distort enantiomer ratios through racemization during the derivatization process. The study revealed that the pesticide rotenone (100 nM), a mitochondrial complex I inhibitor, caused a significant almost 3-fold increase in the levels of (S)-2-HG, (91.7 ± 7.5 ng/106 cells) when compared with the levels of (R)-2-HG (24.1 ± 1.2 ng/106 cells) in the SH-SY5Y neuronal cells, a widely used model of human neurons. Stable isotope tracers and isotopologue analysis revealed that the increased (S)-2-HG was derived primarily from L-glutamine. Accumulation of highly toxic (S)-2-HG occurs in the brains of subjects with reduced L-2-HG dehydrogenase activity that results from mutations in the L2HGDH gene. This suggests that the observed stereospecific increase of (S)-2-HG in neuronal cells is due to rotenone-mediated inhibition of L-2-HG dehydrogenase but not D-2-HG dehydrogenase. The high sensitivity chiral analytical methodology that has been developed in the present study can also be employed for analyzing other disruptions to 2-HG formation and metabolism such as those resulting from mutations in the isocitrate dehydrogenase gene.
Graphical abstract
INTRODUCTION
Mitochondrial dysfunction is widely recognized as a causal factor in a range of diseases including cancer,1 cardiovascular disease,2 and neurodegeneration.3 The pathological link between mitochondria and disease states is likely a combination of oxidative stress and perturbations to central energy metabolism.4 Recent studies have demonstrated that altered cellular metabolism can be a driving force in disease pathogenesis as opposed to merely an adaptation.5 Cofactor dependence of enzymes, metabolic feedback inhibition, and metabolite-driven post-translational modifications are important physiological examples of how biochemical processes can be modulated through altered metabolite levels.6–8 Consequently, characterization of metabolic abnormalities in conjunction with mitochondrial dysfunction might implicate previously unidentified mechanisms in the pathogenesis of many diseases.
2-Hydroxyglutarate (HG) is closely linked with mitochondrial metabolism and the tricarboxylic acid (TCA) cycle (Figure 1), and its biosynthesis is susceptible to the effects of mitochondrial perturbations. For example, deficiencies in the mitochondrial citrate transporter result in (D/L)-2-HG aciduria.9 The pesticide rotenone is a known inhibitor of mitochondrial complex I, which induces a Parkinsonian phenotype in rodents.10 Furthermore, occupational exposure to rotenone is associated with the increased incidence of Parkinson’s disease in human populations.11 Recently identified metabolic defects that occur in response to rotenone implicate compensatory metabolic alterations mechanism that maintains bioenergetic homeostasis in times of impaired complex I activity. The resulting biochemical changes could account in part for the neurological defects resulting from rotenone exposure.12,13 Importantly, an increase in glutaminolysis into the TCA cycle suggested that 2-HG might be susceptible to changes in response to complex I inhibition (Figure 1).13 For this reason, we sought to identify the effects of rotenone on 2-HG metabolism.
Figure 1.
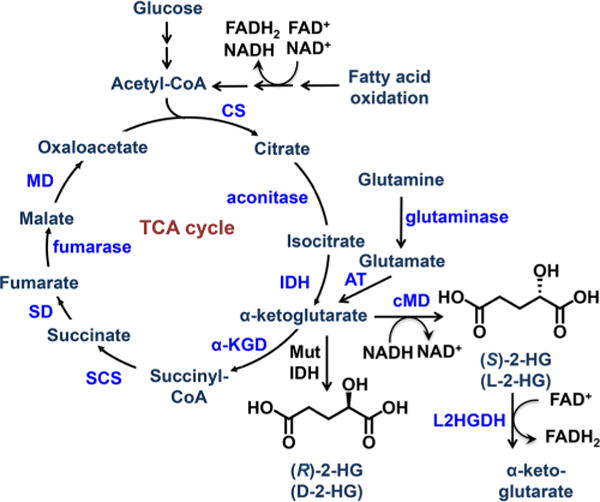
Schematic of the TCA cycle. Abbreviations: α-KGD, α-ketoglutarate dehydrogenase; AT, aspartate transaminase; CS, citrate synthase; L2HGDH, L-2-hydroxyglutarate dehydrogenase; MD, malate dehydrogenase; MutIDH, mutated isocitrate dehydrogenase; SCS, succinyl-CoA synthase; SD, succinate dehydrogenase.
Both enantiomers of 2-HG (Figure 1) have been linked to the induction of oxidative stress in animal models.14,15 Additionally, 2-HG has been identified as a biomarker in a subset of cancers with mutations in the gene coding for the metabolic enzyme, isocitrate dehydrogenase (IDH). In particular, cancers harboring IDH mutations exhibit large increases in the levels of (R)-2-HG (D-2-HG or D-α-HG).16–19 The oncogenic effects of (R)-2-HG are thought to arise through competitive inhibition of α-ketoglutarate dependent enzymes.20 For example, inhibition of α-ketoglutarate dependent dioxygenases and demethylases can lead to modified responses to hypoxia as well as epigenetic alterations due to hypermethylation of DNA.17 Conversely, (S)-2-HG (L-2-HG or L-α-HG) has more commonly been associated with the rare neurometabolic disorder of L-2-HG aciduria resulting from a defect in the L2HGDH gene, which encodes the enzyme L-2-HG dehydrogenase.21–24 These patients exhibit a severe neurodegenerative phenotype with hypertonia, tremors, and leukoencephalopathy, which increases their susceptibility to brain tumors.25,26 (S)-2-HG can also competitively inhibit α-ketoglutarate-dependent enzymes and in some cases is even more potent than the (R)-enantiomer.27
In view of the stereospecific biochemical effects of 2-HG, it is critical to have sensitive and specific chiral methodology available for the separation and quantification of the individual enantiomers. Liquid chromatography–selected reaction monitoring/mass spectrometry (LC-SRM/MS) serves as the gold standard for quantification of metabolites from complex biological matrices.28 However, robust quantification of low molecular weight, polar, chiral metabolites is often problematic due to poor retention with typical reversed phase LC-MS systems, ion suppression, interference from isobaric species, as well as poor ionization efficiency leading to inadequate sensitivity. We have employed chiral LC-electron capture atmospheric pressure chemical ionization (ECAPCI)/SRM/MS29,30 for the quantification of the 2-HG enantiomers in SH-SY5Y neuronal cells, a widely used model of human neurons.31 Analytes were first converted to bis-pentafluorobenzyl (PFB) ester derivatives in order to facilitate the ECAPCI process.29 Normal phase chiral chromatography, which provides excellent resolution of chiral lipids, was then used for the separation of the 2-HG-bis-PFB enantiomers.30
MATERIALS AND METHODS
Chemicals
Rotenone, L-[13C515N2]-glutamine, PFBBr, diisopropylethylamine (DIPEA), (R)-2-HG, (S)-2-HG, and dimethyl sulfoxide (DMSO) were purchased from Sigma-Aldrich (St. Louis, MO). [13C515N1]-glutamate was purchased from Cambridge Isotopes (Tewksbury, MA). Optima LC-MS grade methanol (MeOH), 2-propanol (IPA), hexanes, and water were purchased from Fisher Scientific (Pittsburgh, PA). DMEM:F12 media (with and without glutamine), fetal bovine serum (FBS), streptomycin, and penicillin were purchased from Invitrogen (Carlsbad, CA). SH-SY5Y cells were obtained from the laboratory of Dr. David Lynch at the Children’s Hospital of Philadelphia.
Cell Culture
SH-SY5Y cells were maintained in 1:1 DMEM/F12 media, supplemented with 10% fetal bovine serum, and 2 mM L-glutamine, penicillin, and streptomycin. Cells were incubated at 37 °C and 95% humidity with 5% CO2. Cells were treated with either freshly prepared rotenone in DMSO (100 nM final concentration) or 1% DMSO vehicle control when cells had reached approximately 80% confluence. For glutamine labeling experiments, cells were treated with glutamine-free media supplemented with 2 mM unlabeled or L-[13C515N2]-glutamine.
2-HG Extraction and Derivatization
Cells were lifted gently with a cell scraper, centrifuged at 500g for 5 min and resuspended in 750 μL/10 cm2 plate of ice cold methanol/water (4:1; v/v) containing 1 μg [13C515N1]-glutamate internal standard for extraction. Samples were pulse sonicated on ice for 30 s with a probe sonicator, followed by centrifugation at 16,000g for 10 min. The supernatant was then transferred to a clean tube and evaporated to dryness under nitrogen. Dried samples were derivatized with 100 μL of diisopropylethylamine (DIPEA) in acetonitrile (ACN, 1:99; v/v) and 50 μL of PFBBr in ACN (1:4; v/v) at 60 °C overnight. Derivatized samples were evaporated to dryness under nitrogen and resuspended in 100 μL of hexanes/ethanol (95:5; v/v) prior to LC-SRM/MS analysis.
Liquid Chromatography–Mass Spectrometry
Bis-PFB ester derivatives of the 2-HG enantiomers were separated using a Chiralpak AD-H column (250 × 4.6 mm i.d., 5 μm; Daicel Chemical Industries, Ltd., Tokyo, Japan) at a flow rate of 1 mL/min. Solvent A was hexanes, and solvent B was IPA/MeOH (1:1; v/v). The linear gradient was as follows: 1% B for 3 min, increased to 60% B over 32 min, and held for 4 min, down to 1% B over 1 min prior to a 5 min equilibration. The separation was performed at 30 °C, and a postcolumn addition (0.75 mL/min MeOH) was used. MS analysis was conducted on a Thermo Scientific TSQ Quantum Ultra AM mass spectrometer (Thermo Scientific, San Jose, CA, USA) equipped with an APCI source operating in negative mode. The TSQ Quantum operating conditions were as follows: vaporizer temperature, 350 °C; heated capillary temperature, 300 °C; and corona discharge needle, 30 μA. The sheath gas (nitrogen) and auxiliary gas (nitrogen) pressures were 35 and 10 (arbitrary units), respectively. Collision-induced dissociation used argon as the collision gas at 1.5 mTorr.
RESULTS
Chiral Analysis of 2-HG Derivatives by LC-ECAPCI/Tandem MS (MS/MS)
Overnight derivatization of 2-HG resulted in bis-PFB-2-HG, which after undergoing ECAPCI in the source of the mass spectrometer, yielded mono-PFB-2-HG (Figure 2) resulting from the typical loss of a PFB moiety from the molecule (M). Monoderivatized 2-HG was not observed (data not shown), indicating the derivatization went to completion under the reported conditions. LC-MS/MS analysis of the resulting [M-PFB]− parent ion (m/z = 327) yielded a product ion spectrum consistent with the structure of 2-HG (Figure 3). Furthermore, derivatization of (R)-2-HG and (S)-2-HG separately and in combination allowed specific separation of each bis-PFB-enantiomer to be conducted by normal-phase chiral LC-MS (Figure 4). Finally, LC-SRM/MS analysis utilizing [13C515N1]-glutamate as the internal standard yielded linear standard curves (Figure 5), which made it possible to conduct accurate and precise absolute quantification of both (R)- and (S)-2-HG by chiral LC-ECAPCI/MS (Figure 6). Furthermore, validation of the method revealed excellent accuracy and precision (Table 1), with a limit of detection of 3 pg on column and a limit of quantification of 10 pg on column for both (R)- and (S)-2-HG.
Figure 2.
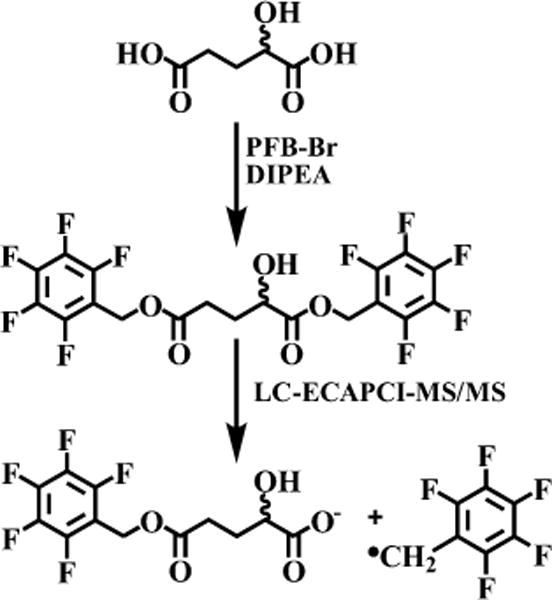
Formation of 2-HG-bis-PFB followed by LC-ECAPCI/MS/MS.
Figure 3.
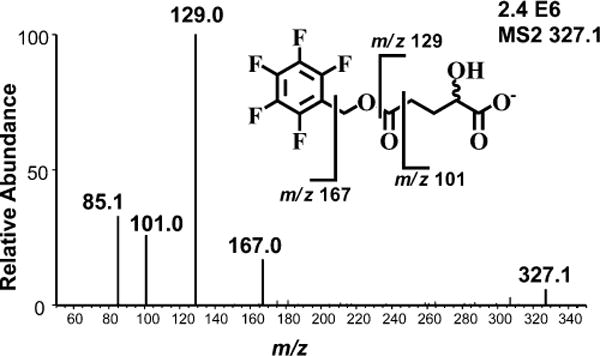
Product ions derived from LC-ECAPCI/MS/MS analysis of [M-PFB]− at m/z 327 derived from 2-HG-bis-PFB.
Figure 4.
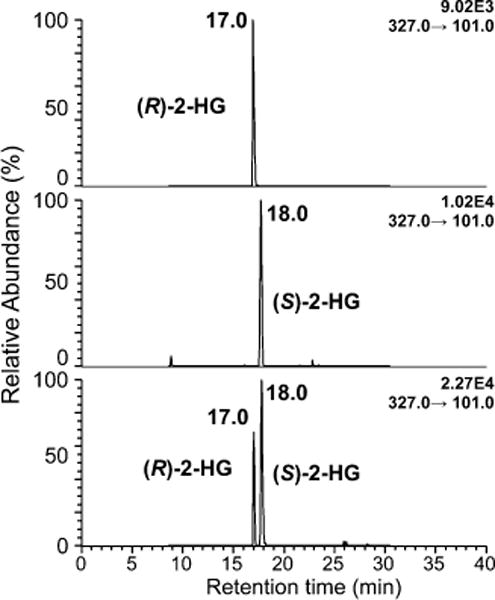
Chromatographic separation of (R)-2-HG from (S)-2-HG using normal-phase chiral LC-ECAPCI/MS.
Figure 5.
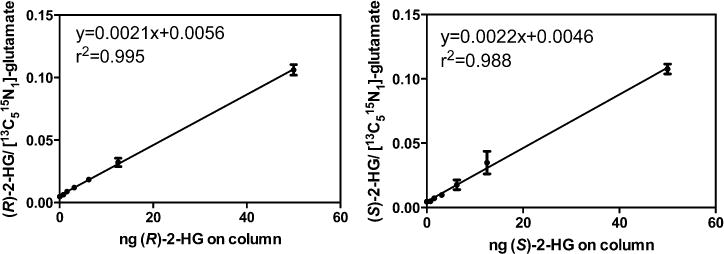
Calibration curves for (R)-2-HG and (S)-2-HG. (R)-2-HG: y = 0.0021x + 0.0056, r2 = 0.995. (S)-2-HG: y = 0.0022x + 0.0046, r2 = 0.988.
Figure 6.
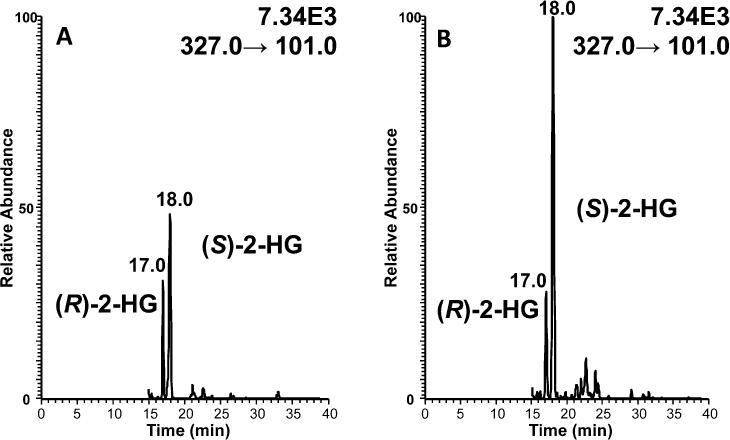
Separation of (R)-2-HG and (S)-2-HG from SH-SY5Y neuronal cells using normal-phase chiral LC-ECAPCI/MS. The cells were treated with (A) DMSO and (B) 100 nM rotenone.
Table 1.
Accuracy and Precision of 3-Day Validation Study
| QC sample | LLOQ | LQC | MQC | HQC |
|---|---|---|---|---|
| nominal amount (ng) | 0.40 | 5.0 | 20.0 | 40.0 |
| intraday mean found (ng; n = 5) | 0.38 | 4.8 | 20.0 | 40.1 |
| intraday CV (%; n = 5)) | 12.5 | 7.7 | 1.7 | 1.7 |
| intraday accuracy (%; n = 5) | 94.7 | 96.3 | 100.1 | 100.2 |
| interday mean found (ng; n = 15) | ND | 4.6 | 19.9 | 40.2 |
| interday mean (%, n = 15) | ND | 5.7 | 0.6 | 1.2 |
| interday accuracy (%; n = 15) | ND | 91.3 | 99.5 | 100.4 |
Rotenone-Mediated Stereoselective Increase in (S)-2-HG
To investigate the impact of rotenone on 2-HG metabolism, SH-SY5Y cells were treated with either 1, 10, 100 nM rotenone or vehicle DMSO for 6 h (Figure 6). Cellular metabolism was then quenched and analytes extracted and derivatized overnight prior to analysis. Absolute quantification revealed that (S)-2-HG levels rose significantly from 47.5 ± 11.7 ng/106 cells (mean ± SEM) in the vehicle control to 71.50 ± 7.5 ng/106 cells (p = 0.041) after treatment with 10 nM rotenone and to 91.7 ± 7.5 ng/106 cells (p = 0.008) after treatment with 100 nM rotenone (Figure 7). There was no increase in (S)-2-HG levels when cells were treated with only 1 nM rotenone (Figure 7). In contrast, there was no significant difference in the control level of (R)-2-HG (28.6 ± 4.0 ng/106 cells) when compared with the level of (R)-2-HG after rotenone treatment (24.1 ± 1.2 ng/106 cells, p = 0.128) at all three doses of rotenone. Therefore, rotenone induced a stereospecific increase in (S)-2-HG, while (R)-2-HG levels remained unaltered (Figure 7). The control level of (S)-2-HG was not statistically different (p = 0.096) from the control level of (R)-2-HG in the SH-SY5Y cells (Figure 7).
Figure 7.
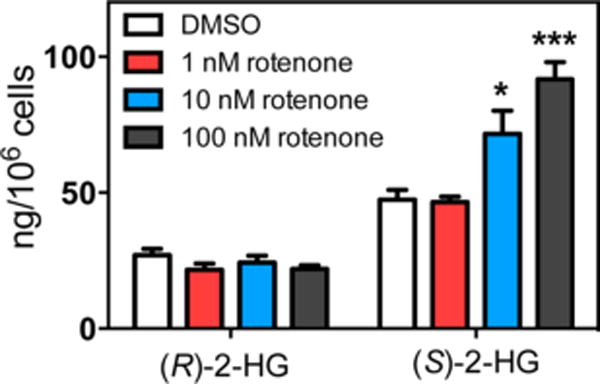
Rotenone induces stereospecific increases in (S)-2-HG. Student’s two-tailed t test against vehicle control: *p < 0.05, **p < 0.001 (n = 4). Rotenone induced a stereoselective increase in (S)-2-HG when compared with (R)-2-HG. SH-SY5Y cells were treated with 100 nM rotenone or vehicle (DMSO) for 6 h. Student’s two-tailed t test for (S)-2-HG against (R)-2-HG after rotenone treatment: **p = 0.0016 (n = 4).
Glutamine Supports (S)-2-HG Levels in Response to Rotenone
To assess the metabolic source of (S)-2-HG, the same experiment was performed for isotopologue analysis in cells treated in the presence of 2 mM L-[13C515N2]-glutamine. Glutamine can enter the TCA cycle via α-ketoglutarate, which can then be reduced to form either enantiomer of 2-HG (Figure 1). This direct conversion does not include any loss of carbon atoms and should therefore produce M + 5 labeled 2-HG as all 5 labeled carbons are derived from glutamine. Indeed, treatment with labeled L-glutamine yielded M + 5 labeled (S)-2-HG. Importantly, the M + 5 enrichment in (S)-2-HG was approximately doubled in the rotenone treated samples (Figure 8B). This finding suggests that the increase in (S)-2-HG is derived primarily from L-glutamine directly, as any oxidative metabolism through the TCA cycle would involve a decarboxylation of α-ketoglutarate to form succinyl-CoA (Figure 1) and would therefore no longer result in M + 5 labeled 2-HG. In agreement with the absolute quantification, L-glutamine labeling into (R)-2-HG was not significantly altered in response to 100 nM rotenone (Figure 8A).
Figure 8.
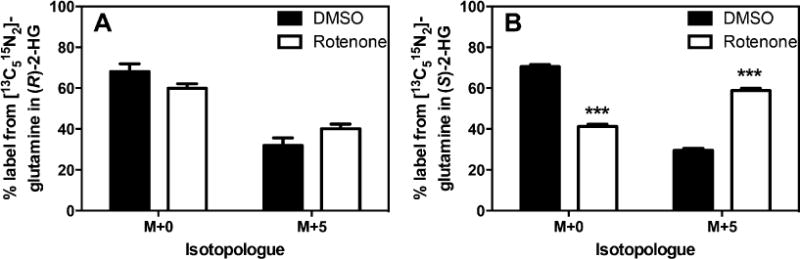
Glutamine contributes to increased (S)-2-HG production in response to rotenone. SH-SY5Y cells were grown in the presence of 2 mM L-[13C515N2]-glutamine and either 100 nM rotenone or vehicle DMSO for 6 h followed by isotopic enrichment analysis by LC-ECAPCI-MS/MS. Student’s two-tailed t test against vehicle control: ***p < 0.001 (n = 4).
DISCUSSION
A novel application of chiral LC-ECAPCI/SRM/MS was used to identify a stereospecific alteration in 2-HG levels in response to rotenone in SH-SY5Y cells. Inhibition of mitochondrial complex I results in a significant increase of (S)-2-HG while (R)-2-HG levels remain unchanged (Figure 7). Furthermore, utilizing stable isotope tracer methodology, we have shown that L-glutamine is an important metabolic source for the increased (S)-2-HG pool (Figure 8), though our results do not exclude the possibility of other precursors also serving a similar purpose. Given the known biochemical impacts of increased (S)-2-HG levels, the observed increase could have critical downstream consequences. Importantly, our findings bring light to the concept that therapeutics targeting mitochondrial metabolism may have unidentified impacts on 2-HG metabolism.
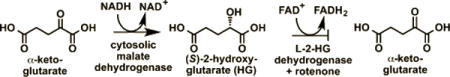
Rotenone causes increased utilization of both fatty acids and L-glutamine as a compensatory mechanism in response to decreased glycolytic production of acetyl-CoA.12,13 In addition to maintaining acetyl-CoA levels, a proposed mechanism for this shift includes the generation of NADH and FADH2 via β-oxidation of fatty acids to maintain complex II activity (Figure 1). The mitochondrial form of malate dehydrogenase converts malate to oxaloacetate. However, there is a cytosolic form, which is known to convert α-ketoglutarate into (S)-2-HG using NADH as a cofactor (Figure 1).32 In the presence of rotenone, this could potentially lead to increased (S)-2-HG as a result of the increased NADH cofactor availability from increased fatty acid β-oxidation (Figure 1). Normally, the (S)-2-HG would be reduced back to α-ketoglutarate by L-2-HG dehydrogenase. Therefore, the observed increase in (S)-2-HG most likely arose through a rotenone-dependent inhibition of L-2-HG dehydrogenase. This would result in a phenotype similar to that observed in (S)-2-HG aciduria, in which there is also an accumulation of (S)-2-HG. In contrast, (R)-2-HG is formed primarily from mutated IDH (in an NADPH-dependent process), and a separate dehydrogenase exists for the oxidation of (R)-2-HG to α-ketoglutarate.33,34 Consequently, the lack of any effect of rotenone on (R)-2-HG levels is in keeping with our proposed mechanism for increased (S)-2-HG in the neuronal cells. This proposal is supported by the observation that glutamine is an important metabolic source of the increased (S)-2-HG (Figure 8B). The formation of (S)-2-HG would occur through glutaminase-mediated formation of glutamate followed by the action of glutamate dehydrogenase to give α-ketoglutarate followed by NADH-dependent cytosolic malate dehydrogenase-mediated reduction of α-ketoglutarate into (S)-2-HG (Figure 1).
(S)-2-HG and (R)-2-HG have both been linked to the control of the methylation status of DNA as well as histone proteins. The two enantiomers inhibit α-ketoglutarate-dependent enzymes including the 10–11 translocation (TET)1 and TET2 5-methylcytosine hydroxylases, HIF asparaginyl hydroxylase FIH-1, and the lysine-specific demethylase (KSDM) 4D (JMJD2D), a histone demethylase.27,35 (S)-2-HG was found to be a more potent enzyme inhibitor,27 although aspects of this finding remain controversial. In contrast, the activity of the 2-HG enantiomers on egg-laying defective nine (EGLN) prolyl hydroxylases is quite distinct. (R)-2-HG is an activator of EGLN1, EGLN2, and EGLN3 causing depletion of HIF1α; whereas (S)-2-HG is an inhibitor.35 Furthermore, increased production of (R)-2-HG by tumor derived mutant IDH1 R132H,16,36 coupled with concomitant depletion of α-ketoglutarate, is associated with the promotion of leukemogenesis.19 It is noteworthy that there is evidence to suggest that HIF activation inhibits myeloid leukemia suggesting that depletion of HIF1α would be pro-leukemogenic.19 The function of (S)-2-HG is less clear, although elevated levels of (S)-2-HG have been reported in renal cancer,37 where unlike leukemia, HIF activation supports tumorigenesis.38 In addition, the severe neurologic phenotype of (S)-2-HG aciduria suggests that altered brain physiology is an important pathological consequence resulting from elevated levels of (S)-2-HG.25 This is in keeping with the role of disrupted methylation during neurodevelopment that occurs in genetic disorders such as Rett’s syndrome, where there is a mutation in the methyl CpG binding protein (MECP)2 gene.39 Elevated levels of (S)-2-HG can also increase susceptibility to brain tumors.40
The sensitivity and chiral separation offered by this new chiral LC-ECAPCI/MS method will be useful in the discovery and validation of biomarkers for 2-HG aciduria, mitochondrial dysfunction, and IDH-mutation related cancers. Partial loss of differentiation block against erythropoietin in late passage leukemia cells transiently transfected with mutant IDH1 was dose-dependent on (R)-2-HG, which suggests that prognostic monitoring of (R)-2-HG might be informative in this setting.19 2-HG is a normal constituent of human urine;41 thus, noninvasive screening of 2-HG enantiomers should be feasible. There are previous reports on the analysis of 2-HG by chiral derivatization and GC-MS analysis.42–44 In addition, Rashed et al. reported chiral analysis of 2-HG by LC-MS without derivatization,45 which was used to confirm the diagnosis of (S)-2-HG aciduria using urine from a small number of patients. Gross et al. described the accumulation of 2-HG in acute myeloid leukemia carrying IDH1/2 mutations without chiral analysis,46 and Wang et al. have investigated the increase of 2-HG in AML but also failed to resolve (R)- and (S)-2-HG.47,48 Fan et al. recently reported chiral analysis of 2-HG derivatization with (R)-butanol coupled with achiral LC-MS,49 and Struys et al. have reported a sensitive chiral derivatization method also coupled with achiral LC-MS.50 However, there is always a concern that racemization at the chiral center and/or enantioselective derivatization can occur during these chemical reactions,51 which would artifactually distort the enantiomer ratios. Such potential artifacts cannot arise from the LC-ECAPCI/MS method because derivatization does not occur at the chiral center, but rather on the two carboxylate moieties; the derivatization is used simply to facilitate electron capture and increase sensitivity. Although the product ion at m/z = 129 was the most intense signal observed during MS/MS analysis (Figure 3), the background for the m/z = 101 channel was lower when subsequent LC-SRM/MS analyses were conducted. Therefore, this product ion was chosen for the quantitative LC-SRM/MS analyses, and collision energies were reoptimized to ensure maximum sensitivity (Figure 6). Base-line separation of the 2-HG-bis-PFB enantiomers was readily achieved using a normal-phase chiral LC column (Figure 4).30 It is noteworthy that the synthesis of [13C]-(R)-2-HG has been reported.35 This means that [13C]-(R/S)-2-HG analogues could be used as internal standards in the future, rather than the [13C515N1]-glutamate internal standard used in the present assay, which could further improve the precision, accuracy, sensitivity, and specificity of the LC-ECAPCI/MS method.28
In summary, a novel application of chiral LC-ECAPCI/SRM/MS, which allows for the quantification of both (R)-2-HG and (S)-2-HG has been developed. Use of this methodology revealed that rotenone induced a stereospecific increase in (S)-2-HG in the SH-SY5Y neuronal cell line. This suggests that in addition to mutated enzymes, pharmacological modulation of mitochondrial metabolism can have unexpected impacts on 2-HG metabolism. The increased (S)-2-HG observed in the SH-SY5Y neuronal cells is most likely to occur through a rotenone-mediated decrease in the activity of L-2-HG dehydrogenase, which results in a phenotype similar to that observed in patients with mutations in the L2HGDH gene. Current efforts are underway to obtain models with known disruptions of 2-HG metabolism such as mutations in IDH in an attempt to further characterize and potentially modulate these systems.
Acknowledgments
Funding
This work was supported by National Institutes of Health grants P30ES013508 and T32ES019851.
ABBREVIATIONS
- ACN
acetonitrile
- DIPEA
diisopropylethylamine
- ECAPCI
electron capture atmospheric pressure chemical ionization
- HG
hydroxyglutarate
- IDH
isocitrate dehydrogenase
- IPA
isopropanol
- KSDM
lysine-specific demethylase
- LC
liquid chromatography
- M
molecule
- MECP
methyl CpG binding protein
- MeOH
methanol
- PFB
pentafluorobenzyl
- MS
mass spectrometry
- MS/MS
tandem MS
- SRM
selected reaction monitoring
- TCA
tricarboxylic acid
- TET
ten–eleven translocation
Footnotes
Notes
The authors declare no competing financial interest.
References
- 1.Boland ML, Chourasia AH, Macleod KF. Mitochondrial dysfunction in cancer. Front Oncol. 2013;3:1–28. doi: 10.3389/fonc.2013.00292. [DOI] [PMC free article] [PubMed] [Google Scholar]
- 2.Ballinger SW. Mitochondrial dysfunction in cardiovascular disease. Free Radical Biol Med. 2005;38:1278–1295. doi: 10.1016/j.freeradbiomed.2005.02.014. [DOI] [PubMed] [Google Scholar]
- 3.Beal MF. Energetics in the pathogenesis of neurodegenerative diseases. Trends Neurosci. 2000;23:298–304. doi: 10.1016/s0166-2236(00)01584-8. [DOI] [PubMed] [Google Scholar]
- 4.Yin F, Boveris A, Cadenas E. Mitochondrial energy metabolism and redox signaling in brain aging and neurodegeneration. Antioxid Redox Signaling. 2014;20:353–371. doi: 10.1089/ars.2012.4774. [DOI] [PMC free article] [PubMed] [Google Scholar]
- 5.Ward PS, Thompson CB. Metabolic reprogramming: a cancer hallmark even Warburg did not anticipate. Cancer Cell. 2012;21:297–308. doi: 10.1016/j.ccr.2012.02.014. [DOI] [PMC free article] [PubMed] [Google Scholar]
- 6.Goldstein JL, Brown MS. Regulation of the mevalonate pathway. Nature. 1990;343:425–430. doi: 10.1038/343425a0. [DOI] [PubMed] [Google Scholar]
- 7.Hallows WC, Lee S, Denu JM. Sirtuins deacetylate and activate mammalian acetyl-CoA synthetases. Proc Natl Acad Sci USA. 2006;103:10230–10235. doi: 10.1073/pnas.0604392103. [DOI] [PMC free article] [PubMed] [Google Scholar]
- 8.Lee JV, Carrer A, Shah S, Snyder NW, Wei S, Venneti S, Worth AJ, Yuan ZF, Lim HW, Liu S, Jackson E, Aiello NM, Haas NB, Rebbeck TR, Judkins A, Won KJ, Chodosh LA, Garcia BA, Stanger BZ, Feldman MD, Blair IA, Wellen KE. Akt-dependent metabolic reprogramming regulates tumor cell histone acetylation. Cell Metab. 2014;20:306–319. doi: 10.1016/j.cmet.2014.06.004. [DOI] [PMC free article] [PubMed] [Google Scholar]
- 9.Nota B, Struys EA, Pop A, Jansen EE, Fernandez Ojeda MR, Kanhai WA, Kranendijk M, van Dooren SJ, Bevova MR, Sistermans EA. Deficiency in SLC25A1, encoding the mitochondrial citrate carrier, causes combined D-2-and L-2-hydroxyglutaric aciduria. Am J Hum Genet. 2013;92:627–631. doi: 10.1016/j.ajhg.2013.03.009. [DOI] [PMC free article] [PubMed] [Google Scholar]
- 10.Cannon JR, Tapias V, Na HM, Honick AS, Drolet RE, Greenamyre JT. A highly reproducible rotenone model of Parkinson’s disease. Neurobiol Dis. 2009;34:279–290. doi: 10.1016/j.nbd.2009.01.016. [DOI] [PMC free article] [PubMed] [Google Scholar]
- 11.Tanner CM, Kamel F, Ross GW, Hoppin JA, Goldman SM, Korell M, Marras C, Bhudhikanok GS, Kasten M, Chade AR, Comyns K, Richards MB, Meng C, Priestley B, Fernandez HH, Cambi F, Umbach DM, Blair A, Sandler DP, Langston JW. Rotenone, paraquat, and Parkinson’s disease. Environ Health Perspect. 2011;119:866–872. doi: 10.1289/ehp.1002839. [DOI] [PMC free article] [PubMed] [Google Scholar]
- 12.Basu SS, Blair IA. Rotenone-mediated changes in intracellular coenzyme A thioester levels: implications for mitochondrial dysfunction. Chem Res Toxicol. 2011;24:1630–1632. doi: 10.1021/tx200366j. [DOI] [PMC free article] [PubMed] [Google Scholar]
- 13.Worth AJ, Basu SS, Snyder NW, Mesaros C, Blair IA. Inhibition of neuronal cell mitochondrial complex I with rotenone increases lipid β-oxidation, supporting acetyl-coenzyme A levels. J Biol Chem. 2014;289:26895–26903. doi: 10.1074/jbc.M114.591354. [DOI] [PMC free article] [PubMed] [Google Scholar]
- 14.Latini A, Scussiato K, Borba Rosa R, Leipnitz G, Llesuy S, Belló-Klein A, Dutra-Filho CS, Wajner M. Induction of oxidative stress by L-2-hydroxyglutaric acid in rat brain. J Neurosci Res. 2003;74:103–110. doi: 10.1002/jnr.10735. [DOI] [PubMed] [Google Scholar]
- 15.Latini A, Scussiato K, Rosa RB, Llesuy S, Bello-Klein A, Dutra-Filho CS, Wajner M. D-2-hydroxyglutaric acid induces oxidative stress in cerebral cortex of young rats. Eur J Neurosci. 2003;17:2017–2022. doi: 10.1046/j.1460-9568.2003.02639.x. [DOI] [PubMed] [Google Scholar]
- 16.Dang L, White DW, Gross S, Bennett BD, Bittinger MA, Driggers EM, Fantin VR, Jang HG, Jin S, Keenan MC, Marks KM, Prins RM, Ward PS, Yen KE, Liau LM, Rabinowitz JD, Cantley LC, Thompson CB, Vander Heiden MG, Su SM. Cancer-associated IDH1 mutations produce 2-hydroxyglutarate. Nature. 2009;462:739–744. doi: 10.1038/nature08617. [DOI] [PMC free article] [PubMed] [Google Scholar]
- 17.Figueroa ME, Abdel-Wahab O, Lu C, Ward PS, Patel J, Shih A, Li Y, Bhagwat N, Vasanthakumar A, Fernandez HF. Leukemic IDH1 and IDH2 mutations result in a hypermethylation phenotype, disrupt TET2 function, and impair hematopoietic differentiation. Cancer Cell. 2010;18:553–567. doi: 10.1016/j.ccr.2010.11.015. [DOI] [PMC free article] [PubMed] [Google Scholar]
- 18.Ward PS, Patel J, Wise DR, Abdel-Wahab O, Bennett BD, Coller HA, Cross JR, Fantin VR, Hedvat CV, Perl AE. The common feature of leukemia-associated IDH1 and IDH2 mutations is a neomorphic enzyme activity converting alpha ketoglutarate to 2-hydroxyglutarate. Cancer Cell. 2010;17:225–234. doi: 10.1016/j.ccr.2010.01.020. [DOI] [PMC free article] [PubMed] [Google Scholar]
- 19.Losman JA, Looper RE, Koivunen P, Lee S, Schneider RK, McMahon C, Cowley GS, Root DE, Ebert BL, Kaelin WG., Jr (R)-2-hydroxyglutarate is sufficient to promote leukemogenesis and its effects are reversible. Science. 2013;339:1621–1625. doi: 10.1126/science.1231677. [DOI] [PMC free article] [PubMed] [Google Scholar]
- 20.Yang H, Ye D, Guan KL, Xiong Y. IDH1 and IDH2 mutations in tumorigenesis: mechanistic insights and clinical perspectives. Clin Cancer Res. 2012;18:5562–5571. doi: 10.1158/1078-0432.CCR-12-1773. [DOI] [PMC free article] [PubMed] [Google Scholar]
- 21.Barbot C, Fineza I, Diogo L, Maria M, Melo J, Melo Pires M, Luis Cardoso M. L-2-Hydroxyglutaric aciduria: clinical, biochemical and magnetic resonance imaging in six Portuguese pediatric patients. Brain Dev. 1997;19:268–273. doi: 10.1016/s0387-7604(97)00574-3. [DOI] [PubMed] [Google Scholar]
- 22.Chen E, Nyhan WL, Jakobs C, Greco CM, Barkovich AJ, Cox VA, Packman S. L-2-Hydroxyglutaric aciduria: neuropathological correlations and first report of severe neurodegenerative disease and neonatal death. J Inherited Metab Dis. 1996;19:335–343. doi: 10.1007/BF01799264. [DOI] [PubMed] [Google Scholar]
- 23.Moroni I, D’Incerti L, Farina L, Rimoldi M, Uziel G. Clinical, biochemical and neuroradiological findings in L-2-hydroxyglutaric aciduria. Neurol Sci. 2000;21:103–108. doi: 10.1007/s100720070104. [DOI] [PubMed] [Google Scholar]
- 24.Patay Z, Mills JC, Lobel U, Lambert A, Sablauer A, Ellison DW. Cerebral neoplasms in L-2 hydroxyglutaric aciduria: 3 new cases and meta-analysis of literature data. Am J Neuroradiol. 2012;33:940–943. doi: 10.3174/ajnr.A2869. [DOI] [PMC free article] [PubMed] [Google Scholar]
- 25.Van Schaftingen E, Rzem R, Veiga-da-Cunha M. L: −2-Hydroxyglutaric aciduria, a disorder of metabolite repair. J Inherited Metab Dis. 2009;32:135–142. doi: 10.1007/s10545-008-1042-3. [DOI] [PubMed] [Google Scholar]
- 26.Wagner S, Vianey-Saban C, Salomons GS, Schmitt E, Feillet F. L-2-hydroxyglutaric aciduria: report on two cases. Arch Pediatr. 2014;21:78–85. doi: 10.1016/j.arcped.2013.10.017. [DOI] [PubMed] [Google Scholar]
- 27.Xu W, Yang H, Liu Y, Yang Y, Wang P, Kim SH, Ito S, Yang C, Wang P, Xiao MT, Liu LX, Jiang WQ, Liu J, Zhang JY, Wang B, Frye S, Zhang Y, Xu YH, Lei QY, Guan KL, Zhao SM, Xiong Y. Oncometabolite 2-hydroxyglutarate is a competitive inhibitor of alpha-ketoglutarate-dependent dioxygenases. Cancer Cell. 2011;19:17–30. doi: 10.1016/j.ccr.2010.12.014. [DOI] [PMC free article] [PubMed] [Google Scholar]
- 28.Ciccimaro E, Blair IA. Stable-isotope dilution LC–MS for quantitative biomarker analysis. Bioanalysis. 2010;2:311–341. doi: 10.4155/bio.09.185. [DOI] [PMC free article] [PubMed] [Google Scholar]
- 29.Singh G, Gutierrez A, Xu K, Blair IA. Liquid chromatography/electron capture atmospheric pressure chemical ionization/mass spectrometry: analysis of pentafluorobenzyl derivatives of biomolecules and drugs in the attomole range. Anal Chem. 2000;72:3007–3013. doi: 10.1021/ac000374a. [DOI] [PubMed] [Google Scholar]
- 30.Lee SH, Williams MV, DuBois RN, Blair IA. Targeted lipidomics using electron capture atmospheric pressure chemical ionization mass spectrometry. Rapid Commun Mass Spectrom. 2003;17:2168–2176. doi: 10.1002/rcm.1170. [DOI] [PubMed] [Google Scholar]
- 31.Pahlman S, Mamaeva S, Meyerson G, Mattsson ME, Bjelfman C, Ortoft E, Hammerling U. Human neuroblastoma cells in culture: a model for neuronal cell differentiation and function. Acta Physiol Scand Suppl. 1990;592:25–37. [PubMed] [Google Scholar]
- 32.Rzem R, Vincent MF, Van SE, Veiga-da-Cunha M. L-2-hydroxyglutaric aciduria, a defect of metabolite repair. J Inherited Metab Dis. 2007;30:681–689. doi: 10.1007/s10545-007-0487-0. [DOI] [PubMed] [Google Scholar]
- 33.Rzem R, Veiga-da-Cunha M, Noël G, Goffette S, Nassogne MC, Tabarki B, Schöller C, Marquardt T, Vikkula M, Van Schaftingen E. A gene encoding a putative FAD-dependent L-2-hydroxyglutarate dehydrogenase is mutated in L-2-hydroxyglutaric aciduria. Proc Natl Acad Sci USA. 2004;101:16849–16854. doi: 10.1073/pnas.0404840101. [DOI] [PMC free article] [PubMed] [Google Scholar]
- 34.Achouri Y, Noel G, Vertommen D, Rider M, Veiga-da-Cunha M, Van Schaftingen E. Identification of a dehydrogenase acting on D-2-hydroxyglutarate. Biochem J. 2004;381:35–42. doi: 10.1042/BJ20031933. [DOI] [PMC free article] [PubMed] [Google Scholar]
- 35.Koivunen P, Lee S, Duncan CG, Lopez G, Lu G, Ramkissoon S, Losman JA, Joensuu P, Bergmann U, Gross S, Travins J, Weiss S, Looper R, Ligon KL, Verhaak RGW, Yan H, Kaelin WG., Jr Transformation by the (R)-enantiomer of 2-hydroxyglutarate linked to EGLN activation. Nature. 2012;483:484–488. doi: 10.1038/nature10898. [DOI] [PMC free article] [PubMed] [Google Scholar]
- 36.Jin G, Reitman ZJ, Spasojevic I, Batinic-Haberle I, Yang J, Schmidt-Kittler O, Bigner DD, Yan H. 2-hydroxyglutarate production, but not dominant negative function, is conferred by glioma-derived NADP-dependent isocitrate dehydrogenase mutations. PLoS One. 2011;6:e16812. doi: 10.1371/journal.pone.0016812. [DOI] [PMC free article] [PubMed] [Google Scholar]
- 37.Shim EH, Livi CB, Rakheja D, Tan J, Benson D, Parekh V, Kho EY, Ghosh AP, Kirkman R, Velu S, Dutta S, Chenna B, Rea SL, Mishur RJ, Li Q, Johnson-Pais TL, Guo L, Bae S, Wei S, Block K, Sudarshan S. L-2-hydroxyglutarate: an epigenetic modifier and putative oncometabolite in renal cancer. Cancer Discovery. 2014;4:1290–1298. doi: 10.1158/2159-8290.CD-13-0696. [DOI] [PMC free article] [PubMed] [Google Scholar]
- 38.Haase VH. Renal cancer: oxygen meets metabolism. Exp Cell Res. 2012;318:1057–1067. doi: 10.1016/j.yexcr.2012.02.026. [DOI] [PMC free article] [PubMed] [Google Scholar]
- 39.Kriaucionis S, Bird A. DNA methylation and Rett syndrome. Hum Mol Genet. 2003;12(Suppl. 2):R221–R227. doi: 10.1093/hmg/ddg286. [DOI] [PubMed] [Google Scholar]
- 40.Haliloglu G, Jobard F, Oguz KK, Anlar B, Akalan N, Coskun T, Sass JO, Fischer J, Topcu M. L-2-Hydroxyglutaric aciduria and brain tumors in children with mutations in the L2HGDH gene: neuroimaging findings. Neuropediatrics. 2008;39:119–122. doi: 10.1055/s-2008-1081217. [DOI] [PubMed] [Google Scholar]
- 41.Kranendijk M, Struys EA, Salomons GS, Van der Knaap MS, Jakobs C. Progress in understanding 2-hydroxyglutaric acidurias. J Inherited Metab Dis. 2012;35:571–587. doi: 10.1007/s10545-012-9462-5. [DOI] [PMC free article] [PubMed] [Google Scholar]
- 42.das Neves HJC, Noronha JP, Rufino H. A new method for the chiral HRGC assay of L–2–hydroxyglutaric acid in urine. J High Resolut Chromatogr. 1996;19:161–164. [Google Scholar]
- 43.Gibson KM, Ten Brink HJ, Schor DS, Kok RM, Bootsma AH, Hoffmann GF, Jakobs C. Stable-isotope dilution analysis of D- and L-2-hydroxyglutaric acid: application to the detection and prenatal diagnosis of D- and L-2-hydroxyglutaric acidemias. Pediatr Res. 1993;34:277–280. doi: 10.1203/00006450-199309000-00007. [DOI] [PubMed] [Google Scholar]
- 44.Kim KR, Lee J, Ha D, Jeon J, Park HG, Kim JH. Enantiomeric separation and discrimination of 2-hydroxy acids as O-trifluoroacetylated (S)-(+)-3-methyl-2-butyl esters by achiral dual-capillary column gas chromatography. J Chromatogr A. 2000;874:91–100. doi: 10.1016/s0021-9673(00)00072-8. [DOI] [PubMed] [Google Scholar]
- 45.Rashed MS, AlAmoudi M, Aboul-Enein HY. Chiral liquid chromatography tandem mass spectrometry in the determination of the configuration of 2-hydroxyglutaric acid in urine. Biomed Chromatogr. 2000;14:317–320. doi: 10.1002/1099-0801(200008)14:5<317::AID-BMC989>3.0.CO;2-V. [DOI] [PubMed] [Google Scholar]
- 46.Gross S, Cairns RA, Minden MD, Driggers EM, Bittinger MA, Jang HG, Sasaki M, Jin S, Schenkein DP, Su SM, Dang L, Fantin VR, Mak TW. Cancer-associated metabolite 2-hydroxyglutarate accumulates in acute myelogenous leukemia with isocitrate dehydrogenase 1 and 2 mutations. J Exp Med. 2010;207:339–344. doi: 10.1084/jem.20092506. [DOI] [PMC free article] [PubMed] [Google Scholar]
- 47.Struys EA. 2-Hydroxyglutarate is not a metabolite; d-2-hydroxyglutarate and l-2-hydroxyglutarate are! Proc Natl Acad Sci USA. 2013;110:E4939. doi: 10.1073/pnas.1318777110. [DOI] [PMC free article] [PubMed] [Google Scholar]
- 48.Wang JH, Chen WL, Li JM, Wu SF, Chen TL, Zhu YM, Zhang WN, Li Y, Qiu YP, Zhao AH, Mi JQ, Jin J, Wang YG, Ma QL, Huang H, Wu DP, Wang QR, Li Y, Yan XJ, Yan JS, Li JY, Wang S, Huang XJ, Wang BS, Jia W, Shen Y, Chen Z, Chen SJ. Prognostic significance of 2-hydroxyglutarate levels in acute myeloid leukemia in China. Proc Natl Acad Sci USA. 2013;110:17017–17022. doi: 10.1073/pnas.1315558110. [DOI] [PMC free article] [PubMed] [Google Scholar]
- 49.Fan J, Teng X, Liu L, Mattaini KR, Looper RE, Vander Heiden MG, Rabinowitz JD. Human Phosphoglycerate dehydrogenase produces the oncometabolite d-2-hydroxyglutarate. ACS Chem Biol. 2014;10:510–516. doi: 10.1021/cb500683c. [DOI] [PMC free article] [PubMed] [Google Scholar]
- 50.Struys EA, Jansen EE, Verhoeven NM, Jakobs C. Measurement of urinary D-and L-2-hydroxyglutarate enantiomers by stable-isotope-dilution liquid chromatography–tandem mass spectrometry after derivatization with diacetyl-L-tartaric anhydride. Clin Chem. 2004;50:1391–1395. doi: 10.1373/clinchem.2004.033399. [DOI] [PubMed] [Google Scholar]
- 51.Gubitz G, Schmid MG. Chiral separation by chromatographic and electromigration techniques. A review Biopharm Drug Dispos. 2001;22:291–336. doi: 10.1002/bdd.279. [DOI] [PubMed] [Google Scholar]