Abstract
Plasmonic nanoparticle research has become increasingly active due to their potential uses in biomedical applications. However, little is known about the intracellular effects these nanoparticles have on mammalian cells. The aim of this work is to investigate whether silver nanoparticles (AgNPs) conjugated with nuclear and cytoplasmic targeting peptides exhibit the same intracellular effects on cancer cells as peptide-conjugated gold nanoparticles (AuNPs). Nuclear and cytoplasmic targeting spherical AgNPs with a diameter of 35 nm were incubated in a cancer (HSC-3) and healthy (HaCat) cell line. By utilizing flow cytometry, confocal microscopy, and real-time dark field imaging, we were able to analyze how targeting AgNPs affect the cell cycle and cell division. These experiments demonstrated that nuclear-targeting AgNPs cause DNA double strand breaks and a subsequent increase in the sub G1 (apoptotic) population in our cancer cell model at much lower concentrations than previously reported for nuclear targeting AuNPs. Unlike the M phase accumulation seen in cancer cells treated with AuNPs, an accumulation in the G2 phase of the cell cycle was observed in both cell models when treated with AgNPs. Additionally real-time dark field imaging showed that cancer cells treated with nuclear targeting AgNPs did not undergo cell division and ultimately underwent programmed cell death. A possible explanation of the observed results is discussed in terms of the chemical properties of the nanoparticles.
INTRODUCTION
Plasmonic nanoparticles (NPs) have been heavily studied due to their small size and unique optical and photo-thermal properties.(1, 2) Their nanometer size allows NPs to permeate the cellular membrane and interact with biomolecules inside the cell, which can lead to disruption of cellular functions.(3–6) Cancer cells, which overexpress a certain ligand receptor, have the ability to be selectively targeted by NPs that have undergone surface conjugations to the respective receptor’s complementary ligand.(7–9) Conjugated NPs also have the ability to intracellularly target specific organelles and/or locations within the cell.(8, 10–14) A heavily targeted organelle within the cell is the nucleus. The nucleus houses the cell’s genetic material and is responsible for maintaining proper cellular activities.(15) Any alteration to the nucleus and its genetic material could result in improper regulation of the cell cycle and cell death. The nucleus is most commonly targeted through the conjugation of a nuclear localizing signal (NLS) to the surface of the NPs.(8, 12–14) This signal is known to interact with cytosolic factors forming stable complexes that are docked at the nuclear pore complex (NPC) in the nuclear membrane.(8) Our group’s recent work has provided evidence that nuclear targeting of gold nanoparticles (AuNPs) in cancer (HSC-3) cells results in DNA damage, cytokinesis (M phase) arrest, and ultimately cell death.(14) Although this work demonstrates the alteration of the cell cycle in the presence of nuclear targeting AuNPs, it is still unknown if different nuclear targeting metallic nanoparticles, such as silver nanoparticles (AgNPs), will exhibit the same effect.
AgNPs have been extensively used in antimicrobial applications(16, 17) but little is known about the behavior and resulting cellular response when they are targeted to different organelles of mammalian cells. AgNPs are known for their active generation of reactive oxygen species (ROS).(18, 19) ROS are a major source of oxidative stress within a cell and can cause damage to several cellular components. Disruption to DNA replication and ribosomal subunit protein expression after introduction of AgNPs into cells has been reported.(18) This disruption was attributed to the Ag+ release from the surface oxidation of the AgNPs after they have been introduced into culture media and internalized in the cells. The resulting induction of DNA damage and subsequent cell death has potential applications in cancer and disease therapeutics.
In the present work, we systematically studied the cell cycle and cell division of cancer and healthy human cells in the presence of 35 nm pegylated and peptide-conjugated AgNPs. The results suggest that AgNPs localized at the nucleus cause DNA double-strand breaks and an increase in the sub G1 (apoptotic) population in the cancer cell model. G2 accumulation was also seen in both cancer and healthy cells lines. The ROS generation from AgNPs is considered the main cause of the cell cycle alteration.
EXPERIMENTAL SECTION
AgNP Synthesis
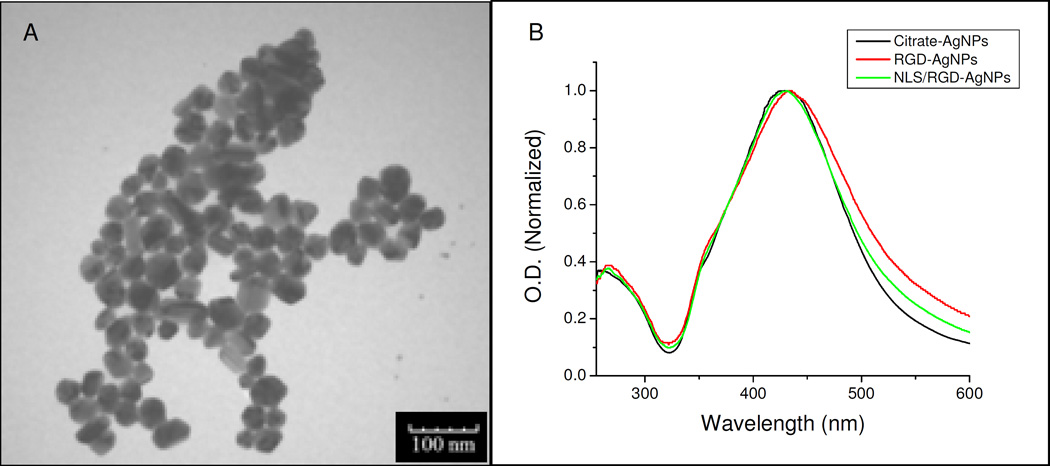
Citrate stabilized AgNPs with an average diameter of 35 nm were synthesized by the reduction of silver ions (AgNO3) with sodium citrate.(20) Briefly, a 100 mL solution of 0.2 mM AgNO3 and 0.3 mM trisodium citrate was brought to a boil under continuous stirring. After 30 minutes, boiling and stirring were discontinued and the solution was cooled to room temperature. TEM and DLS analysis showed an average particle diameter of 35 nm (Figure 1 and Table 1). The surface plasmon resonance band showed a peak absorbance at 430 nm (Figure 1). TEM images were taken on a JEOL 100CX-2 transmission electron microscope and the average diameter was determined using ImageJ.
Figure 1.
(A) TEM image of the AgNPs used in this study and (B) UV-Vis spectra of citrate capped AgNPs conjugated with RGD (red) and NLS/RGD (green) peptides showing the characteristic shift and peak broadening of the AgNPs’ surface plasmon.
Table 1.
Hydrodynamic diameters and zeta potentials of AgNPs
| Sample | Hydrodynamic Diameter (nm) | Zeta Potential (mV) |
|---|---|---|
| Citrate-AgNPs | 35 | −41 |
| PEG-AgNPs | 55 | −18 |
| NLS/RGD-AgNPs | 57 | 14 |
| RGD-AgNPs | 56 | 16 |
AgNP Peptide Conjugation
The citrate stabilized AgNPs were then pegylated to inhibit aggregation before peptide conjugation. A 1.0 mM solution of mPEG-SH 5000 (Laysan Bio, Inc.) diluted with DI water was added to a AgNP solution to achieve a 103 times greater concentration of mPEG-SH 5000 than AgNPs. The PEG-AgNP solution was allowed to incubate at room temperature overnight and excess PEG was removed by centrifugation (13,500 rpm, 8 minutes). The PEG-AgNPs were redispersed in PBS. The pegylated particles were further conjugated with peptides following a previously established method.(13) For RGD peptide (RGDRGDRGDRGDPGC) and PEG-AgNP conjugation, a 1.0 mM RGD solution diluted in DI water was added to the PEG-AgNP solution to attain 103 molar excess of the RGD peptide than PEG-AgNPs. For NLS peptide (CGGGPKKKRKVGG) and PEG-AgNP conjugation, a 5 mM NLS peptide solution was added to a PEG-AgNP solution so the NLS peptide was in 104 times molar excess. Lastly, conjugation of PEG-AgNPs with both RGD and NLS peptides was achieved by adding the peptides in 103 and 104 times molar excess respectively when compared to the PEG-AgNPs. All peptide-particle solutions were allowed to shake overnight at room temperature and excess peptides were removed by centrifugation (13,500 rpm, 8 minutes). Particles were redispersed in PBS. The conjugation with PEG and the peptides was characterized by UV-Vis Spectroscopy and DLS analysis (Figure 1 and Table 1). To achieve the desired final concentrations (0.1 nM and 0.4 nM) the peptide conjugated AgNPs were further diluted with DMEM cell culture medium.
Cell Culture
HSC-3 (human oral squamous cell carcinoma), a malignant epithelial cell line, and HaCat (human karatinocytes), a nonmalignant epithelial cell line, were cultured in Dulbecco’s Modified Eagle’s Medium (DMEM) (Mediatech) supplemented with 4.5 g/L glucose and sodium pyruvate, 10% v/v fetal bovine serum (FBS) (Mediatech) and 1% antimycotic solution (Mediatech). Cell cultures were kept at 37 °C in a 5% CO2 humidified incubator.
Dark Field Imaging Overlays
Cells were cultured on collagen coated 18 mm diameter glass coverslips for 24 hours and incubated for 24 hours with 0.1 nM peptide-AgNP solutions diluted in DMEM. The coverslips were then washed with DPBS buffer and fixed with 4% paraformaldehyde. Images were obtained with an inverted Olympus IX70 microscope with a dark field condenser (U-DCW). A 100×/1.35 oil Iris objective (UPLANAPO) was used to collect the scattered light from the AgNP treated samples.
AgNP Uptake Assay
HSC-3 and HaCat cells were cultured for 24 hours in DMEM and then incubated for another 24 hours with 0.1 nM peptide-AgNP solutions diluted in DMEM. Particle solutions were removed and the solution’s OD values at 430 nm were taken using a microplate reader (SpectraMax Plus). Cells were counted using an inverted Olympus IX70 microscope with a 10× objective. Particle uptake values were normalized to the number of cells and are reported as a relative percent uptake. Statistical significance was determined from the comparison of cancer (HSC-3) treated cells and healthy (HaCat) treated cells.
Cell Cycle Analysis with Flow Cytometry
Cells were grown for 24 hours in culture medium (DMEM) and then incubated with AgNPs in culture medium (DMEM) for 24 hours. After AgNP incubation, cells were fixed with −20 °C cold ethanol (70%) until analysis. To prepare for flow cytometry analysis, fixed cell suspensions were centrifuged at 1,250 rpm for 12 minutes and the cell pellet was redispersed in PBS. Cells were treated with 200 µg/mL RNAse (Sigma) for 30 minutes at 37 °C. Following RNAse treatment, DNA staining with 100 µg/mL of propidium iodine (Sigma) was conducted at room temperature for 15 minutes. A BD LSR II (BD Biosciences) with a 488 nm excitation laser and fluorescence detection in the PE channel was used to run flow cytometry. The obtained cell cycle data was analyzed using FloJo (Tree Star Inc.), a flow cytometry analyzing software.
Cell Synchronization
Nocodozale, a mitoic inhibitor, was used to synchronize HSC-3 and HaCat cells in the prometaphase (M phase). Cells were grown for 14 hours in the presence of 80 ng/mL nocodazole and mitoic cells were collected by shake-off. The motoic cells were released in fresh culture medium (DMEM) and collected at the indicated time points. Cells were then washed three times with PBS and fixed with −20 °C cold ethanol (70%) for further analysis by flow cytometry.
Confocal Microscopy and DNA Damage Test
HSC-3 and HaCat cells were grown on 18 mm diameter glass coverslips and treated with their respective peptide-AgNP concentration. Cell fixation was conducted with 2% paraformaldehyde for 15 minutes, and cells were washed in PBS for 3×10 minutes. Cells were then permeabilized for 5 minutes on ice in 0.2% Triton X-100 and blocked in PBS with 1% BSA for 3×10 minutes at room temperature. Blocked cells were incubated with anti-γ-H2AX antibody (Bethyl Laboratories, INC) for one hour, washed in PBS with 1% BSA for 3×10 minutes at room temperature and then incubated for 1 hour at room temperature with FITC-conjugated goat anti-rabbit secondary antibody (Bethyl Laboratories, INC). Lastly, cells were washed in PBS with 1% BSA for 3×10 minutes at room temperature and stained with 4,6 diamidino-2-phenylindole (DAPI) for 5 minutes. Confocal images were taken using a Zeiss LSM 510 NLO META multi-photon excitation confocal microscope.
Real-Time Dark Field Imaging
A homemade set-up was based on the modification of an inverted Olympus IX70 microscope.(21) The samples were grown in 35 mm culture plates for 24 hours and then incubated with peptide-conjugated AgNPs in culture medium (DMEM) for 24 hours. Samples were placed inside a mini cell chamber that was mounted on the stage of the microscope. The mini cell chamber allowed the sample to maintain a temperature of 37 °C and a carbon dioxide concentration of 5% CO2. The scattered light from the sample was collected using a long working distance 40× objective. A Nikon D200 digital camera was used to capture the dark field pictures every two minutes.
Statistical Analysis
Statistical analysis of experimental values are conveyed as mean ± standard deviaion of at least three independent experiments. The data was analyzed using the t test calculator (GraphPad Software, GraphPad Software, Inc.) and statistical significance was determined from untreated (control) to treated (AgNPs incubation) samples unless otherwise noted. Data was considered statistically significant if the P value < 0.05.
RESULTS AND DISCUSSION
Synthesis and Conjugation of AgNPs
The silver nanoparticles (AgNPs) used in this work were synthesized by the reduction of silver nitrate with trisodium citrate.(20) The relatively monodispersed AgNPs had an average diameter of 35 nm, as shown by TEM (Figure 1). UV-Vis spectroscopy further confirmed the synthesis of 35 nm silver particles, as the spectra showed the characteristic surface plasmon resonance (SPR) peak at 430 nm (Figure 1). Table 1 shows measurements of the hydrodynamic diameter (HD) and the zeta potential of the synthesized AgNPs.
The citrate capped AgNPs were then conjugated with polyethylene glycol (PEG) in order to increase their stability in the culture medium and prevent non-specific binding of proteins to the surface of the particles.(22) The PEG stablized AgNPs were further conjugated with arginine-glycine-aspartic acid (RGD) and nuclear localization signal (NLS) peptides. RGD is known to target αvβ6 as well as other αv integrins on the cell surface and assists in receptor-mediated endocytosis in cancer cells.(23–25) NLS has a characteristic lysine-lysine-lysine-arginine-lysine (KKKRK) sequence. Biomolecules labeled with this nuclear tag are known to bind to importin α and β in the cytoplasm and be actively transported into the nucleus through the nuclear pore complex (NPC).(26) The bioconjugation with the NLS and RGD peptides was confirmed through UV-Vis spectroscopy and dynamic light scattering (DLS) measurements. The UV-Vis spectra in Figure 1 shows a slight red shift in the particles after conjugation with the peptides. The red shift was attributed to the change in the dielectric constant of the surrounding environment of the AgNPs. The DLS measurements, reported in Table 1, show the HD of AgNPs increased 20 nm after conjugation with the surface ligands. A change in the zeta potential of the particles was also observed after conjugation.
Additionally, the stability of the peptide-conjugated particles was investigated after 24 hours of incubation in culture medium. The UV-Vis spectra of the incubated AgNPs did not show a significant alteration in the SPR indicating that nanoparticle aggregation did not occur and the particles were stable in the biological environment (data not shown).
Localization and Relative Uptake of AgNPs in Cells
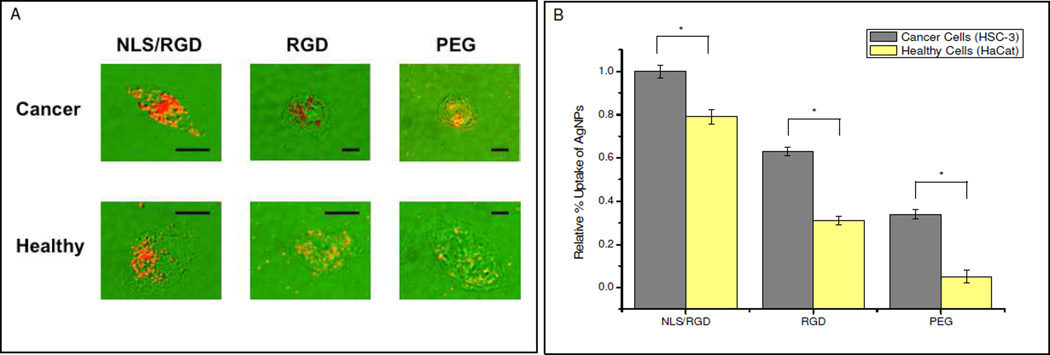
A major advantage of using silver nanoparticles in biomedical applications is their enhanced light scattering, which allows their localization and distribution to be imaged in different biological environments.(1) In this experiment, we wanted to determine the localization and relative uptake of the pegylated and peptide-conjugated AgNPs in two different cell lines. The cell lines used were human oral squamous cells carcinoma (HSC-3) and human keratinocytes (HaCat) cells, which modeled cancer and healthy cells respectively. HSC-3 cells have been reported to express αv integrins (ie. αvβ3 and αvβ5) and overexpress αvβ6 integrins, an RGD receptor, on their cell surface.(27, 28) We hypothesized that RGD conjugation would enhance the uptake of AgNPs by cancer cells since our healthy cell line has not been shown to overexpress αvβ6 integrins unless induced by transforming growth factor-β1 (TGFβ1).(29) To investigate the uptake and localization of NLS/RGD-AgNPs, RGD-AgNPs and PEG-AgNPs dark field imaging was utilized. The dark field image overlays seen in Figure 2A show AgNPs conjugated with the nuclear targeting signal (NLS) are localized at the nucleus of both cell models while RGD-AgNPs and PEG-AgNPs were dispersed within the cytoplasm. Figure 2A images also reveal that cancer cells show an apparent overall increase in AgNP uptake when compared to healthy cells.
Figure 2.
(A) Dark field images overlays of single cells showing where the strong scattering AgNPs reside in the cell. Dark field images show NLS/RGD-AgNPs are highly localized at the nucleus while RGD and PEG conjugated AgNPs are dispersed throughout the cytoplasm. Scale bar: 10 µm. (B) The relative percent uptake of the conjguated AgNPs incubated in cancer (grey) and healthy (yellow) cells for 24 hours. Cancer cells show a higher relative uptake of conjugated AgNPs when compared to healthy cells. All values were normalized to the number of cells present in the sample. Asterisks (*) indicate a p value < 0.05.
To quantify the uptake of the different AgNPs in the cancer and healthy cell lines, the relative percent uptake of particles was determined. AgNP uptake, as reported in Figure 2B, was calculated through the normalization of the data to the number of cells present in each sample well. Cancer cells showed a statistically significant (P < 0.05) higher relative percent uptake of all conjugated AgNPs when compared to heatlhy cells. Furthermore, NLS/RGD-AgNPs exhibited the greatest relative percent uptake in both cell lines. The increased uptake in cancer cell lines is thought to be due to the overexpression of αvβ6 integrins on their cellular membrane(27), however other αv integrins on the cell surface could have also contributed to the trend seen(24, 25). The cause for the differences between RGD and NLS/RGD particle uptake in both cell lines is still unclear, however the overall surface charge of the particles could enhance/hinder the particle’s ability to undergo receptor-mediated endocytosis.
Cell Cycle Analysis and Cell Synchronization of AgNP Treated Cells
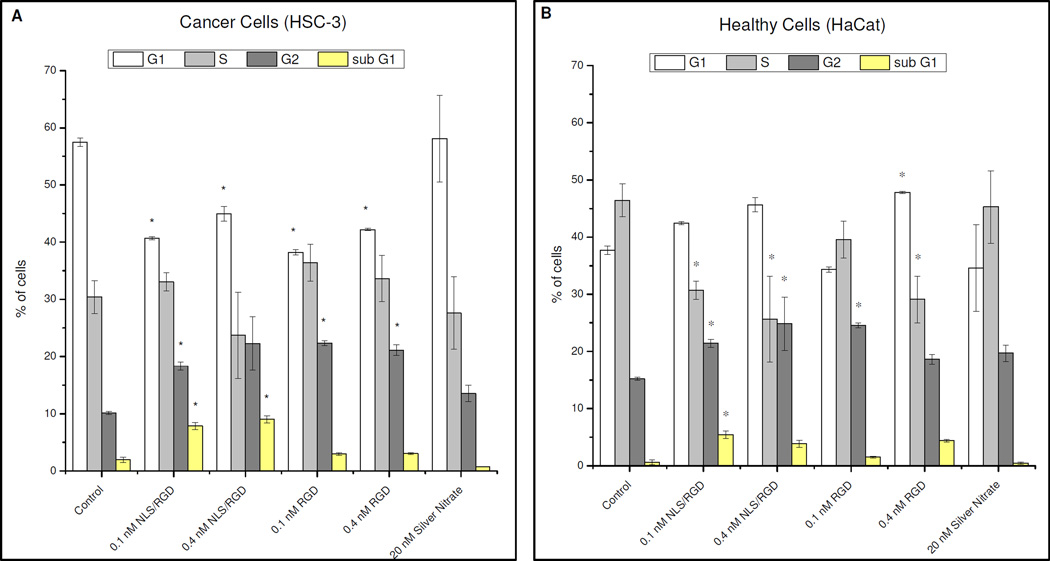
After it was shown that NLS/RGD-AgNPs did localize at the nucleus, we investigated whether this localization caused cell cycle distruption in both cell models. To determine the effects of the peptide-conjugated AgNPs on cancer and healthy cells, complete cell cycle analysis was performed using flow cytometry. The complete cell cycle analysis of cancer and healthy cells treated with 0.1 nM and 0.4 nM conjugated AgNPs for 24 hours, as to allow successful uptake of the particles, is shown in Figure 3. Cancer cells treated with 0.1 nM and 0.4 nM NLS/RGDAgNP showed a statistically significant (p < 0.05) increase in the sub G1 (DNA deficient(30)) population (Figure 3A). The sub G1 population resulting from incubation with 0.1 nM nuclear-targeting AgNPs suggested that there was an increased toxicity of AgNPs in our cancer cell model when compared to AuNPs.(14) The sub G1 population also appears to increase as the concentration of nuclear-targeting AgNPs introduced into the cancer cells increases from 0.1 nM (~8.0%) to 0.4 nM (~9.0%). Additionally, cancer cells treated with NLS/RGD-AgNPs showed an accumulation in the G2/M phase of the cell cycle indicating the presence of nuclear targeting AgNPs disrupted the transition of G2/M or M/G1.
Figure 3.
Complete cell cycle analysis of cancer and healthy cells by using flow cytometry. Cancer cells show a significant increase in the sub G1 (DNA deficient) population after treatment with NLS/RGD-AgNPs when compared to the control (A). G2 accumulation is seen in both cell models when treated with peptide-conjugated AgNPs. Asterisks (*) indicate a P value < 0.05.
Contrary to the results seen with nuclear-targeting AuNPs, a significant sub G1 population was also seen in healthy cells when treated with NLS/RGD-AgNPs for 24 hours (Figure 3B). It is believed that the lack of overexpression of αvβ6 integrins(29) on their cell surface and reduced uptake of nuclear-targeting AgNPs contributes to the reduced sub G1 population in healthy cells when compared to our cancer cell model. Nevertheless, the presence of the DNA deficient population in healthy cells provides further evidence of the harmful, toxic effects AgNPs have when compared to AuNPs. Moreover, healthy cells show G2/M accumulation upon treatment with NLS/RGD-AgNPs indicating that the presence of nuclear-targeting AgNPs prevents normal transitions between the different phases of the cell cycle.
To ensure that the NLS peptide was necessary to induce significant sub G1 populations in cancer and healthy cells, we examined the effect that RGD and PEG conjguated AgNPs had on the cell cycle. Cancer and healthy cells treated with RGD-AgNPs did not show a significant increase in the sub G1 population when compared to their controls but did show G2/M accumulation. The G2/M accumulation seen in our work is consistent with work reported from AshaRani et al. as they observed similar G2 accumulation in human glioblastoma cells (U251) and normal human lung fibroblast cells (IMR-90) when treated with starch-coated AgNPs.(31) However, their starch coated particles did not produce DNA deficient populations. This suggests that alteration of the cell cycle occurs in the presence of AgNPs, but the observed increase in apoptotic populations is only induced when AgNPs are localized at the nucleus. Moreover, cell cycle analysis of cancer and healthy cells treated with 0.1 nM and 0.4 nM PEG-AgNP showed no significant increase in the sub G1 or apoptotic population when compared to untreated cells (Figure S2).
The two main reported causes for the appearance of an apoptotic population upon treatment with AgNPs are the leaching of Ag+ ions from the AgNPs and the generation of reactive oxygen species (ROS) from nano metal oxide materials (AgNPs can oxidize easily to form Ag2O).(31, 32) To determine if the alteration in the cell cycle was due to free Ag+ ions alone, cancer and healthy cells were incubated for 24 hours with 20 nM AgNO3 and their cell cycles were analyzed. Neither cell model showed significant (P < 0.05) cell cycle alteration (Figure 3) when compared to their controls. This result suggested that the apoptotic population is not solely due to the leaching of Ag+ ions and could be part due to the generation of ROS from the silver metal oxide inside the cancer cells.(33) ROS species are known to cause oxidative stress and DNA damage inside cells, which is a leading cause of apoptosis.(34–37) Additionally, it has been reported that upregulation of p53, a protein that is overexpressed when DNA damage occurs and causes cell cycle arrest and apoptosis, was seen after cells were incubated with unconjugated AgNPs.(38) It is possible that incubation with NLS/RGD-AgNPs also causes upregulation of p53 and signals for programmed cell death in our cancer cell model.
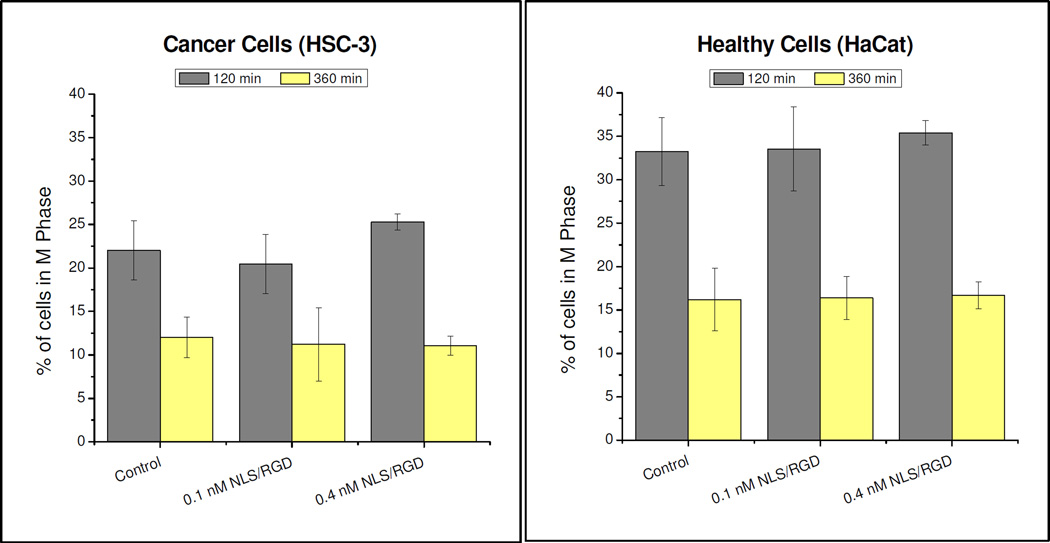
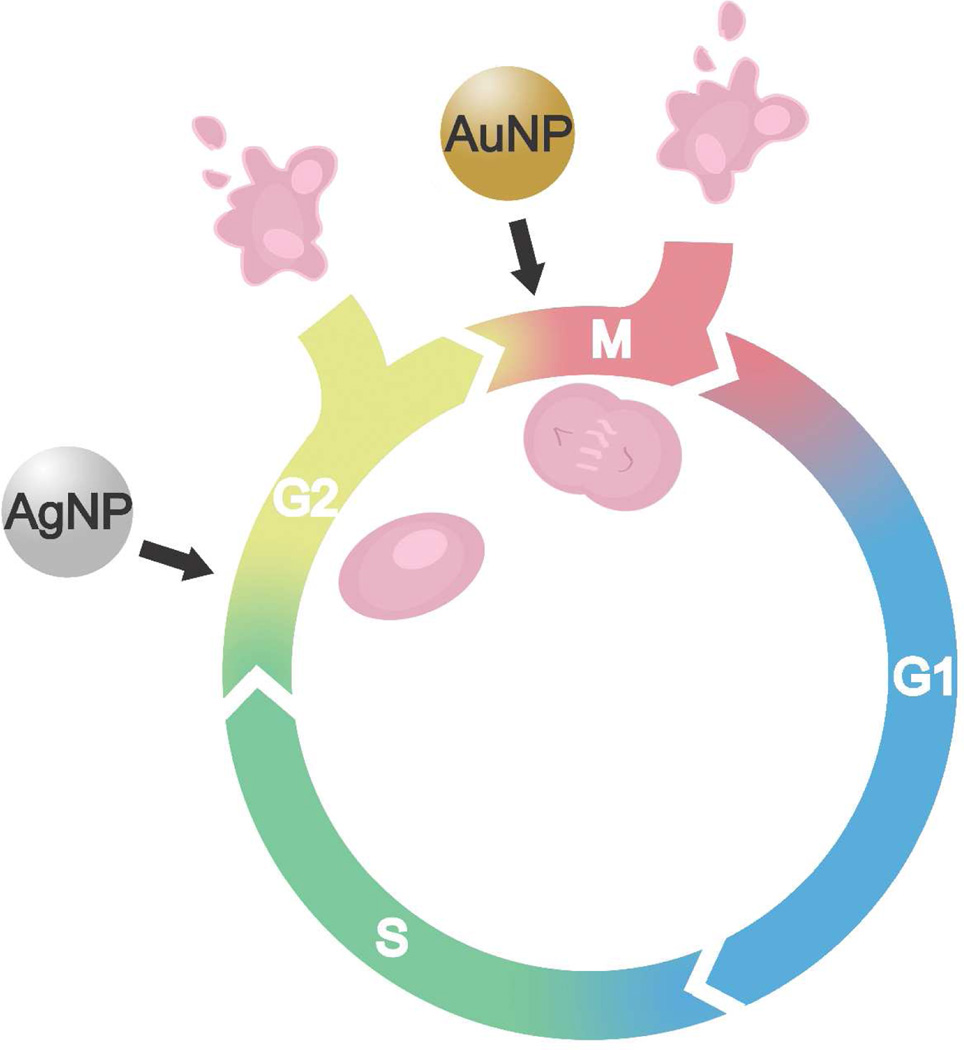
To further investigate alterations to the cell cycle, cell synchronization experiments were conducted to determine whether M phase arrest was seen after incubation with NLS/RGD-AgNPs. Nocodozale, a mitotic inhibitor, was used to synchronize cancer and healthy cells in the prometaphase (M phase).(39,40) Based on our groups previous work with nuclear-targeting AuNPs(14), which showed abscission of two daughter cells occurred in ~2 hours for untreated cells and ~4 hours for particle treated cells, we chose 120 and 360 minutres for points of analysis. As seen in Figure 4, there was not significant M phase accumulation in the cancer or healthy cells after treatment with NLS/RGD-AgNPs. These results differs from NLS/RGD-AuNPs, as M phase accumulation in cancer cells was seen.(14) Since complete cell cycle analysis revealed an increase in the G2/M population, and the cell cycle synchronization experiment did not show M phase accumulation, it is proposed that the arrest has taken place in the G2 phase. This suggests that cancer cells treated with NLS/RGD-AgNPs were unable to pass through the G2 checkpoint of the cell cycle, the cell’s last opportunity to evaluate it’s genetic material before entering mitosis(41), and resulted in apoptosis if their DNA was unable to be repaired. Furthermore, these experiments indicate that irreversible DNA damage occurs at different phases in the cell cycle when different plasmonic nanoparticles are used (Figure 5).
Figure 4.
Cell synchronization of NLS/RGD-AgNPs treated cells. Significant M phase accumulation was not seen between control and NLS/RGD-AgNP treated cells in both cancer (A) and healthy (B) cells. Cells were synchronized with nocodazole in the prometaphase (M phase) and cell cycle analysis was conducted at 120 and 360 minutes. Statistical significance was determined from a P value < 0.05.
Figure 5.
Summary of the difference in the effect of spherical nuclear-targeting AgNPs and AuNPs on the cell cycle. Cell cycle accumulation was seen in the G2 phase when cancer and healthy cells were treated with peptide-conjugated AgNPs. It has been reported13 that nuclear-targeting AuNPs show cell cycle accumulation in the M phase of the cell cycle.
Confocal Microscopy and DNA Damage Test
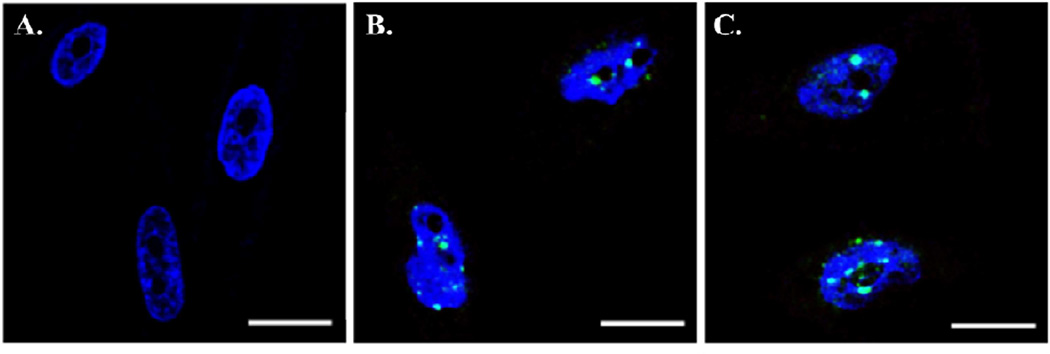
DNA damage, in cancer and healthy cells treated with nuclear targeting AgNPs, was suggested from the sub G1 population and G2 accumulation in the flow cytometry experiments. To further investigate whether DNA damage was a result of incubation with nuclear-targeting AgNPs, treated cells were tested for double strand breaks (DSBs) in DNA by confocal microscopy. Confocal images of untreated and treated cancer cells are shown in Figure 6. The nuclei have been stained blue with DAPI and DSBs are indicated by bright green FITC fluorescence foci. DNA DSBs are seen in cancer cells treated with 0.1 nM and 0.4 nM NLS/RGD-AgNPs (Figure 6B and 6C). When cancer cells were treated with 0.1 nM and 0.4 nM NLS/RGD-AuNPs, DNA DSBs were only seen after incuabtion with the 0.4 nM concentration.(14) This provides supplementary evidence that AgNPs exhibit more harmful effects on cancer cells than AuNPs. Confocal images of healthy cells treated with the highest concentration of NLS/RGD-AgNPs showed no DSBs (Figure S3). The absence of DSBs is due to the lower nanoparticle concentration at the nucleus in healthy cells compared to cancer cells. We attributed the decreased nanoparticle concentration at the nucleus to the reported lack of overexpression of αvβ6 integrins, an RGD receptor, in our healthy cell line when compared to our cancer cell line.(27, 29) These images confirm that NLS/RGD-AgNPs induce irreversible DNA damage in cancer cells, leading to an increased sub G1 (apoptotic) population. The confocal images further suggested that the selective targeting facilitated by the RGD peptide conjugation caused an increased vulnerability to DNA damage in cancer cells compared to healthy cells.
Figure 6.
Cofocal images of DNA damage in cancer cells resulting from incubation with NLS/RGD-AgNPs. The cells’ nuclei were stained with DAPI (blue) and DNA double strand breaks (DSBs) were stained with FITC (green). No DNA damage was seen in untreated cancer cells (A). DNA double strand breaks (green foci) were seen in cells treated with (B) 0.1 nM and (C) 0.4 nM NLS/RGD-AgNPs. Cells were incubated with nuclear-targeting AgNPs for 24 hours. Scale bar: 10 µm.
Real-Time Dark Field Imaging of AgNP Treated Cancer Cells
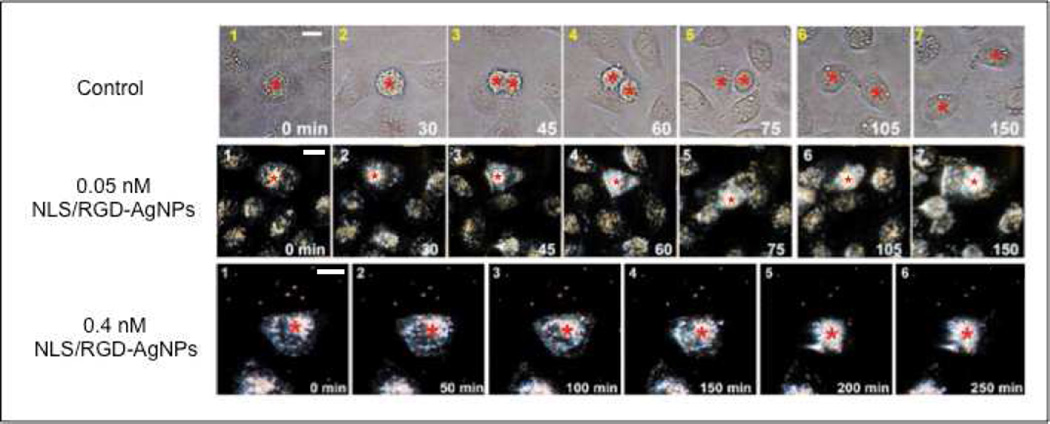
We also wanted to investigate in real-time whether the presence of nuclear targeting AgNPs in our cancer cell model interferes with proper cellular division. The dynamics of cell division were monitored by long-term live-cell plasmonic scattering imaging.(21) Figure 7 displays representative real-time dark field images of cell division in our cancer cell model. Untreated cancer cells underwent proper division and showed no cell death. However, when cancer cells were incubated with varying concentrations of NLS/RGD-AgNPs normal cell division was not observed (Figure 7) and cell death resulted. These images differs from our group’s previous work when using NLS/RGD-AuNPs, which showed cytokinesis (M phase) arrest in cancer cells after incubation with nuclear-targeted AuNPs.(14) The inability of cells treated with NLS/RGD-AgNPs to reach cytokinesis (M phase) provides further evidence that cells have arrested and accumulated in the G2 phase of the cell cycle due to the increased cytotoxicity of AgNPs compared to AuNPs.
Figure 7.
Real-time dark field images of cancer cells. Untreated cells (top) showed proper cell division while cells treated with 0.05 nM (middle) and 0.4 nM (bottom) nuclear-targeting AgNPs were unable to successfully divide and resulted in programmed cell death. The red stars indicate the cells of interest. Scale bar: 10 µm.
CONCLUSIONS
The cell cycle and cell division of cancer (HSC-3) and healthy (HaCat) cells in the presence of conjugated AgNPs were systematically studied. DNA damage and apoptosis were seen in cancer cells that were treated with nuclear-targeting AgNPs. Real-time dark field imaging suggested that cancer cells treated with NLS/RGD-AgNPs are unable to successfully divide and ultimately undergo cell death. Complete cell cycle analysis showed a significant increase in the sub G1 population of cancer cells after treatment with nuclear-targeting AgNPs. G2 accumulation was also seen in cancer and healthy cells during cell cycle analysis. The resulting G2 accumulation in cells treated with varying concentrations of AgNPs differed from the M phase accumulation in cells treated with 0.4 nM NLS/RGD-AuNPs. In cancer cells, the G2 accumulation accompanied by the increase in the sub G1 population suggests cells were unable to pass through the G2 checkpoint and the G2-M transition has been affected. The cause of the altered cell cycle was attributed to DNA damage, as seen with confocal microscopy. The basis for the observed DNA damage could potentially be a result of ROS generation from the AgNPs, as we eliminated leaching Ag+ ions as the sole reason. These results demonstrate the importance of systematically studying the intracellular effects of each surface ligand and plasmonic nanoparticle combination to ensure the desired biomedical function and cytotoxicity are achieved.
Supplementary Material
Acknowledgments
MAE would like to thank Julius Brown Chair Funding (3306559GT) and the NIH-NCI support (U01CA151802-01). LA would like to thank the GT GAANN Fellowship (3306FT8). BK thanks the China Scholar Council (2008683010) and the Doctor Innovation Funds of China NUAA (BCXJ08-09). The authors would like to thank Brian Snyder for taking TEM micrographs of the synthesized silver nanoparticles.
Footnotes
Supporting Information Available: Additional figures and images as described in the text. This material is available free of charge via the Internet at http://pubs.acs.org.
REFERENCES
- 1.Kelly KL, Coronado E, Zhao LL, Schatz GC. The Optical Properties of Metal Nanoparticles: The Influence of Size, Shape, and Dielectric Environment. J. Phys. Chem. B. 2002;107:668–677. [Google Scholar]
- 2.Huang X, El-Sayed IH, Qian W, El-Sayed MA. Cancer Cell Imaging and Photothermal Therapy in the Near-Infrared Region by Using Gold Nanorods. J. Am.n Chem. Soc. 2006;128:2115–2120. doi: 10.1021/ja057254a. [DOI] [PubMed] [Google Scholar]
- 3.Braydich-Stolle L, Hussain S, Schlager JJ, Hofmann M-C. In Vitro Cytotoxicity of Nanoparticles in Mammalian Germline Stem Cells. Toxicol. Sci. 2005;88:412–419. doi: 10.1093/toxsci/kfi256. [DOI] [PMC free article] [PubMed] [Google Scholar]
- 4.Hussain SM, Hess KL, Gearhart JM, Geiss KT, Schlager JJ. In vitro toxicity of nanoparticles in BRL 3A rat liver cells. Toxicol. in Vitro. 2005;19:975–983. doi: 10.1016/j.tiv.2005.06.034. [DOI] [PubMed] [Google Scholar]
- 5.Ahamed M, Karns M, Goodson M, Rowe J, Hussain SM, Schlager JJ, Hong Y. DNA damage response to different surface chemistry of silver nanoparticles in mammalian cells. Toxicol. Appl. Pharmacol. 2008;233:404–410. doi: 10.1016/j.taap.2008.09.015. [DOI] [PubMed] [Google Scholar]
- 6.Arora S, Jain J, Rajwade JM, Paknikar KM. Cellular responses induced by silver nanoparticles: In vitro studies. Toxicol. Lett. 2008;179:93–100. doi: 10.1016/j.toxlet.2008.04.009. [DOI] [PubMed] [Google Scholar]
- 7.Chung LWK, Isaacs WR, Simons JW. Prostate Cancer: Biology, Genetics & the New Therapeutics. Totowa: Humana Press Inc.; 2001. [Google Scholar]
- 8.Panyam J, Labhasestwar V. Targeting Intracellular Targets. Curr. Drug Delivery. 2004;1:235–247. doi: 10.2174/1567201043334768. [DOI] [PubMed] [Google Scholar]
- 9.Kumar CSSR. Nanomaterials for Cancer Diagnosis. Wiley-VCH Verlag GmbH & Co.; 2007. [Google Scholar]
- 10.Murphy MP. Selective targeting of bioactive compounds to mitochondria. Trends in Biotechnol. 1997;15:326–330. doi: 10.1016/S0167-7799(97)01068-8. [DOI] [PubMed] [Google Scholar]
- 11.Murphy MP, Smith RAJ. Drug delivery to mitochondria: the key to mitochondrial medicine. Adv. Drug Delivery Rev. 2000;41:235–250. doi: 10.1016/s0169-409x(99)00069-1. [DOI] [PubMed] [Google Scholar]
- 12.Tkachenko AG, Xie H, Coleman D, Glomm W, Ryan J, Anderson MF, Franzen S, Feldheim DL. Multifunctional Gold Nanoparticle-Peptide Complexes for Nuclear Targeting. J. Am.n Chem. Soc. 2003;125:4700–4701. doi: 10.1021/ja0296935. [DOI] [PubMed] [Google Scholar]
- 13.Oyelere AK, Chen PC, Huang X, El-Sayed IH, El-Sayed MA. Peptide-Conjugated Gold Nanorods for Nuclear Targeting. Bioconjugate Chem. 2007;18:1490–1497. doi: 10.1021/bc070132i. [DOI] [PubMed] [Google Scholar]
- 14.Kang B, Mackey MA, El-Sayed MA. Nuclear Targeting of Gold Nanoparticles in Cancer Cells Induces DNA Damage, Causing Cytokinesis Arrest and Apoptosis. J. Am. Chem. Soc. 2010;132:1517–1519. doi: 10.1021/ja9102698. [DOI] [PubMed] [Google Scholar]
- 15.Rastogi SC. Cell Biology. New Age International Publishers; 2007. [Google Scholar]
- 16.Yoon K-Y, Hoon Byeon J, Park J-H, Hwang J. Susceptibility constants of Escherichia coli and Bacillus subtilis to silver and copper nanoparticles. Sci. Total Environ. 2007;373:572–575. doi: 10.1016/j.scitotenv.2006.11.007. [DOI] [PubMed] [Google Scholar]
- 17.Lok C-N, Ho C-M, Chen R, He Q-Y, Yu W-Y, Sun H, Tam PK-H, Chiu J-F, Che C-M. Proteomic Analysis of the Mode of Antibacterial Action of Silver Nanoparticles. J. of Proteome Res. 2006;5:916–924. doi: 10.1021/pr0504079. [DOI] [PubMed] [Google Scholar]
- 18.Foldbjerg R, Olesen P, Hougaard M, Dang DA, Hoffmann HJ, Autrup H. PVP-coated silver nanoparticles and silver ions induce reactive oxygen species, apoptosis and necrosis in THP-1 monocytes. Toxicol. Lett. 2009;190:156–162. doi: 10.1016/j.toxlet.2009.07.009. [DOI] [PubMed] [Google Scholar]
- 19.Carlson C, Hussain SM, Schrand AMK, Braydich-Stolle L, Hess KL, Jones RL, Schlager JJ. Unique Cellular Interaction of Silver Nanoparticles: Size- Dependent Generation of Reactive Oxygen Species. J. Phys. Chem. B. 2008;112:13608–13619. doi: 10.1021/jp712087m. [DOI] [PubMed] [Google Scholar]
- 20.Freund PL, Spiro M. Colloidal catalysis: the effect of sol size and concentration. J. Phys. Chem. 1985;89:1074–1077. [Google Scholar]
- 21.Qian W, Huang X, Kang B, El-Sayed MA. Dark-field light scattering imaging of living cancer cell component from birth through division using bioconjugated gold nanoprobes. J. Biomed. Opt. 2010;15:046025. doi: 10.1117/1.3477179. [DOI] [PubMed] [Google Scholar]
- 22.Wuelfing WP, Gross SM, Miles DT, Murray RW. Nanometer Gold Clusters Protected by Surface-Bound Monolayers of Thiolated Poly(ethylene glycol) Polymer Electrolyte. J. Am. Chem. Soc. 1998;120:12696–12697. [Google Scholar]
- 23.Busk M, Pytela R, Sheppard D. Characterization of the integrin alpha v beta 6 as a fibronectin-binding protein. J. Biol. Chem. 1992;267:5790–5796. [PubMed] [Google Scholar]
- 24.Takayama S, Hatori M, Kurihara Y, Shirota T, Shintani S. Inhibition of TGF-β1 suppresses motility and invasiveness of oral squamous cell carcinoma cell lines via modulation of integrins and down-regulation of matrix-metalloproteinases. Oncol. Rep. 2009;21:205–210. [PubMed] [Google Scholar]
- 25.Dehari H, Ito Y, Nakamura T, Kobune M, Sasaki K, Yonekura N, Kohama G, Hamada H. Enhanced antitumor effect of RGD fiber-modified adenovirus for gene therapy of oral cancer. Cancer Gene Ther. 2003;10:75–85. doi: 10.1038/sj.cgt.7700529. [DOI] [PubMed] [Google Scholar]
- 26.Dingwall C, Laskey RA. Nuclear targeting sequences -- a consensus? Trends Biochem. Sci. 1991;16:478–481. doi: 10.1016/0968-0004(91)90184-w. [DOI] [PubMed] [Google Scholar]
- 27.Xue H, Atakilit A, Zhu W, Li X, Ramos DM, Pytela R. Role of the [alpha]v[beta]6 Integrin in Human Oral Squamous Cell Carcinoma Growth in Vivo and in Vitro. Biochem. Biophys. Res. Commun. 2001;288:610–618. doi: 10.1006/bbrc.2001.5813. [DOI] [PubMed] [Google Scholar]
- 28.Jones J, Watt FM, Speight PM. Changes in the expression of αv integrins in oral squamous cell carcinomas. J. Oral Pathol. Med. 1997;26:63–68. doi: 10.1111/j.1600-0714.1997.tb00023.x. [DOI] [PubMed] [Google Scholar]
- 29.Koivisto L, Larjava K, Häkkinen L, Uitto V, Heino J, Larjava H. Different integrins mediate cell spreading, haptotaxis and lateral migration of HaCaT keratinocytes on fibronectin. Cell Adhes. Commun. 1999;7:245–257. doi: 10.3109/15419069909010806. [DOI] [PubMed] [Google Scholar]
- 30.Cooke MS, Evans MD, Dizdaroglu M, Lunec J. Oxidative DNA damage: mechanisms, mutation, and disease. FASEB. 2003;17:1195–1214. doi: 10.1096/fj.02-0752rev. [DOI] [PubMed] [Google Scholar]
- 31.AshaRani PV, Low Kah Mun G, Hande MP, Valiyaveettil S. Cytotoxicity and Genotoxicity of Silver Nanoparticles in Human Cells. ACS Nano. 2008;3:279–290. doi: 10.1021/nn800596w. [DOI] [PubMed] [Google Scholar]
- 32.Hossain Z, Huq F. Studies on the interaction between Ag+ and DNA. J. Inorg. Biochem. 2002;91:398–404. doi: 10.1016/s0162-0134(02)00454-3. [DOI] [PubMed] [Google Scholar]
- 33.Kawata K, Osawa M, Okabe S. In Vitro Toxicity of Silver Nanoparticles at Noncytotoxic Doses to HepG2 Human Hepatoma Cells. Environ. Sci. Techn. 2009;43:6046–6051. doi: 10.1021/es900754q. [DOI] [PubMed] [Google Scholar]
- 34.Moustafa MH, Sharma RK, Thornton J, Mascha E, Abdel-Hafez MA, Thomas AJ, Agarwal A. Relationship between ROS production, apoptosis and DNA denaturation in spermatozoa from patients examined for infertility. Hum. Reprod. 2004;19:129–138. doi: 10.1093/humrep/deh024. [DOI] [PubMed] [Google Scholar]
- 35.Rowe LA, Degtyareva N, Doetsch PW. DNA damage-induced reactive oxygen species (ROS) stress response in Saccharomyces cerevisiae. Free Radical Biol. Med. 2008;45:1167–1177. doi: 10.1016/j.freeradbiomed.2008.07.018. [DOI] [PMC free article] [PubMed] [Google Scholar]
- 36.Simon HU, Haj-Yehia A, Levi-Schaffer F. Role of reactive oxygen species (ROS) in apoptosis induction. Apoptosis. 2000;5:415–418. doi: 10.1023/a:1009616228304. [DOI] [PubMed] [Google Scholar]
- 37.Wiseman H, Halliwell B. Damage to DNA by reactive oxygen and nitrogen species : role in inflammatory disease and progression to cancer. Biochem. J. 1996;313:17–29. doi: 10.1042/bj3130017. [DOI] [PMC free article] [PubMed] [Google Scholar]
- 38.Hsin Y-H, Chen C-F, Huang S, Shih T-S, Lai P-S, Chueh PJ. The apoptotic effect of nanosilver is mediated by a ROS- and JNK-dependent mechanism involving the mitochondrial pathway in NIH3T3 cells. Toxicol. Lett. 2008;179:130–139. doi: 10.1016/j.toxlet.2008.04.015. [DOI] [PubMed] [Google Scholar]
- 39.Samson F, Donoso JA, Heller-Bettinger I, Watson D, Himes RH. Nocodazole action on tubulin assembly, axonal ultrastructure and fast axoplasmic transport. J. Pharmacol. Exp. Ther. 1979;208:411–417. [PubMed] [Google Scholar]
- 40.Poxleitner MK, Dawson SC, Cande WZ. Cell Cycle Synchrony in Giardia intestinalis Cultures Achieved by Using Nocodazole and Aphidicolin. Eukaryotic Cell. 2008;7:569–574. doi: 10.1128/EC.00415-07. [DOI] [PMC free article] [PubMed] [Google Scholar]
- 41.Schönthal AH, editor. Checkpoint Controls and Cancer. Totown: Humana Press; 2004. [Google Scholar]
Associated Data
This section collects any data citations, data availability statements, or supplementary materials included in this article.


