Abstract
Complex diseases are the result of intricate interactions between genetic, epigenetic and environmental factors. In previous studies, we used epidemiological and genetic data linking environmental exposure or genetic variants to phenotypic disease to construct Human Phenotype Networks and separately analyze the effects of both environment and genetic factors on disease interactions. To better capture the intricacies of the interactions between environmental exposure and the biological pathways in complex disorders, we integrate both aspects into a single “tripartite” network. Despite extensive research, the mechanisms by which chemical agents disrupt biological pathways are still poorly understood. In this study, we use our integrated network model to identify specific biological pathway candidates possibly disrupted by environmental agents. We conjecture that a higher number of co-occurrences between an environmental substance and biological pathway pair can be associated with a higher likelihood that the substance is involved in disrupting that pathway. We validate our model by demonstrating its ability to detect known arsenic and signal transduction pathway interactions and speculate on candidate cell-cell junction organization pathways disrupted by cadmium. The validation was supported by distinct publications of cell biology and genetic studies that associated environmental exposure to pathway disruption. The integrated network approach is a novel method for detecting the biological effects of environmental exposures. A better understanding of the molecular processes associated with specific environmental exposures will help in developing targeted molecular therapies for patients who have been exposed to the toxicity of environmental chemicals.
Keywords: Exposure, Complex Diseases, Chemical Agents, Biological Pathways, Human Phenotype Network
1. Introduction
Complex diseases are believed to be the result of non-linear genetic, epigenetic and environmental interactions. Epistatic and pleiotropic genetic interactions, though ubiquitous in nature, only explain a fraction of disease occurrences.1 Both acute and prolonged exposure to environmental factors such as chemical agents present in water, soil, or air also contribute to human disease.2 GWAS partially reveal causal genetic interactions in complex diseases. Well-established studies of specific chemical agents link tobacco smoke to cardiovascular and respiratory diseases, and asbestos dust to several types of cancer. Integrating data from multiple sources helps to gain a better understanding of the way genetic risk factors, environmental exposures, as well as lifestyle choices all contribute to causing complex diseases.
Human phenotypes, including physical traits, diseases and behaviors, have been successfully linked through their shared biology to form networks of diseases. These networks and the interactions they reveal have been thoroughly studied using mathematical and statistical analyses.3,4 Indeed, networks offer a comprehensive array of analytical tools while at the same time providing an intuitive representation of interactions within otherwise inextricably complex data.5 Additionally, the concept of exposome6 encompasses all human environmental exposures and complements the genome in predicting complex disease.
At a systems biology level, the interaction between genetic predisposition and environmental factors is poorly understood. The discovery of novel personalized molecular drugs that target specific pathways rely on the development of methods to study the intricate interactions between our environment and the biological pathways that govern human complex disease. The focus of this work is to provide a novel tool to identify candidates for potential environmental chemical agent and biological pathway interactions.
The sheer combinatorial complexity of chemical agents and pathways drives us to explore new approaches that prioritize the interaction of potential interest. Therefore, we propose to build an extension of the Human Phenotype Network (HPN)7 based on biological pathway interactions, and overlay it with the HPN based on environmental exposure data.8 The resulting model is a tripartite network constituted of three different types of vertices: human phenotypes, biological pathways, and environmental chemical agents. By projecting the network onto the space of human phenotypical traits, we are able to identify disorders that share only biological pathways, those that share environmental factors, and those that interact both at the environmental and the genetic level. We speculate that by integrating pathways and environmental exposure data in a single network, we are able to generate plausible hypotheses about the disruptive nature of chemical agents on certain biological pathways.
We analyze the resulting integrated networks both in quantitative and qualitative terms. We show how focusing on the double-edges of disorders that share both environmental and genetic origins can help identify potential candidates for environmental chemical agent and biological pathway interactions.
2. Methods
The expansion of systems biology has given rise to a trend towards studying disease from a global perspective, reaching beyond the silos of traditional medicine. Graphs, or network, are commonly used to study the interactions between phenotype and genotype. In the Human Disease Network (HDN),3 or its extension, the Human Phenotype Network,7 nodes representing diseases and phenotypes are linked by edges that represent various connections between disorders. These connections can be established by identifying shared causal genes,3 genetic variants (SNPs),9 linkage-disequilibrium SNP clusters,7 biological pathways,4 or clinical symptoms.10 The underlying connections of these networks contribute to the understanding of the molecular basis of disorders, which in turn lead to a better understanding of human disease.
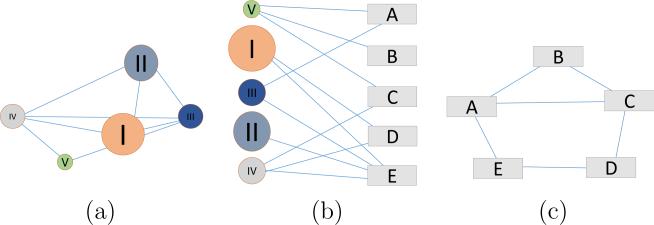
In previous works, we presented the concept of Human Phenotype Networks (HPNs), which represent the interactions between human traits and diseases based on their shared biological background, such as SNPs, genes, or pathways.4,7 This approach has proven useful in analyzing epistatic and pleiotropic effects at the systems level.11 Additionally, we have proposed an extension to the HPN based on shared environmental chemical agents.8 When considered separately, both environmental and genetic HPNs are bipartite networks5 composed of two distinct sets of vertices. Edges can only connect members of the opposite set. Bipartite networks can be projected in the space of either vertex set. Projecting the network increases the readability and interpretability of the data represented, but results in information loss. Figure 1 shows a schematic representation of a bipartite network in the center panel (b) and the resulting projection in either the space of circle vertices (a) and the space of rectangle vertices (c). In the case of the genetic HPN presented below, the vertex sets are composed of diseases and biological pathways. In the environmental HPN, the vertex sets are composed of diseases and chemical substances.
Fig. 1.
Schematic representation of a Bipartite Network (b) and its projection in the space of either vertex set (a) and (c).
Because both HPNs share the disease vertex set, we can combine the two HPNs into a single “tripartite” network composed of three distinct vertex sets: traits, biological pathways, and chemical agents. Figure 2 represents a tripartite network (a) and its projection onto the rectangle vertex set (b). In tripartite networks, the edges are also divided into two categories. In our example, the blue edges only connect circle and rectangle vertices, whereas the red edges connect rectangles to diamonds. The resulting projection network has vertices linked by blue edges, red edges or both red and blue edges. Naturally, a tripartite network can be projected onto the space of either vertex set.
Fig. 2.
Schematic representation of a Tripartite Network (a) and its projection in the space of the “rectangle” vertex set (b).
In the following sections, we discuss the two bipartite HPNs and the third novel tripartite HPN that combines exposure and genetic data.
2.1. Human Phenotype Network based on Exposure Data
In our previous study, we proposed a novel approach to bridging the gap between environmental exposure data and information on the diseases they may cause.8 To the best of our knowledge, the exposure-to-disease data has not been aggregated in publicly accessible sources. To establish possible causal effects at a global level, we integrated data from the CDC's Fourth National Report on Human Exposure to Environmental Chemicals (http://www.cdc.gov/exposurereport/), including its subsequent updated tables, and the data of the NHGRI GWAS Catalog, accessed on 05/06/2014. Through a meticulous PubMed and Google Scholar literature survey, we compile a list of the diseases and traits that have been associated with any 60 environmental chemicals of the CDC's report. The CDC has identified these chemical agents as potentially harmful to human health and categorized them into 11 groups such as tobacco smoke, heavy metals, pesticides, etc. Figure 8 (X-axis) recapitulates all the chemical agents and their group in square brackets. Causal association between a chemical substance and a disease is based on compelling evidence found in the literature and confirmed in multiple studies, limiting uncertain associations to a minimum. We subsequently use the phenotype list from the GWAS catalog and the International Classification of Diseases Ninth Revision (ICD-9) codes to classify all traits and eliminate redundancies. Our survey inventories 548 well-established causal effects between these 60 substances and 151 human phenotypic traits and disorders. We note, however, that the data collected might contain a bias towards phenotypes and exposures that are more heavily studied.
Fig. 8.
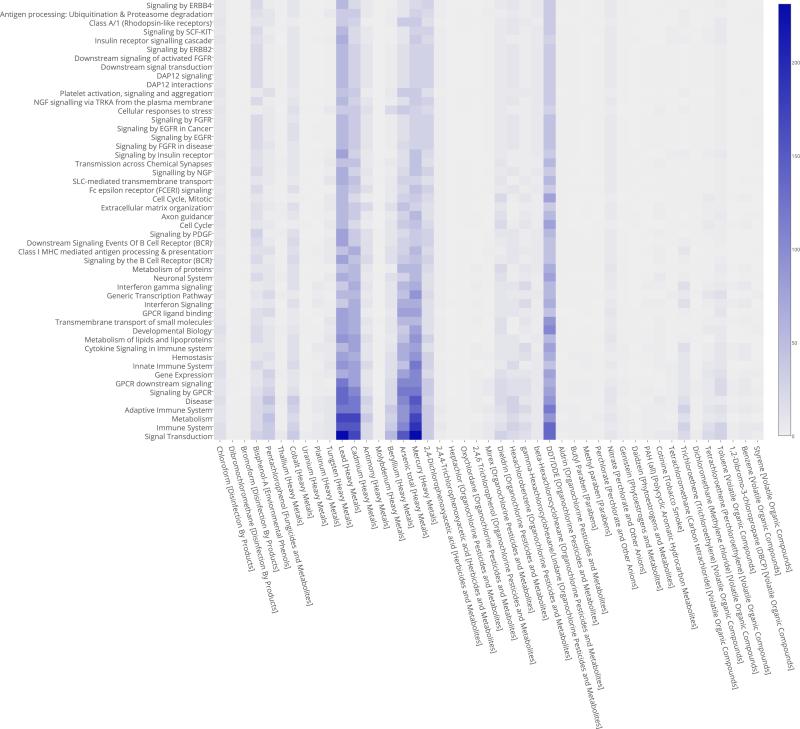
Pathway-Substance Interaction Heatmap.
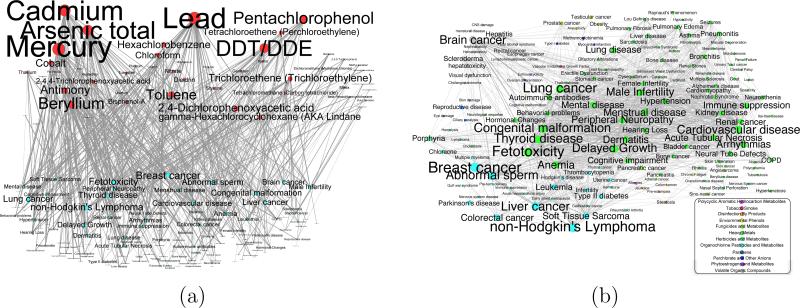
The data aggregated in the survey is arranged in a bipartite network of diseases and environmental chemical compounds linked by “probable causality” edges. The resulting graph is depicted in Figure 3(a). This bipartite network shows the 548 relationships between the 60 chemical substances (top row, red vertices) and the 151 human disorders (bottom row, light blue vertices). The node sizes are proportional to vertex degree, i.e. the number of connections to the opposite set of vertices. The resulting projection onto the disease space is presented in Figure 3(b), where edges display common chemical factors associated with disorders. Furthermore, each node in the network is annotated with the substance classification group(s) to which it belongs. In the case of chemicals, the annotation is straightforward, as each substance belongs to exactly one class. For diseases, we identify all groups that contain at least one causal substance. A detailed description of the environmental HPN and our findings is available in our previous study.8 The projection onto the chemical substance space is not shown in this study to save space, but it can be found in our previous study.8 Nodes are color coded according to their (majority) substance class. The phenotype network (b) has 151 nodes and is densely connected (average degree of 40+), where each edge signifies that the two diseases they connect are associated with one or more common chemical agents.
Fig. 3.
Phenotype-Substances Network. (a) The Bipartite Network. Top row, red vertices: environmental chemical substances. Bottom row, blue vertices: human phenotypes and diseases. Vertex size is proportional to the degree. (b) Projections onto the Phenotype Space. Nodes are colored according to their (majority) substance group according to the legend. Node sizes are proportional to the number of substances associated. Edge weights and width represent the number of shared substances.
2.2. Human Phenotype Network based on Biological Pathways
In their seminal work, Goh et al.,3 explored the Human Disease Network, limiting their analysis to the genes shared by different diseases. Another study by Li et al.9 traced the genetic variants connecting disease traits. In 2009, Silpa Suthram et al.12 analyzed diseases by their related messenger RNA in combination with the human protein interaction network. They found significant genetic similarities between certain diseases, some of which shared drug treatments. Also in 2009, Barrenas et al.13 further studied the genetic architecture of complex diseases by doing a GWAS, and found that complex disease genes contribute less and are less represented than the single-gene diseases in the human interactome. In 2014, Zhou et al.14 have presented yet another way of finding overlap in disease commonalities, that is, they link disorders that share symptoms.
In the present work, we expand on the biological SNP-based HPN presented first in our previous studies.11,15 We update the data to the most recent versions of the GWAS catalog (05/15/2015), NIH database of Genotypes and Phenotypes (dbGaP), and the Kyoto Encyclopedia of Genes and Genomes (KEGG).16 We integrate the 1,252 phenotype information from both sources, the over 37,000 SNPs annotation, and 16,000 gene/loci association, as well as the biological pathways data to build the present pathway-based HPN. By aggregating these associations, we were able to link phenotypes with shared pathways, i.e. with genes involved in the same pathways. Furthermore, we have used the International Classification of Diseases Ninth Revision (ICD-9) codes to classify all traits and identify redundancies. The HPN encompasses all phenotypes listed in the GWAS catalog and dbGaP, provided that they are connected to at least one other trait. It is comprised of 986 phenotypic traits, 1,424 biological pathways, and over 260,000 edges, with an average connectivity of 500+.
2.3. Combining the Human Phenotype Networks: Tripartite and Projection
The main focus of this work is to help identify potential candidates for environmental chemical agent and biological pathway interactions. These interactions can in turn guide the development of novel targeted and personalized therapies. To help tease out potentially relevant pathway-environment interactions out of all the possible combinations, we build the tripartite HPN by combining the pathway-based HPN and the environmental HPN into one graph. The resulting model is comprised of 2,529 vertices of three different types: 1,045 diseases (142 overlapping between the two HPNs), 1,424 biological pathways, and 60 environmental chemical substances. Moreover, the tripartite HPN includes two different types of interaction edges: about 80,000 disease-to-pathway and over 1,500 disease-to-substance links.
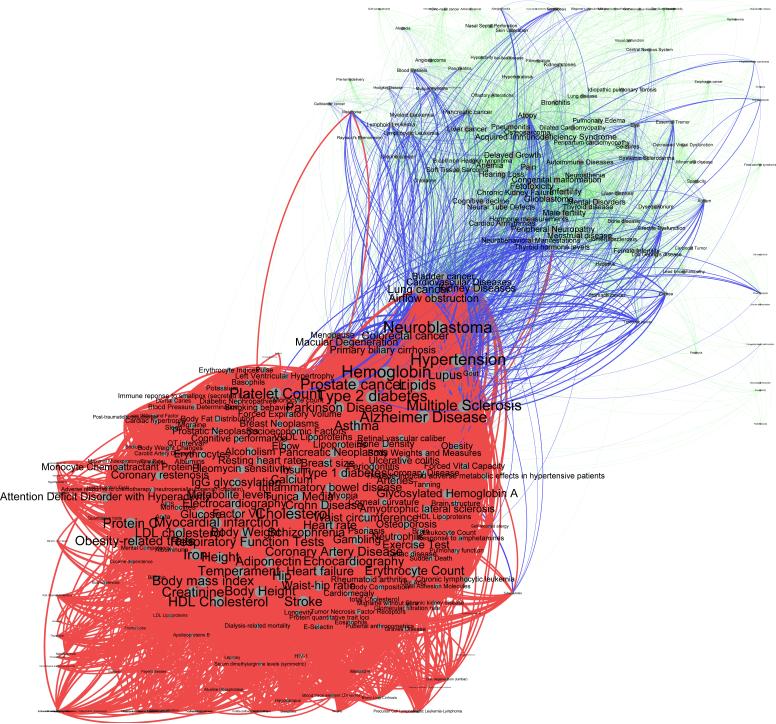
Because of the sheer size, density and complexity of the tripartite network, we choose to present only its projection onto the disease space in Figure 4. Red edges represent biological pathway interactions, green edges represent environmental chemical agent interactions, and blue edges are double edges that share both biological and environmental interactions.
Fig. 4.
Combined Human Phenotype Network based on Biological Pathways and Chemical Substances Exposure: Projection of the substance-phenotype-pathway tripartite network onto the phenotype space. Red edges represent pathway interactions only. Green edges show identified substance interactions. Finally, blue edges show pairs of traits that share both biological pathways and chemical substance exposure. The vertex and label size are proportional to its degree (i.e. the number of impinging edges).
To further facilitate the interpretation of the results and focus our analysis on shared genetic and environmental candidates, we filter the combined HPN to retain only the traits and diseases that have at least one edge of each kind impinging on them. In other words, we extract the subnetwork made of only blue edges and the vertices that are connected by those blue edges. The resulting HPN is presented in Section 3 below.
3. Results
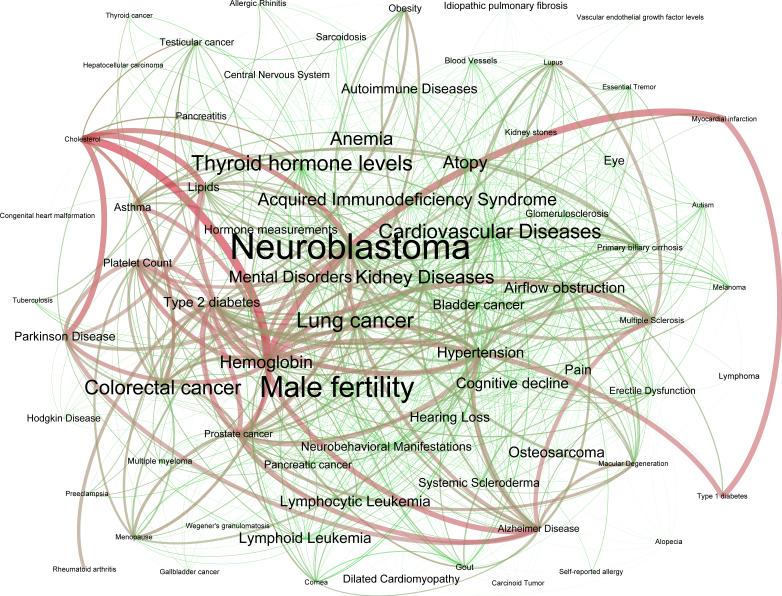
In this section, we present the results of the quantitative analysis of the projected tripartite HPN. Quantitative network and graph analysis relies on strict statistical and mathematical tools and can be applied to networks of arbitrary size and complexity.5 In this study, we focus on a subnetwork that shows the shared interactions between traits associated with both environmental and genetic factors. Therefore, we reduce the size and the complexity of the projected HPN to a manageable number of diseases and interactions in order to allow both quantitative, qualitative, and visual interpretation of the results. The final HPN integrating only vertices that share both genetic and environmental background, pictured in Figure 5, is composed of 74 phenotypes and 1,000 edges. The node (and label) size is proportional to the total number of associated environmental chemical agents; the color hue represents the number of biological pathways associated (green for fewer and red for more). The edge weight (i.e. its width) is proportional to the number of pathways shared between the disease endpoints whereas the color hue represents the number of shared environmental factors (green for fewer, red for more).
Fig. 5.
Filtered Substance-Exposure HPN: Projection of the substance-phenotype-pathway tripartite networks onto the phenotype space filtered to retain only edges and vertices that share both substance and genetic interactions. Vertex size is proportional to the total number of associated substances; vertex color is proportional to the number of biological pathways associated (green for fewer and red for more). Edge width is proportional to the number of shared pathways; edge color is proportional to the number of shared substances (green for fewer, 1 pathway, and red for most: 10 pathways).
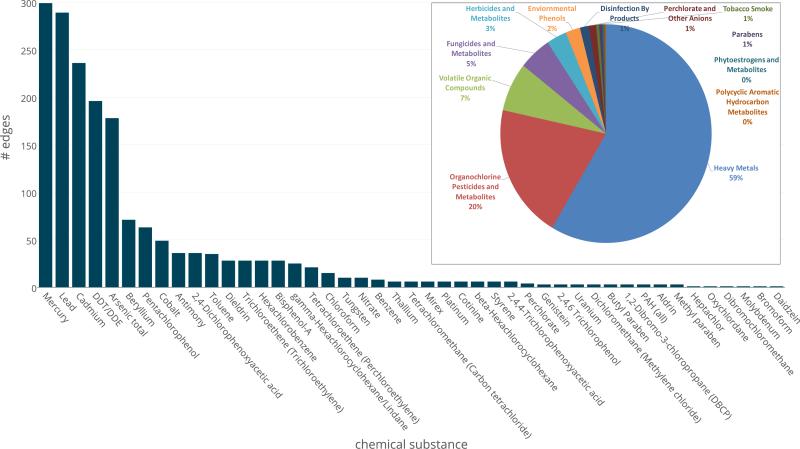
Further study of the individual edges and their distribution reveals that the vast majority of disease pairs are connected by heavy metals (59%), pesticides (20%) or organic compounds (7%). Mercury is potentially a common cause for almost 300 pairs of disorders, closely followed by lead, cadmium, DDT and arsenic. Figure 6 provides the detailed distribution of each substance of amongst the edges of the HPN. In the inset of Figure 6, the pie chart shows the same distribution by chemical agents classification groups, no by individual compound.
Fig. 6.
Distribution of the Chemical Agents among the Edges within the Combined Network. The number of edges connecting two traits for each substance. Inset: the distribution of the substance classification groups among all edges in the combined network.
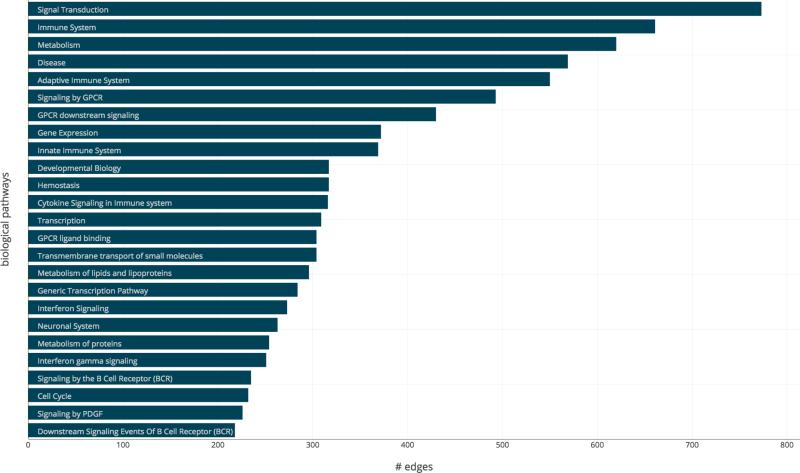
A similar study of the biological pathway edges reveals that the signal transduction, the immune system and metabolism pathways are the most represented. This comes as no surprise because these are “generic” pathways involving hundreds or even thousands of genes, therefore statistically highly probable to be represented more within the network. The complete breakdown of the 25 most represented biological pathways is shown in Figure 7.
Fig. 7.
Distribution of the biological pathways amongst the edges within the combined network. The number of edges connecting two traits for each the top 50 most represented pathways.
Finally, we studied the distribution of biological pathway and chemical agent interactions within the projected network. The heatmap in Figure 8 shows the frequency of co-occurrence (double edge) for chemical substances and pathways between pairs of diseases.
In Figure 8, the biological pathways are approximately sorted by ascending frequency along the Y-axis. The chemical substances are arranged in groups along the X-axis. Heavy metals, in particular lead, cadmium, arsenic and mercury, and a pesticide (DDT) appear to interact with the most biological pathways. To assess the significance of these co-occurrences, we test the statistical probability of each existing pair in a null-model by running a 10,000-fold permutation test on all the edges of the tripartite network. For lack of space, we cannot present these data in detail. The results of the permutation test show that the most represented chemical agent-pathway pairs of have less than a 3% probability of occurring by chance.
4. Qualitative Observations, Biomedical Implications & Discussion
In this study, we integrated genetic and environmental exposure data in a tripartite network to identify interactions between environmental agents and biological pathways. Although the effects of environmental agents on disease have been studied extensively, the mechanisms of exposure are still poorly understood. Using the network approach, we aim to identify specific biological pathways disrupted by environmental agents. Identifying these pathways would not only help to establish more effective, more precise treatment therapies for patients who have been exposed, but can also provide insight to the mechanisms behind complex diseases.
To identify potential exposure-pathway interactions, we analyze overlapping edges in the final integrated HPN. Each edge distinguishes two phenotypes that are associated with the same environmental and genetic risk factors. We conjecture that the number of co-occurrences between pairs of environmental substances and biological pathways is correlated with a higher likelihood of an interaction between substance and pathway involved. Our permutation test shows that due to the combinatorial complexity of our HPN, the statistical probability of having our identified pathway-environment interaction occur by chance is generally below 3%.
The integrated network approach is a novel method for detecting the biological effects of environmental exposures. A better understanding of the molecular processes associated with specific environmental exposures will help in developing targeted molecular therapies for patients who have been exposed to the toxicity of environmental chemicals. We qualitatively analyze the HPN and propose possible biomedical applications. To establish the validity of the HPN, we assess its ability to detect known environmental substance-pathway interactions. To construct the tripartite network, we used epidemiological data that associated environmental exposure and genetic data to phenotypic disease. In order to validate our network and generate new hypotheses, we used distinct publications of cell biology and genetic studies that associate environmental exposure to pathway disruption. There is no overlap between the publications we used to build the network and the publications we used to validate it and generate hypotheses.
Arsenic and signal transduction
Arsenic is a heavy metal toxin found naturally in the soil, minerals, and groundwater. Because of the many health risks it poses for humans, arsenic and its associated molecular mechanisms have been investigated extensively. By now, it is well known that arsenic severely disrupts signal transduction pathways.17,18 Thus, we expect to see arsenic exposure overlap with signal transduction pathways at a high frequency in the HPN. Indeed, arsenic occurred most frequently in conjunction with “signaling by GPCR” and “GPCR downstream signaling”, with a combined 225 co-occurrences and an approximate 1.4% chance co-occurrence, and less than 2.3% chance respectively. Arsenic exposure also had a high number of co-occurrences with more specific signaling transduction pathways such as T-cell receptor signaling (28 co-occurrences, 1% probability)19 and B-cell receptor signaling (36 co-occurrences, 1.2% probability),20 both of which have been supported by scientific literature.
4.1. Generating hypotheses for substance-pathway interactions
Beyond the HPN's capability of replicating recognized environment-pathway interactions, we can further use it to search for undiscovered exposure-pathway interactions and identify possible molecular targets candidates for environmental exposure treatments. We generate hypotheses by first looking for high frequency co-occurrences that are less established in the literature. Pathways that are highly incident on a particular disease are evaluated to establish a possible link between the exposure, biological pathway, and disease using biological knowledge and scientific literature. Using this approach, our integrated HPN can narrow in on plausible exposure-pathway interactions that are worth studying further in order to elucidate the molecular mechanisms involved in environmental toxicity.
Cadmium and cell-cell junction organization
Occupational studies from the 1980s and 1990s suggest that kidney stones, a highly recurrent and hard calcium deposit in the kidneys, are more common among workers exposed to cadmium.21–23 A subsequent study analyzed NHANES data from 1999-2006 and concluded that low levels of exposure to cadmium increase the risk of chronic kidney disease.24 There has been little elucidation of how cadmium contributes to kidney disease, however. We use the combined HPN to generate a hypothesis about which biological pathways are disrupted by cadmium exposure and how they might contribute to kidney disease. We observe on the network that cell-cell junction organization pathway is highly incident on the kidney stones phenotype node. We also observe the cell-cell junction organization pathway occurs most often with cadmium exposure (21 co-occurrences, 0.9% probability). From this, we can hypothesize that cadmium increases risk of kidney stones by obstructing tight junction functionality. Recent studies have provided preliminary support for this hypothesis. A recent study provided evidence that claudin-14, a gene associated with tight junction function, is responsible for a genetic predisposition to kidney stones.25 The study suggested that claudin-14 mutations blocks calcium from entering tight junctions of the kidneys and causes excess calcium to go into urine, leading to kidney stones. Additionally, a literature survey indicates preliminary evidence that cadmium affects the distribution of tight junction proteins.26 These studies suggest that both claudin-14 and cadmium confer risk for developing kidney stones. Using the combined HPN, we identified cell-cell junction pathway disruption as one way cadmium exposure might confer this risk.
Most complex diseases are synergistic outcomes of genetic and environmental effects. In order to develop effective therapies, we must understand the molecular processes modulated by both genetic variants and environmental exposures. The combined HPN provides a method to detect pathways that are disrupted by environmental exposures and proposes potential molecular targets for therapies.
Acknowledgments
This work was supported by the National Institute of Health (NIH) grants R01 EY022300, LM009012, LM010098, AI59694.
References
- 1.Moore JH. Hum Hered. 2003;56:73. doi: 10.1159/000073735. [DOI] [PubMed] [Google Scholar]
- 2.Rooney AA, Boyles AL, Wolfe MS, Bucher JR, Thayer KA. Environ Health Perspect. 2014 Jul;122:711. doi: 10.1289/ehp.1307972. [DOI] [PMC free article] [PubMed] [Google Scholar]
- 3.Goh K-I, Cusick ME, Valle D, Childs B, Vidal M, Barabasi A-L. Proceedings of the National Academy of Sciences. 2007;104:8685. doi: 10.1073/pnas.0701361104. [DOI] [PMC free article] [PubMed] [Google Scholar]
- 4.Darabos C, White MJ, Graham BE, Leung DN, Williams S, Moore JH. BioData Min. 2014 Jan;7:1. doi: 10.1186/1756-0381-7-1. [DOI] [PMC free article] [PubMed] [Google Scholar]
- 5.Newman M. Networks: An Introduction. Oxford University Press, Inc.; New York, NY, USA: 2010. [Google Scholar]
- 6.Wild CP. Cancer Epidemiol Biomarkers Prev. 2005 Aug;14:1847. doi: 10.1158/1055-9965.EPI-05-0456. [DOI] [PubMed] [Google Scholar]
- 7.Darabos C, Desai K, Cowper-Sallari R, Giacobini M, Graham B, Lupien M, Moore J. Inferring human phenotype networks from genome-wide genetic associations. In: Vanneschi L, Bush W, Giacobini M, editors. Evolutionary Computation, Machine Learning and Data Mining in Bioinformatics. Vol. 7833. Springer; Berlin Heidelberg: 2013. pp. 23–34. Lecture Notes in Computer Science. [Google Scholar]
- 8.Darabos C, Grussing ED, Cricco ME, Clark KA, Moore JH. Pac Symp Biocomput. 2015;171 [PubMed] [Google Scholar]
- 9.Li H, Lee Y, Chen JL, Rebman E, Li J, Lussier YA. Journal of the American Medical Informatics Association : JAMIA. 2012 Jan;19:295. doi: 10.1136/amiajnl-2011-000482. [DOI] [PMC free article] [PubMed] [Google Scholar]
- 10.Zhou X, Menche J, Barabasi A-L, Sharma A. Nat Commun. 2014;5 doi: 10.1038/ncomms5212. 06. [DOI] [PubMed] [Google Scholar]
- 11.Darabos C, Harmon SH, Moore JH. Pac Symp Biocomput. 2014;188 [PMC free article] [PubMed] [Google Scholar]
- 12.Suthram S, Dudley JT, Chiang AP, Chen R, Hastie TJ, Butte AJ. PLoS Comput Biol. 2010;6:e1000662. doi: 10.1371/journal.pcbi.1000662. 02. [DOI] [PMC free article] [PubMed] [Google Scholar]
- 13.Barrenas F, Chavali S, Holme P, Mobini R, Benson M. PLoS ONE. 2009;4:e8090. doi: 10.1371/journal.pone.0008090. 11. [DOI] [PMC free article] [PubMed] [Google Scholar]
- 14.Zhou X, Menche J, Barabasi A-L, Sharma A. Nat Commun. 2014;5:4212. doi: 10.1038/ncomms5212. [DOI] [PubMed] [Google Scholar]
- 15.Qiu J, Darabos C, Moore JH. Studying the genetics of complex diseases with ethnicityspecific human phenotype networks: The case of type 2 diabetes in east asian populations. 5th Translational Bioinformatics Conference. 2014 doi: 10.1002/gepi.21964. [DOI] [PMC free article] [PubMed] [Google Scholar]
- 16.Kanehisa M, Goto S. Nucleic Acids Res. 2000 Jan;28:27. doi: 10.1093/nar/28.1.27. [DOI] [PMC free article] [PubMed] [Google Scholar]
- 17.Druwe IL, Vaillancourt RR. Archives of toxicology. 2010;84:585. doi: 10.1007/s00204-010-0554-4. 08. [DOI] [PMC free article] [PubMed] [Google Scholar]
- 18.Kumagai Y, Sumi D. Annu Rev Pharmacol Toxicol. 2007;47:243. doi: 10.1146/annurev.pharmtox.47.120505.105144. [DOI] [PubMed] [Google Scholar]
- 19.Andrew AS, Jewell DA, Mason RA, Whitfield ML, Moore JH, Karagas MR. Environ Health Perspect. 2008 Apr;116:524. doi: 10.1289/ehp.10861. [DOI] [PMC free article] [PubMed] [Google Scholar]
- 20.Cordova EJ, Martinez-Hernandez A, Uribe-Figueroa L, Centeno F, Morales-Marin M, Koneru H, Coleman MA, Orozco L. PLoS One. 2014;9:e88069. doi: 10.1371/journal.pone.0088069. [DOI] [PMC free article] [PubMed] [Google Scholar]
- 21.Elinder CG, Edling C, Lindberg E, Kågedal B, Vesterberg O. British Journal of Industrial Medicine. 1985;42:754. doi: 10.1136/oem.42.11.754. 11. [DOI] [PMC free article] [PubMed] [Google Scholar]
- 22.Scott R, Cunningham C, McLelland A, Fell GS, Fitzgerald-Finch OP, McKellar N. Br J Urol. 1982 Dec;54:584. doi: 10.1111/j.1464-410x.1982.tb13601.x. [DOI] [PubMed] [Google Scholar]
- 23.Järup L, Elinder CG. British Journal of Industrial Medicine. 1993;50:598. doi: 10.1136/oem.50.7.598. 07. [DOI] [PMC free article] [PubMed] [Google Scholar]
- 24.Ferraro PM, Costanzi S, Naticchia A, Sturniolo A, Gambaro G. BMC Public Health. 2010;10:304. doi: 10.1186/1471-2458-10-304. [DOI] [PMC free article] [PubMed] [Google Scholar]
- 25.Gong Y, Renigunta V, Himmerkus N, Zhang J, Renigunta A, Bleich M, Hou J. EMBO J. 2012;31:1999. doi: 10.1038/emboj.2012.49. [DOI] [PMC free article] [PubMed] [Google Scholar]
- 26.Jacquillet G, Barbier O, Rubera I, Tauc M, Borderie A, Namorado MC, Martin D, Sierra G, Reyes JL, Poujeol P, Cougnon M. Am J Physiol Renal Physiol. 2007 Nov;293:F1450. doi: 10.1152/ajprenal.00223.2007. [DOI] [PubMed] [Google Scholar]


