

Abstract
The purpose of this study is to evaluate whether the use of an activity monitor providing feedback has an effect on physical activity (PA) in young men. A population-based sample of 276 conscription-aged (mean = 17.9, SD = 0.7 years) men participated in a 3-month randomized controlled trial in Oulu in 2012. Participants were randomized to an intervention group (INT, N = 137) and a control group (CON, N = 139). INT received a wrist-worn monitor (Polar Active) showing daily activity, and CON received identical monitors without feedback. Main outcome was the change from baseline in objectively measured weekly time spent in moderate-to-vigorous PA (MVPA) and sedentary activity (SED), as assessed by generalized estimation equations (GEE). Other lifestyle factors were assessed by a questionnaire at baseline and at 3 months. Weekly physical activity data (≥ 4 days with ≥ 8 h each) were obtained from 72 (53%) and 90 (65%) men in the INT and CON, respectively. Based on GEE, time spent in MVPA increased (p = 0.012) and SED decreased (p = 0.032) in the INT compared with the CON. During the first 7 weeks, the INT spent on average 1 h less sedentary than the CON (t-test, p < 0.05). During the first week, the INT showed 12 minutes more MVPA compared to the CON (t-test, p = 0.034). Based on questionnaire data, the proportion of the most sedentary men decreased in the INT (Wilcoxon test, 28% vs. 10%, p = 0.029), with no change in the CON (20% vs. 19%, p = 0.546). To conclude, a wrist-worn activity monitor providing feedback had a short-term positive effect on PA and SED in young men.
Trial registration
This is a pilot study for a larger randomized controlled trial registered to the clinical trials register NCT01376986.
Keywords: Accelerometer, Physical activity, Sedentary, Health, Self-monitoring
Highlights
-
•
A population-based sample of 276 young men participated in a 3-month RCT.
-
•
A wrist-worn PA monitor providing feedback had a positive effect on PA behavior.
-
•
A positive change was also found in self-reported PA behavior and fitness level.
Introduction
Evidence for the role of physical activity (PA) on health and well-being has increased recently. PA is positively associated with decreased risk of all-cause mortality and several diseases, and it has been estimated that physical inactivity causes 9% of premature mortality (Lee et al., 2012). Even relatively small increases in overall daily PA have been suggested to be associated with health benefits (Wen et al., 2011). In addition, light PA, such as standing and slow walking, has been shown to have positive effects on health (Carson et al., 2013, Levine, 2007).
According to the current PA recommendations, young people under the age of 18 years should accumulate at least 60 min of moderate-to-vigorous PA (MVPA) daily (World Health Organization, 2010). A majority of young people does not meet these recommendations (Ekelund et al., 2011, Hallal et al., 2012), and after the age of 12 a marked decline in PA seems to occur, especially in Finland where 50% of all primary school children (7–12 years) reach the PA recommendations (Ministry of Social Affairs and Health, Finland, 2013, Telama and Yang, 2000). At the lower secondary level (13–16 years) the proportion was 17% and among the 16- to 19-year-olds 9% only (Ministry of Social Affairs and Health, Finland, 2013).
Sedentary behavior has been suggested to have an independent effect on health irrespective of the amount of PA (Matthews et al., 2012a, Santos et al., 2014, Sisson et al., 2009). In the United States the most sedentary age group was shown to be 16–19 years, spending approximately 60% of their waking hours sitting (Matthews et al., 2008).
It is known that self-reports overestimate the amount of PA and underestimate light activity and sitting (Shephard, 2003, Slootmaker et al., 2009). However self-reports give valuable information concerning the type and context of PA behavior which has been shown to be associated with self-perceived health, especially among active young men (Piko, 2000). A positive association has also been found between self-perceived health and self-perceived fitness (Lamb, 1992).
Previous studies among adults and young people suggest that the self-monitoring of PA with a self-report or pedometer is associated with improved awareness and increase in PA (Bravata et al., 2007, Conroy et al., 2011, Lubans et al., 2009). In addition to feedback of activity, goal setting appears to be an important component of PA interventions (Bravata et al., 2007, Conroy et al., 2011, Lubans et al., 2009). Wearable accelerometer-based activity monitors provide the intensity, frequency, and duration of PA (Matthews et al., 2012b, Trost et al., 2005), but activity monitors can also be used as a motivation method toward a more active lifestyle. Some previous interventions among adults have used accelerometers with feedback to motivate participants and to assess their compliance with program goals (Fitzsimons et al., 2013, Godino et al., 2013). However, to our knowledge, there are no studies on the independent role of continuous feedback provided by accelerometers in PA behavior among young men.
This is a pilot study of a larger multidisciplinary MOPO study (Ahola et al., 2013). MOPO study aims to promote the health and well-being of young men by motivating them to adopt a more active lifestyle through a novel activation method that includes feedback on PA. The aim of the current study is to evaluate whether the use of a wrist-worn PA monitor providing feedback of activity has an effect on PA and sedentary time in a population-based sample of young men. Our hypothesis is that PA monitoring with feedback of activity increases PA in young men.
Material and methods
Design
The study design is a 3-month, parallel group randomized controlled trial in which young men were allocated (allocation ratio 1:1) to receive either no intervention (control group) or objectively measured, continuous feedback on their PA. The primary outcome measure was change in time spent in intensities of MVPA and sedentary activity.
Subjects
The participants were recruited at the annual military call-ups in the city of Oulu in September 2012. In Finland, the call-ups are mandatory for all men the year they reach the age of 18 years. All 1262 young men participating in the call-ups were invited to the study to go through physical performance measurements and fill in a health and lifestyle questionnaire. Finally, 778 men were measured, and 856 filled in the questionnaire, after which all volunteers (N = 276, mean age 17.9, SD 0.7 years) were recruited for a 3-month, randomized controlled physical activity trial.
At the call-ups, the subjects were provided written and oral information about the study, and a written consent was obtained. The study was compiled in accordance to the Declaration of Helsinki. A statement in favor of the study was received from the local Ethics Committee.
Intervention
The participants were randomized to an intervention (n = 137) and a control (n = 139) group. Randomization was performed after recruitment and it was conducted by an assistant who was involved neither in the trial nor in the data collection and analysis. A list of computer-generated random numbers in blocks of 10 was used. Each participant received sequentially the next random assignment in the list. The subjects in the intervention group were given a wrist-worn watch-style PA monitor (Polar Active, Polar Electro, Finland) by default displaying the accumulated daily MVPA time. The time spent on different PA levels, steps, and calories for each day were also available for the user. The control group subjects continued their normal life and they were given otherwise similar but blinded devices providing only the time of day. The trial began immediately after the military call-ups without set routine.
Experimental
Objective measurement of physical activity
PA and sedentary behavior were objectively measured by Polar Active which is a waterproof uniaxial accelerometer with a 21-day memory. The participants in both groups were advised to wear the device on the non-dominating wrist at least for all waking hours and to provide data to the research database through Polar FlowLink® (Polar Electro) at least every 3 weeks. Using sex, age, weight, and height as input, Polar Active calculates the acceleration signals to metabolic equivalents (MET) with the epoch length of 30 s and provides time spent in five activity levels (1–2 MET, 2–3.5 MET, 3.5–5 MET, 5–8 MET, and > 8 MET). Polar Active has been shown to correlate (R2 = 0.74) with the doubly labeled water technique while assessing energy expenditure (EE) over a 7-day military training period (Kinnunen et al., 2012). A high correlation (r = 0.987, p < 0.001) has also been obtained between EE obtained with Polar Active prototype and indirect calorimetry during a 9.7-km hike (Brugniaux et al., 2010).
At least four valid days out of seven were required to be included in the analysis for each week. A valid day consisted of at least 8 h of monitoring. Weekly averages starting from the next day when the monitor was given (7-day averages) were calculated for time spent in MVPA (> 3.5 MET), light PA (2–3.5 MET), and sedentary behaviors (1–2 MET) for both groups.
Physical performance measurements
At the baseline and at the end of the trial, physical performance was measured. Because of the tight call-up day schedule set by the Finnish Defence Forces and the large study population, a convenient but reliable set of measurements was chosen.
Height was measured with a ruler and waist circumference was measured midway between the lowest rib and the iliac crest with an accuracy of 0.5 cm. Body composition (body mass index, fat free mass, body fat percentage) and weight were assessed by bioelectrical impedance assessment using InBody720 (Biospace Co., Ltd., Seoul, Korea). Bilateral maximal isometric grip strength was measured with a dynamometer (SAEHAN Corporation, Korea) (Bohannon, 2012). The subject was standing legs apart and elbow at a 90° angle and was advised to grip the instrument with maximum strength. The best result of two attempts per hand was recorded. The mean value of both hands was used. Polar Fitness Test (Polar Electro, Finland) was used to evaluate aerobic fitness (Väinämö et al., 1996). The test was conducted using FT80 heart rate monitor (Polar Electro, Finland) with the subject resting for 5 min. The test predicts maximal oxygen uptake (ml/kg/min) based on resting heart rate, heart rate variability, gender, age, height, body weight, and self-estimated PA level. Polar Fitness Test has been compared with ergospirometry for measuring aerobic fitness with high correlation (0.96) and high accuracy (mean error 6.5%) (Väinämö et al., 1996). In addition, the method has been shown to associate with both self-perceived fitness and self-reported PA in a large population study (Borodulin et al., 2005, Borodullin et al., 2004).
Questionnaire
At the baseline and at the end of the trial, the participants also filled in a questionnaire inquiring about their health and lifestyle. Daily sitting time in hours while studying, working, transporting, watching TV, reading, computing, etc., was asked separately for leisure time and school or working hours. The total time spent sitting was used in the analysis, excluding values exceeding 24 h. For the self-estimated PA, the participants were asked to select the option that best described their PA level: low (no regular PA, occasional walking, < 0.5 h/week), middle (regular recreational PA or moderate occupational PA, 0.5–2 h/week), high (regular heavy physical exercise, 2–4 h/week), or top (heavy physical exercise at least 5 times a week, > 4 h/week) (Borodulin et al., 2004). Self-perceived physical fitness was assessed by asking “How would you estimate your fitness in comparison with your peers?” The response options were: much worse, slightly worse, similar, slightly better, and much better. Self-perceived health was assessed as: poor, pretty poor, average, pretty good, and good.
Statistical analysis
The results were analyzed with statistics software (SPSS 19 for Windows, SPSS Inc., Chicago, Illinois). A p value below 0.05 was considered statistically significant. The generalized estimation equation (GEE) method was used for primary outcome and standard statistical methods for secondary analyses.
The differences at baseline between the intervention and control groups as well as the study participants and nonparticipants were analyzed using an independent samples t-test for continuous variables and chi-squared test for the categorical variables. A paired samples t-test was used for continuous normally distributed variables (tested for normality with the Kolmogorov–Smirnov test) to compare means within the groups at baseline and after the 3-month trial. The Wilcoxon test was used for continuous but not normally distributed and categorical variables. An independent samples t-test and the Mann–Whitney test were used to analyze the statistical significance of the differences in changes from baseline between the intervention and control groups.
The differences in the changes between the groups during the trial in the weekly average activity were analyzed using multiple linear regression analyses with GEE (Liang and Zeger, 1986). The GEE method is used to estimate the parameters of a generalized linear model with a possible unknown correlation between outcomes (e.g., repeated measurements). GEE analysis deals with the correlations through a working correlation matrix, which was selected to be unstructured. Compared with other methods (e.g., the multivariate analysis of variance), GEE analysis can provide a robust estimate of parameters' standard errors, even when the correlation structure is not specified correctly. In addition, the method is not that sensitive with the missing values and it can be used regardless of the type of the dependent variable (Ghisletta and Spini, 2004). An independent-samples t-test was used to compare the weekly averages between the two groups to see in more detail where the possible differences occur.
Results
A total of 102 (74%) participants in the intervention group and 107 (77%) in the control group completed the study (Fig. 1). Sixty seven participants (24%) did not participate in the final measurements and were excluded from the final analysis.
Fig. 1.
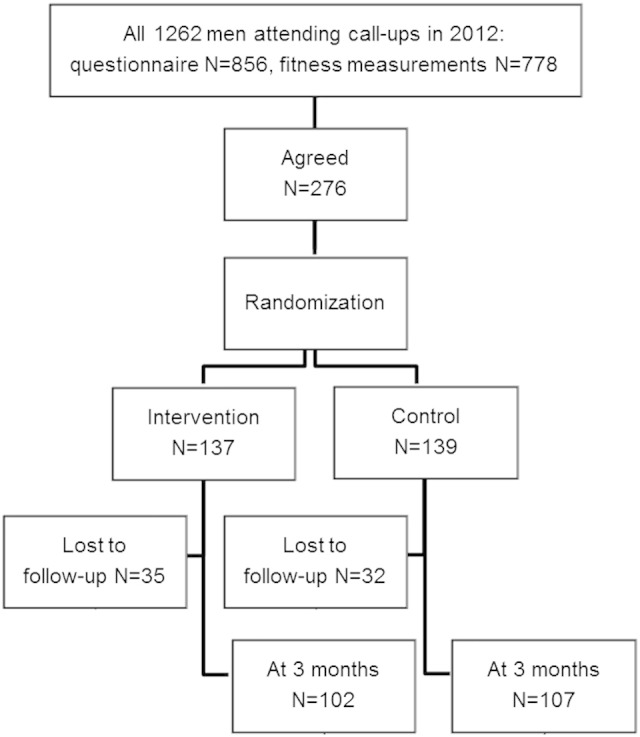
Flow of participants for a 3-month randomized controlled physical activity pilot trial.
The intervention and control groups were similar at baseline in regard to anthropometrics, fitness, self-reported PA and sitting, health, smoking, and alcohol consumption (Table 1). The trial participants differed slightly from those conscription-aged men who went through the fitness measurements (n = 502) and filled in the questionnaire (n = 580) during the call-ups but did not take part in the 3-month trial. The nonparticipants were thinner (− 2.4 kg, 95% CI: − 0.3 kg to − 4.6 kg), less active (24.4% vs. 28.1% had less than 0.5 h of self-reported PA a week, p = 0.02), consumed more alcohol (6.9% vs. 14.4% consumed alcohol at least once a week, p = 0.032), and evaluated their physical fitness and health worse (16.1% vs. 22.2% evaluated fitness to be slightly or much worse than the others, p = 0.027; 2.7% vs. 5.8% evaluated health to be pretty poor or poor, p = 0.005).
Table 1.
Baseline characteristics of the study participants (N = 276).
| Intervention group (n = 137) |
Control group (n = 139) |
pa | |
|---|---|---|---|
| Age, years | 17.9 (0.8) | 18.0 (0.9) | 0.503 |
| Height, cm | 178.7 (6.1) | 177.4 (6.1) | 0.074 |
| Weight, kg | 74.8 (15.0) | 74.6 (15.8) | 0.924 |
| BMI, kg/m2 | 23.2 (4.2) | 23.5 (4.8) | 0.632 |
| Waist circumference, cm | 82.5 (10.3) | 82.8 (11.5) | 0.817 |
| Body fat, % | 16.2 (7.5) | 17.0 (9.0) | 0.456 |
| Fat-free mass, kg | 34.8 (5.0) | 34.3 (4.8) | 0.427 |
| Grip strength (mean), kg | 46.2 (8.2) | 46.9 (8.4) | 0.471 |
| Measured aerobic fitness, ml/min/kg | 52.7 (7.1) | 52.6 (7.6) | 0.857 |
| Self-reported daily sitting, h | 9.9 (2.9) | 9.9 (3.5) | 0.758 |
| Self-reported physical activity; less than 0.5 h a week, n (%) | 36 (26.5) | 31 (22.3) | 0.789 |
| Self-perceived fitness; similar or better than among peers, n (%) | 104 (82.5) | 114 (85.1) | 0.437 |
| Self-perceived health; average, pretty good or good, n (%) | 129 (98.5) | 130 (96.3) | 0.452 |
| Current smoker, n (%) | 34 (28.3) | 27 (20.5) | 0.145 |
| Alcohol use ≥ once a week, n (%) | 13 (10.1) | 5 (3.8) | 0.095 |
Values are mean (SD) unless otherwise specified.
Independent samples t-test or chi-squared test for group difference.
Objectively measured activity data meeting the analysis criteria were obtained from 72 (53%) and 90 (65%) participants of the intervention and control groups, respectively. The total number of valid days was 6132 (87% of all the downloaded data), while the average number of days per person was 33 in the intervention group and 42 in the control group. The average usage time per day was 13.7 and 14.0 h, respectively. Six participants from the intervention group and 10 from the control group did not provide any valid week of data, and they were excluded.
During the trial the average time spent in MVPA was 63 min for the intervention group and 61 min for the control group. The average sedentary times were 9.6 and 10.5 h, respectively. Based on the GEE analysis, MVPA increased (p = 0.012) and sedentary time decreased (p = 0.032) in the intervention group compared with the control group over time (Fig. 2, Fig. 3A). The difference between the groups in sedentary time remained longer than the difference in MVPA. On the first week, the intervention group showed on average 12 minutes more MVPA compared to controls (t-test, p = 0.034, Fig. 2). During the first 7 weeks, the participants in the intervention group spent on average 1 hour less in sedentary activities than the control group (Fig. 3A). There was no difference in the amount of light PA between the groups either by analyzing with the GEE approach (p = 0.688) or by comparing the weekly averages (Fig. 3B).
Fig. 2.

The objectively measured average time spent in moderate-to-vigorous physical activity (MVPA, time spent in > 3.5 METs as measured by Polar Active) during the trial. Weeks represent individual weeks from the baseline performance measurements at the call-ups. The number of participants included to analysis for each week is presented in brackets as (intervention/control). GEE p = 0.012 difference between groups over time. *p < 0.05 (independent samples t-test) for the weekly difference between two groups.
Fig. 3.

The objectively measured average sedentary time (time spent in 1–2 METs as measured by Polar Active) and average time spent in light physical activity (light PA, 2–3.5 METs as measured by Polar Active) during the trial. Weeks represent individual weeks from the baseline performance measurements at the call-ups. The number of participants included to analysis for each week is presented in brackets as (intervention/control). GEE p = 0.032 (sedentary) and p = 0.688 (light physical activity) difference between groups over time. *p < 0.05 and **p < 0.01 (independent samples t-test) for the weekly difference between two groups.
Self-reported PA (p = 0.029) and fitness (p = 0.012) improved within the intervention group, and the differences in changes between the groups from baseline were statistically significant (p = 0.030 and p = 0.012, respectively) (Table 2). The proportion of those participants who spent less than 0.5 h per week in PA decreased from 27.6% to 10.2% in the intervention group. The self-reported daily sitting time decreased from 9.9 to 8.6 h (p = 0.008) in the intervention group, while the change in the control group was from 9.9 to 8.9 h (p = 0.059). There was no difference in the change in measured fitness between the groups. In both groups mean body fat and grip strength increased, the increment of body fat being slightly higher in the intervention group compared to the control group (mean difference 0.6%, 95% CI: 0.0% to 1.2%, p = 0.041). Fat-free mass decreased in both groups (Table 2).
Table 2.
Anthropometrics, physical performance, and self-reported fitness, sitting and physical activity at baseline and at 3 months.
| Intervention group (n = 102) |
Control group (n = 107) |
Mean difference (95% CI) |
||||||
|---|---|---|---|---|---|---|---|---|
| Baseline | 3 months | pa | Baseline | 3 months | pa | pb | ||
| Weight, kg | 74.6 (15.3) | 74.7 (15.0) | 0.836 | 73.5 (15.4) | 73.5 (14.5) | 0.866 | − 0.0 (− 0.7 to 0.7) | 0.993 |
| BMI, kg/m2 | 23.3 (4.5) | 23.3 (4.4) | 0.554 | 23.2 (4.5) | 23.1 (4.2) | 0.392 | 0.1 (− 0.1 to 0.4) | 0.301 |
| Waist circumference, cm | 82.3 (10.5) | 82.0 (10.1) | 0.365 | 82.0 (11.0) | 81.6 (10.2) | 0.161 | 0.1 (− 0.7 to 1.0) | 0.747 |
| Body fat, % | 16.2 (7.7) | 17.4 (7.6) | < 0.001 | 16.2 (8.7) | 16.8 (8.1) | 0.007 | 0.6 (0.0 to 1.2) | 0.041 |
| Fat-free mass, kg | 34.6 (5.2) | 34.2 (5.2) | < 0.001 | 34.3 (4.9) | 34.0 (4.7) | 0.027 | − 0.2 (− 0.5 to 0.1) | 0.208 |
| Grip strength (mean), kg | 45.7 (8.4) | 48.4 (8.4) | < 0.001 | 46.3 (8.6) | 49.0 (9.0) | < 0.001 | 0.2 (− 1.1 to 1.4) | 0.766 |
| Measured aerobic fitness, ml/min/kg | 52.5 (7.3) | 53.0 (6.9) | 0.282 | 53.3 (7.2) | 53.5 (7.3) | 0.666 | 0.3 (− 1.0 to 1.6) | 0.624 |
| Self-perceived fitness, n (%) | 0.012 | 0.223 | 0.012 | |||||
| Much better | 3 (3.6) | 6 (7.2) | 8 (9.6) | 5 (6.0) | ||||
| Slightly better | 26 (31.3) | 30 (36.1) | 24 (28.9) | 22 (26.5) | ||||
| Similar | 40 (48.2) | 33 (39.8) | 37 (44.6) | 42 (50.6) | ||||
| Slightly worse | 10 (12.0) | 13 (15.7) | 11 (13.3) | 12 (14.5) | ||||
| Much worse | 4 (4.8) | 1 (1.2) | 3 (3.6) | 2 (2.4) | ||||
| Self-reported daily sitting, h | 9.9 (2.9) | 8.6 (3.2) | 0.008 | 9.9 (3.5) | 8.9 (4.0) | 0.059 | − 0.3 (− 1.8 to 1.1) | 0.629 |
| Self-reported PA, n (%) | 0.029 | 0.546 | 0.030 | |||||
| > 4 h/week | 6 (6.1) | 8 (8.2) | 10 (9.4) | 9 (8.5) | ||||
| 2–4 h/week | 32 (32.7) | 26 (26.5) | 36 (34.0) | 33 (31.1) | ||||
| 0.5–2 h/week | 33 (33.7) | 54 (55.1) | 39 (36.8) | 44 (41.5) | ||||
| < 0.5 h/week | 27 (27.6) | 10 (10.2) | 21 (19.8) | 20 (18.9) | ||||
Values are mean (SD) unless otherwise specified. PA, physical activity. Bold data indicates statistical significance (p < 0.05).
Paired samples t-test or Wilcoxon test for the change within the group over the study period.
Independent samples t-test or Mann–Whitney test for the mean difference in the change from baseline between the intervention and control groups. For the categorical variables p values describe the change within the distribution of answers.
Discussion
In this study, the use of a wrist-worn physical activity (PA) monitor providing feedback of activity had a short-term positive effect on measured daily PA and sedentary time in a representative sample of young men aged 18 years. A positive change was also found in self-reported PA behavior.
This is one of the first intervention studies conducted among young men in which objective measurement of PA with continuous feedback has been used with the intention to change PA behavior. Previously, in a 3-month trial among adolescents aged 13–17 years, the participants of the intervention group were given accelerometers showing feedback as activity scores (Slootmaker et al., 2010). Among the boys, sedentary time was reduced in the intervention group compared with the control group. The difference in sedentary time between groups (30 h/week) was statistically significant at follow-up after 8 months (Slootmaker et al., 2010). The results support the findings of the current study. However, in contrast to the present study, the participants were relatively inactive adolescents, and the intervention effect was evaluated by self-report only (Slootmaker et al., 2010).
The finding of the present study that the use of activity monitor with feedback had a positive effect on PA behavior is in line with the results of previous studies concerning the effect of self-monitoring on PA. A systematic review found that the use of pedometers increased PA by 2,500 steps per day in adults (Bravata et al., 2007). Similar results have been observed among children and adolescents. It seems that, especially among adolescents, individuals who are less active at the baseline are activated more in pedometer-based interventions (Lubans et al., 2009). The same effect was revealed in the present study in self-reported PA. The proportion of the most inactive men (< 0.5 h/week) decreased by 17% in the intervention group during the trial.
The study participants in both groups met the PA recommendation by achieving approximately 60 minutes of MVPA per day. The proportion is higher than in previous national studies (Ministry of Social Affairs and Health, Finland, 2013). This may be partly explained by the used measurement method. There are challenges when using a wrist-worn monitor in the measurement of daily PA behavior based on EE (Rosenberger et al., 2013, Hildebrand et al., 2014). For example, during sedentary behavior wrist movements may exist without any changes in total EE (Rosenberger et al., 2013). In our study the individuals interested in joining the trial were slightly more active than those who only filled in the questionnaire, which may have affected the MVPA values.
In the intervention group, the positive change in objectively measured sedentary behavior remained longer than the change in MVPA. The result is reasonable while considering that people are sitting for most of their waking hours. The change found in sedentary time is an important finding since sedentary behavior may have an independent impact on health. Spending more than 4 h per day in leisure time sitting is associated with a higher risk of metabolic syndrome, high blood pressure, and low high-density lipoprotein cholesterol level in men (Sisson et al., 2009). Overall, in our study, the average sedentary time of 10 h corresponds well with the earlier finding that adolescents spend 60% of their waking hours sitting (Matthews et al., 2008).
In the current study, self-perceived fitness improved in the intervention group compared with the control group. However, there was no difference in the changes in measured physical fitness. The intervention was not targeted at increasing muscle fitness and may have been too short to reveal changes in measured fitness even if there had been a change in lifestyle. Negative impacts on body fat and fat-free mass may have been influenced by the time of the year. During the trial, autumn turned into cold winter, which might affect PA level and nutritional habits (Tucker and Gilliland, 2007). The increment in grip strength could be partly due to learning effect.
In respect to compliance adolescents and young adults are challenging age-groups (Matthews et al., 2012b, Lee et al., 2013, Troiano et al., 2014). It has been stated that the younger the participant, the lower the compliance (Lee et al., 2013). In the current study, the compliance to provide accelerometer data was 53%, which corresponds with a previous study (Slootmaker et al., 2010). The number of subjects with valid data decreased by almost half until the end of the trial compared with the first week. The compliance could be better with a more advanced download of the activity data (i.e., support for all operating systems). It is likely that some participants used the accelerometer but did not download the data to the database. To increase compliance, a wrist-worn monitor was used because of its user-friendliness (Troiano et al., 2014). The activity data acquired to the database covered the waking hours well, the average usage time being 13.9 h per day.
The main strengths of this study were the sample size and population-based, randomized, controlled design. The study participants were similar to those conscription-aged men who went through the physical measurements and filled in the questionnaire during the call-ups but did not participate in the 3-month study. Only small differences were revealed in weight, daily PA, alcohol consumption, and self-perceived physical fitness and health. Other strengths were the long-term and continuous measurement of PA and sedentary time in both groups during the whole study as well as instant feedback of activity to the intervention group. The majority of studies, with a goal to increase PA or decrease sedentary behavior, have used either self-reports, pedometers, or periodic measurements of PA with accelerometers (e.g., 7-day samples at baseline and follow-up) to reveal the possible changes in PA behavior (Conroy et al., 2011, Fitzsimons et al., 2013, Godino et al., 2013, Kirk et al., 2003).
One limitation in this study is the lack of measured PA before the trial onset. However, there were no differences between the intervention and control groups in PA levels based on self-report at baseline. Moreover, missing activity data may have had some effect on the repeated measures analyses. Due to incomplete data our results may be biased so that physically more active men provided more complete data. However, there was no difference in baseline self-reported physical activity, sitting time, and fitness between those individuals who provided activity data and those who did not. Additionally, because the trial was launched at the military call-ups, some other factors may have motivated young men to increase their daily PA, such as the follow-up performance measurements or the upcoming military service. However, these were similar for both groups and no bias was introduced.
Conclusion
In this study, the use of a wrist-worn physical activity monitor providing feedback had a short-term positive effect on objectively measured daily physical activity and sedentary time in a representative sample of young men aged 18 years. A positive change was also found in self-reported physical activity behavior and self-perceived fitness level. Future research in other target populations is needed.
Conflicts of interest statement
Paula Virtanen is an employee of Polar Electro. All other authors of this paper declare no conflicts of interest.
Acknowledgments
This study was funded by the Ministry of Education and Culture (DNRO 125/627/2009, 98/627/2010, 97/627/2011), Centre for Military Medicine (2/2014, AK14543), Centre for Economic Development, Transport and the Environment of North Ostrobothnia (European Social Fund, project number S11580), the Finnish Funding Agency for Technology and Innovation (European Regional Development Fund, 70037/2010 and 70035/2011), the Northern Ostrobothnia Hospital District (1891/02.05.01.00/2014), and Infotech Oulu. The authors acknowledge the City of Oulu, Virpiniemi Sport Institute, and Finnish Defence Forces for their support.
Contributor Information
Anna-Maiju Jauho, Email: anna.jauho@oulu.fi.
Riitta Pyky, Email: riitta.pyky@odl.fi.
Riikka Ahola, Email: riikka.ahola@oulu.fi.
Maarit Kangas, Email: maarit.kangas@oulu.fi.
Paula Virtanen, Email: paula.virtanen@polar.com.
Raija Korpelainen, Email: raija.korpelainen@odl.fi.
Timo Jämsä, Email: timo.jamsa@oulu.fi.
References
- Ahola R., Pyky R., Jämsä T. Gamified physical activation of young men—a multidisciplinary population-based randomized controlled trial (MOPO study) BMC Public Health. 2013;13:32. doi: 10.1186/1471-2458-13-32. [DOI] [PMC free article] [PubMed] [Google Scholar]
- Bohannon R.W. Hand-held dynamometry: a practicable alternative for obtaining objective measures of muscle strength. Isokinet. Exerc. Sci. 2012;20:301–315. [Google Scholar]
- Borodulin K., Lakka T., Laatikainen T., Laukkanen R., Kinnunen H., Jousilahti P. Associations of self-rated fitness and different types of leisure time physical activity with predicted aerobic fitness in 5979 Finnish adults. J. Phys. Act. Health. 2004;1:142–153. [Google Scholar]
- Borodulin K., Laatikainen T., Lahti-Koski M. Associations between estimated aerobic fitness and cardiovascular risk factors in adults with different levels of abdominal obesity. Eur. J. Cardiovasc. Prev. Rehabil. 2005;12:126–131. doi: 10.1097/00149831-200504000-00006. [DOI] [PubMed] [Google Scholar]
- Bravata D.M., Smith-Spangler C., Sundaram V. Using pedometers to increase physical activity and improve health: a systematic review. J. Am. Med. Assoc. 2007;298:2296–2304. doi: 10.1001/jama.298.19.2296. [DOI] [PubMed] [Google Scholar]
- Brugniaux J.V., Niva A., Pulkkinen I., Laukkanen R.M.T., Richalet J., Pichon A.P. Polar activity watch 200: a new device to accurately assess energy expenditure. Br. J. Sports Med. 2010;44:245–249. doi: 10.1136/bjsm.2007.045575. [DOI] [PubMed] [Google Scholar]
- Carson V., Ridgers N.D., Howard B.J. Light-intensity physical activity and cardiometabolic biomarkers in US adolescents. PLoS ONE. 2013;8 doi: 10.1371/journal.pone.0071417. [DOI] [PMC free article] [PubMed] [Google Scholar]
- Conroy M.B., Yang K., Elci O.U. Physical activity self-monitoring and weight loss: 6-month results of the SMART trial. Med. Sci. Sports Exerc. 2011;43:1568–1574. doi: 10.1249/MSS.0b013e31820b9395. [DOI] [PMC free article] [PubMed] [Google Scholar]
- Ekelund U., Tomkinson G., Armstrong N. What proportion of youth are physically active? Measurement issues, levels and recent time trends. Br. J. Sports Med. 2011;45:859–865. doi: 10.1136/bjsports-2011-090190. [DOI] [PubMed] [Google Scholar]
- Fitzsimons C.F., Kirk A., Baker G., Michie F., Kane C., Mutrie N. Using an individualised consultation and activPAL™ feedback to reduce sedentary time in older Scottish adults: results of a feasibility and pilot study. Prev. Med. 2013;57:718–720. doi: 10.1016/j.ypmed.2013.07.017. [DOI] [PubMed] [Google Scholar]
- Ghisletta P., Spini D. An introduction to generalized estimating equations and an application to assess selectivity effects in a longitudinal study on very old individuals. J. Educ. Behav. Stat. 2004;29:421–437. [Google Scholar]
- Godino J.G., Watkinson C., Corder K. Impact of personalised feedback about physical activity on change in objectively measured physical activity (the FAB study): a randomised controlled trial. PLoS ONE. 2013;8 doi: 10.1371/journal.pone.0075398. [DOI] [PMC free article] [PubMed] [Google Scholar]
- Hallal P.C., Andersen L.B., Bull F.C. Global physical activity levels: surveillance progress, pitfalls, and prospects. Lancet. 2012;380:247–257. doi: 10.1016/S0140-6736(12)60646-1. [DOI] [PubMed] [Google Scholar]
- Hildebrand M., Van Hees V.T., Hansen B.H., Ekelund U. Age-group comparability of raw accelerometer output from wrist- and hip-worn monitors. Med. Sci. Sports Exerc. 2014;46:1816–1824. doi: 10.1249/MSS.0000000000000289. [DOI] [PubMed] [Google Scholar]
- Kinnunen H., Tanskanen M., Kyröläinen H., Westerterp K.R. Wrist-worn accelerometers in assessment of energy expenditure during intensive training. Physiol. Meas. 2012;33:1841–1854. doi: 10.1088/0967-3334/33/11/1841. [DOI] [PubMed] [Google Scholar]
- Kirk A., Mutrie N., MacIntyre P., Fisher M. Increasing physical activity in people with type 2 diabetes. Diabetes Care. 2003;26:1186–1192. doi: 10.2337/diacare.26.4.1186. [DOI] [PubMed] [Google Scholar]
- Lamb K.L. Correlates of self-perceived fitness. Percept. Mot. Skills. 1992;74:907–914. doi: 10.2466/pms.1992.74.3.907. [DOI] [PubMed] [Google Scholar]
- Lee I.-M., Shiroma E.J., Lobelo F. Effect of physical inactivity on major non-communicable diseases worldwide: an analysis of burden of disease and life expectancy. Lancet. 2012;380:219–229. doi: 10.1016/S0140-6736(12)61031-9. [DOI] [PMC free article] [PubMed] [Google Scholar]
- Lee P.H., Macfarlane D.J., Lam T.H. Factors associated with participant compliance in studies using accelerometers. Gait Posture. 2013;38:912–917. doi: 10.1016/j.gaitpost.2013.04.018. [DOI] [PubMed] [Google Scholar]
- Levine J.A. Nonexercise activity thermogenesis—liberating the life-force. J. Intern. Med. (GBR) 2007;262:273–287. doi: 10.1111/j.1365-2796.2007.01842.x. [DOI] [PubMed] [Google Scholar]
- Liang K.Y., Zeger S.L. Longitudinal data analysis using generalized linear models. Biometrika. 1986;73:13–22. [Google Scholar]
- Lubans D.R., Morgan P.J., Tudor-Locke C. A systematic review of studies using pedometers to promote physical activity among youth. Prev. Med. 2009;48:307–315. doi: 10.1016/j.ypmed.2009.02.014. [DOI] [PubMed] [Google Scholar]
- Matthews C.E., Chen K.Y., Freedson P.S. Amount of time spent in sedentary behaviors in the United States, 2003–2004. Am. J. Epidemiol. 2008;167:875–881. doi: 10.1093/aje/kwm390. [DOI] [PMC free article] [PubMed] [Google Scholar]
- Matthews C.E., George S.M., Moore S.C. Amount of time spent in sedentary behaviors and cause-specific mortality in US adults. Am. J. Clin. Nutr. 2012;95:437–445. doi: 10.3945/ajcn.111.019620. [DOI] [PMC free article] [PubMed] [Google Scholar]
- Matthews C.E., Hagströmer M., Pober D.M., Bowles H.R. Best practices for using physical activity monitors in population-based research. Med. Sci. Sports Exerc. 2012;44:S68–S76. doi: 10.1249/MSS.0b013e3182399e5b. [DOI] [PMC free article] [PubMed] [Google Scholar]
- Ministry of Social Affairs and Health, Finland On the move—National strategy for physical activity promoting health and wellbeing 2020. 2013. http://www.stm.fi/c/document_library/get_file?folderId=6511564&name=DLFE-27873.pdf (Available at:) (Accessed May 14 2015)
- Piko B. Health-related predictors of self-perceived health in a student population: the importance of physical activity. J. Community Health. 2000;25:125–137. doi: 10.1023/a:1005129707550. [DOI] [PubMed] [Google Scholar]
- Rosenberger M.E., Haskell W.L., Albinali F., Mota S., Nawyn J., Intille S. Estimating activity and sedentary behavior from an accelerometer on the hip or wrist. Med. Sci. Sports Exerc. 2013;45:964–975. doi: 10.1249/MSS.0b013e31827f0d9c. [DOI] [PMC free article] [PubMed] [Google Scholar]
- Santos R., Mota J., Okely A.D. The independent associations of sedentary behaviour and physical activity on cardiorespiratory fitness. Br. J. Sports Med. 2014;48:1508–1512. doi: 10.1136/bjsports-2012-091610. [DOI] [PubMed] [Google Scholar]
- Shephard R.J. Limits to the measurement of habitual physical activity by questionnaires. Br. J. Sports Med. 2003;37:197–206. doi: 10.1136/bjsm.37.3.197. [DOI] [PMC free article] [PubMed] [Google Scholar]
- Sisson S.B., Camhi S.M., Church T.S. Leisure time sedentary behavior, occupational/domestic physical activity, and metabolic syndrome in U.S. men and women. Metab. Syndr. Relat. Disord. 2009;7:529–536. doi: 10.1089/met.2009.0023. [DOI] [PMC free article] [PubMed] [Google Scholar]
- Slootmaker S.M., Schuit A.J., Chinapaw M.J.M., Seidell J.C., van Mechelen W. Disagreement in physical activity assessed by accelerometer and self-report in subgroups of age, gender, education and weight status. Int. J. Behav. Nutr. Phys. Act. 2009;6:17. doi: 10.1186/1479-5868-6-17. [DOI] [PMC free article] [PubMed] [Google Scholar]
- Slootmaker S.M., Chinapaw M.J.M., Seidell J.C., van Mechelen W., Schuit A.J. Accelerometers and Internet for physical activity promotion in youth? Feasibility and effectiveness of a minimal intervention [ISRCTN93896459] Prev. Med. 2010;51:31–36. doi: 10.1016/j.ypmed.2010.03.015. [DOI] [PubMed] [Google Scholar]
- Telama R., Yang X. Decline of physical activity from youth to young adulthood in Finland. Med. Sci. Sports Exerc. 2000;32:1617–1622. doi: 10.1097/00005768-200009000-00015. [DOI] [PubMed] [Google Scholar]
- Troiano R.P., McClain J.J., Brychta R.J., Chen K.Y. Evolution of accelerometer methods for physical activity research. Br. J. Sports Med. 2014;48:1019–1023. doi: 10.1136/bjsports-2014-093546. [DOI] [PMC free article] [PubMed] [Google Scholar]
- Trost S.G., Mciver K.L., Pate R.R. Conducting accelerometer-based activity assessments in field-based research. Med. Sci. Sports Exerc. 2005;37:S531–S543. doi: 10.1249/01.mss.0000185657.86065.98. [DOI] [PubMed] [Google Scholar]
- Tucker P., Gilliland J. The effect of season and weather on physical activity: a systematic review. Public Health. 2007;121:909–922. doi: 10.1016/j.puhe.2007.04.009. [DOI] [PubMed] [Google Scholar]
- Väinämö K., Nissilä S., Mäkikallio T., Tulppo M., Röning J. Proceedings of the IEEE International Conference on Neural Networks: 3–6 June, 1996; Washington, DC. Vol. 4. 1996. Artificial neural networks for aerobic fitness approximation; pp. 1939–1944. [Google Scholar]
- Wen C.P., Wai J.P.M., Tsai M.K. Minimum amount of physical activity for reduced mortality and extended life expectancy: a prospective cohort study. Lancet. 2011;378:1244–1253. doi: 10.1016/S0140-6736(11)60749-6. [DOI] [PubMed] [Google Scholar]
- World Health Organization Global recommendations on physical activity for health. 2010. http://whqlibdoc.who.int/publications/2010/9789241599979_eng.pdf?ua=1 (Available at:) (Accessed May 14 2015) [PubMed]