

Abstract
Objective. This study identified environmental variables associated with obesity in the adult population of a city in Brazil.
Methods. It was conducted using the Surveillance System for Risk and Protective Factors for Chronic Diseases by Telephone Survey from 2008 to 2010. The body mass index (BMI) was calculated from the participants' self-reported weight and height. Obesity was defined as a BMI ≥ 30 kg/m2. The food establishments, georeferenced areas conducive to physical activity, total income of the neighbourhood, homicide rate and population density were used to characterise the environment. In addition, individual variables were considered. A multilevel logistic regression was performed.
Results. A total of 5273 individuals were evaluated. The odds of obesity was found to be significantly decreased with increases in the number of establishments that sell healthy food, number of restaurants, number of places for physical activity and total income — in different models. In addition, these associations remained significant after adjustment for age, gender, education and consumption of meat with visible fat.
Conclusions. This study contributes to a better understanding of the complex interaction between environmental and individual determinants of obesity and may aid in the development of effective interventions, such as the expansion of obesity control programmes.
Keywords: Multilevel analysis, Obesity, Public health, Telephone survey
Highlights
-
•
We estimated the association of environmental and individual factors with obesity.
-
•
The likelihood of obesity decreased with increases of environmental factors.
-
•
There is a complex interaction between environmental determinants of obesity.
-
•
Our findings provide justification for the development of effective strategies.
Introduction
Obesity is a global problem of epidemic proportions and has significant health consequences, especially in the development and progression of many chronic diseases (Choudhary et al., 2007, Low et al., 2009).
In middle-income countries, surveillance systems have found temporal trends of increasing obesity. Estimates of obesity prevalence reached 14.9, 15.8 and 17.1% for each year from 2010 to 2012, respectively (Brazil, 2010, Gigante et al., 2011).
Traditional measures to reduce obesity focus on changing individual behaviours. However, recent studies show that neighbourhood environment plays an important role in determining chronic diseases in several countries because it may discourage or encourage healthy lifestyles (Janssen et al., 2006, Popkin et al., 2005).
Conceptual shifts in understanding the aetiology of obesity from an ecological perspective have been proposed (Egger and Swinburn, 1997). In addition, studies show that characteristics related to the built (e.g., sports facilities, green areas, and the accessibility and availability of places to purchase healthy foods) and social environments may influence obesity rates, even on a local scale (Chaix et al., 2013).
The context of the urbanisation process in developing countries has been complex, with limitations in management and planning. There is a need for an environmental framework, in addition to biological and behavioural factors, to elucidate obesity-related variables (Kirk et al., 2010, Penney et al., 2013).
The objective of this paper is to estimate the association of environmental and individual factors with obesity in adults in a Brazilian urban context.
Methods
A cross-sectional study was conducted including 5273 adults, aged 18 to 93 years old, who were participants in the Surveillance System for Risk and Protective Factors for Chronic Diseases by Telephone Survey (VIGITEL) from 2008 to 2010 in the city of Belo Horizonte, Minas Gerais. This system interviews individuals aged 18 years old or older every year, in each of the capitals of the 26 Brazilian states and the Federal District. The databases were requested from the Ministry of Health.
The VIGITEL system collects data from individual standardized questionnaires that assess individual variables and protective and risk factors for non-communicable diseases, including sociodemographic characteristics, eating patterns, physical activity, weight, height, and the frequency of cigarette smoking and alcoholic beverage consumption (Brazil, 2010).
Pregnant women (n = 43) and women who did not know whether they were pregnant at the time of the interview (n = 4) were excluded from the analyses. Individuals without body mass index (BMI) data (n = 506) and georeferenced information (n = 208) were also excluded from this study.
For this study, the dependent variable of obesity was defined as a BMI ≥ 30 kg/m2 (World Health Organization/WHO, 2011). The reported weight and height were used to calculate the BMI.
The individual level variables were gender; age in years; education (≤ 8, 9 to 11, or ≥ 12 years of study); marital status (single, married, widowed, or divorced; regular consumption (five or more days a week) of fruits and vegetables; consumption of meat with visible fat; and alcohol, smokers, and inactive behaviours in all domains.
Each participant's residence geographic coordinates (latitude and longitude) were based on their zip code.
The coverage areas (CAs) of the Basic Health Units (BHUs), which are administrative and health units of the public system for the health services in Brazil, were used as neighbourhood units. The city of Belo Horizonte is divided into 148 CAs that belong to nine health districts.
To evaluate the characteristics of the built and social environments within the CAs, we created a database of geocoded information obtained from various commercial and government sources and based on the address of the location.
The environmental variables included the number of restaurants and establishments where healthy foods are available for purchase, public and private places for physical activity, population density, homicide rate, and total income of the CA.
The STATA statistical package (svy function) was used for the statistical analyses. For all analyses, different aspects of the complex sampling design were considered, and the analyses considered the weights of the different probabilities of selection (Brazil, 2010, Carle, 2009).
Because the data structure included individual (level 1) and neighbourhood (level 2) variables, a fixed-effects multilevel logistic regression with random intercept was applied. Estimates of the odds ratio (OR) and 95% confidence interval (95% CI) were used. For all analyses, a 5% significance level was defined.
The median odds ratio (MOR) quantifies the variation in the outcome between clusters while considering the individual variables. The 80% interval odds ratio (IOR) is a measure to quantify the fixed effect of environmental variables (Merlo et al., 2005, Merlo et al., 2006). Additionally, a reduction in variance for level 2 was achieved by introducing individual and environmental variables into the models. The Akaike information criterion (AIC) was used to compare the models.
Oral consent was obtained during the telephone interview, and the objectives of this study were approved by the Ethics Committee of the Ministry of Health and Ethics and Research Committee of the Universidade Federal de Minas Gerais — UFMG (no. 25447414.1.0000.5149).
Results
This study included 5273 individuals, living in 148 CAs, with an average age of 43.67 years (SD = 16.65). A total of 43.51% of participants were male, and 40.24% had 9 to 11 years of education.
The prevalence of obesity was 12.13% (95% CI: 11.20 to 13.12). Fig. 1 shows a variation in obesity prevalence from 0 to 41.94% among coverage areas (Fig. 1).
Fig. 1.
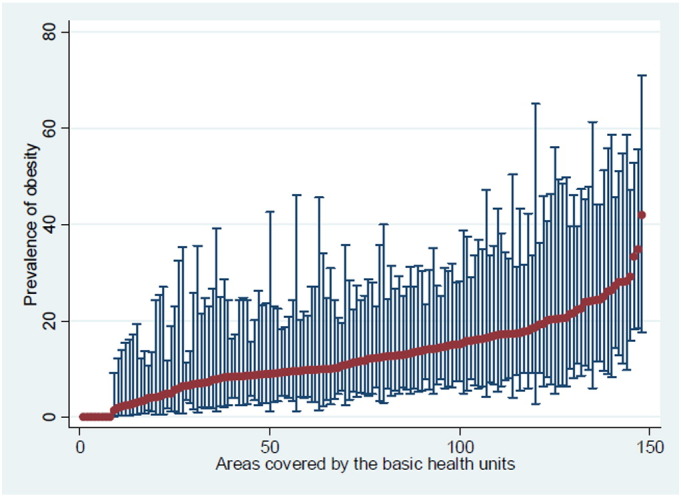
Prevalence of obesity (%) among neighbourhoods.
There was variation in obesity prevalence from 0 to 41.94% among coverage areas (likelihood ratio (LR) test, p = 0.002), defining the hierarchical structure of the data.
In the bivariate analysis, age, education, marital status, eating meat with visible fat, physical activity, number of restaurants, number of establishments selling health food, number of public and private places for physical activity practice, and total income of the neighbourhood were associated with obesity (Table 1, Table 2).
Table 1.
Distribution of individual characteristics based on obesity.
| Characteristics | Obesity |
OR (95% CI) | P value | |
|---|---|---|---|---|
| % | 95% CI | |||
| Gender | ||||
| Male | 11.16 | 9.83–12.65 | – | 0.169 |
| Female | 12.87 | 11.62–14.23 | 1.15 (0.94–1.41) | |
| Agea | 48.48 | 47.30–49.67 | 1.01 (1.01–1.02) | < 0.001 |
| Skin colour | ||||
| White | 11.26 | 9.90–12.77 | – | 0.207 |
| Black | 13.57 | 10.18–17.87 | 1.20 (0.86–1.66) | |
| Brown | 12.59 | 11.29–14.03 | 1.11 (0.93–1.32) | |
| Red | 10.26 | 2.17–37.11 | 0.76 (0.15–3.77) | |
| Yellow | 38.71 | 9.13–79.89 | 4.79 (0.69–33.22) | |
| Education | ||||
| 0 to 8 | 17.09 | 15.14–19.23 | – | < 0.001 |
| 9 to 11 | 10.80 | 9.47–12.29 | 0.59 (0.48–0.72) | |
| 12 or more | 8.87 | 7.45–10.52 | 0.48 (0.38–0.59) | |
| Marital status | ||||
| Single | 7.60 | 6.40–9.00 | – | < 0.001 |
| Married | 14.88 | 13.41–16.48 | 2.11 (1.68–2.66) | |
| Widowed | 17.62 | 12.92–21.13 | 2.43 (1.74–3.39) | |
| Separated/divorced | 14.21 | 10.70–18.63 | 1.97 (1.36–2.85) | |
| Regular consumptionb of fruits and vegetables | ||||
| No | 12.08 | 10.85–13.43 | – | 0.978 |
| Yes | 12.18 | 10.81–13.68 | 1.00 (0.85–1.19) | |
| Consumption of meat with visible fat | ||||
| No | 11.36 | 10.23–12.59 | – | 0.040 |
| Yes | 13.45 | 11.89–15.18 | 1.22 (1.00–1.48) | |
| Smoker | ||||
| No | 12.33 | 11.33–13.41 | – | 0.359 |
| Yes | 10.84 | 8.61–13.56 | 0.87 (0.65–1.18) | |
| Excessive alcohol consumptionc | ||||
| No | 12.39 | 11.34–13.52 | – | 0.350 |
| Yes | 11.17 | 9.34–13.31 | 0.90 (0.71–1.13) | |
| Physically inactived | ||||
| No | 11.74 | 10.75–12.81 | – | 0.041 |
| Yes | 14.26 | 11.84–17.07 | 1.27 (1.01–1.60) | |
5273 individuals of a city of Belo Horizonte, Minas Gerais — 2008 to 2010.
OR — odds ratio; 95% CI — 95% confidence interval.
Mean.
Consumption of five or more days of the week.
Consumption of four or more doses for women and five or more doses for men in a single occasion in the past 30 days.
Did not practice any physical activity during leisure time in the past three months, did not perform heavy physical exertion at work, did not go to work on foot or by bicycle for at least 10 min each way per day, and was not responsible for the heavy cleaning of the house.
Table 2.
Distribution of environmental characteristics based on obesity.
| Characteristics | OR (95% CI) | P value |
|---|---|---|
| Restaurants | 0.98c (0.96–0.99) | < 0.001 |
| Establishments that sell healthy fooda | 0.87c (0.79–0.95) | 0.002 |
| Places for physical activity | 0.88c (0.83–0.93) | < 0.001 |
| Population density (inhabitants/km2) | 1.00c (0.99–1.00) | 0.798 |
| Homicide rate (× 10,000 inhabitants) | 1.24c (0.96–1.61) | 0.105 |
| Total incomeb | 0.96d (0.94–0.98) | < 0.001 |
5273 individuals of a city of Belo Horizonte, Minas Gerais — 2008 to 2010.
OR — odds ratio; 95% CI — 95% confidence interval; SD — standard deviation.
Supermarkets, hypermarkets, establishments specialising in selling fruits and vegetables (stands), and street markets.
Total nominal monthly income of individuals 10 years of age or older within the CA divided by 10,000.
Results for a 10-unit increment.
Result for a 1000-unit increment.
Four multivariate models (Table 3) were constructed. According to Models 1 to 4, for every increase in the number of establishments selling healthy food (OR = 0.88, 95% CI: 0.80 to 0.96), number of restaurants (OR = 0.97, 95% CI: 0.96 to 0.99), number of places for physical activity (OR = 0.89, 95% CI: 0.84 to 0.95), and total income (OR = 0.96, 95% CI: 0.94 to 0.98), the odds of obesity significantly decreases, after adjusting the models for age, gender, education and consumption of meat with visible fat. When compared to the null model, there was a 14.54% reduction in the level 2 variance for individual level variables. In all models, there was a significant reduction in the variance when introducing environmental variables (Table 3).
Table 3.
Multilevel logistic regression models for obesity.
| Variables | Model 1 |
Model 2 |
Model 3 |
Model 4 |
|---|---|---|---|---|
| OR (95% CI) | OR (95% CI) | OR (95% CI) | OR (95% CI) | |
| Establishments that sell healthy foodsa | 0.88c (0.80–0.96)⁎⁎ | – | – | – |
| Restaurants (each 10 units) | – | 0.97c (0.96–0.99)⁎ | – | – |
| Places for physical activity | – | – | 0.89c (0.84–0.95)⁎ | – |
| Total incomeb | – | – | – | 0.96d (0.94–0.98)⁎⁎ |
| Age (years) | 1.01 (1.01–1.02)⁎ | 1.01 (1.01–1.02)⁎ | 1.01 (1.01–1.02)⁎ | 1.01 (1.01–1.02)⁎ |
| Gender | 1.19 (0.97–1.46) | 1.20 (0.97–1.46) | 1.20 (0.97–1.46) | 1.19 (0.97–1.46) |
| Education (years) | ||||
| 9 to 11 | 0.75 (0.60–0.94)⁎⁎⁎ | 0.76 (0.61–0.95)⁎⁎⁎ | 0.77 (0.62–0.96)⁎⁎⁎ | 0.77 (0.62–0.96)⁎⁎⁎ |
| 12 or more | 0.63 (0.50–0.80)⁎ | 0.65 (0.52–0.83)⁎⁎ | 0.67 (0.53–0.86)⁎⁎ | 0.66 (0.52–0.84)⁎⁎ |
| Consumption of meat with visible fat | 1.33 (1.09–1.62)⁎⁎ | 1.33 (1.10–1.62)⁎⁎ | 1.33 (1.09–1.61)⁎⁎ | 1.34 (1.10–1.62)⁎⁎ |
| Relative reduction in variance level 2 with inclusion of variables (%) | ||||
| Individuale | 14.54 | 14.54 | 14.54 | 14.54 |
| Contextualf | 19.68 | 36.91 | 41.40 | 31.56 |
| MOR | 1.28 | 1.24 | 1.23 | 1.26 |
| IOR 80% | 0.61–1.58 | 0.65–1.51 | 0.66–1.48 | 0.65–1.54 |
| AIC | 3786 | 3783 | 3783 | 3785 |
5273 individuals of a city of Belo Horizonte, Minas Gerais — 2008 to 2010.
OR — odds ratio; 95% CI — 95% confidence interval; MOR — median odds ratio; IOR 80% — 80% odds ratio interval; AIC — Akaike information criterion in the model with context variables.
References categories: Gender — male; Education — 0 to 8 years; Consumption of meat with visible fat — no.
P value < 0.001.
P value < 0.01.
P value < 0.05.
Establishments that sell healthy food: supermarkets, hypermarkets, establishments specialising in the sale of fruits and vegetables (stands), and street markets.
Total nominal monthly income for persons aged 10 years or older in the CA divided by 10,000.
Results for a 10-unit increment.
Result for a 1000-unit increment.
Compared to the null model.
Compared to the individual variable model.
The MOR was greater than 1 for all models, indicating differences in obesity among areas. In addition, the IOR had a value of 1 in all models, showing that other context variables are necessary to explain the heterogeneity of the neighbourhoods (Table 3).
We observed a reduction in the AIC after the inclusion of individual-level and context variables in all models of Table 3.
Discussion
This study was conducted with a probabilistic sample of adults within a Brazilian city. In this analysis, increases in the number of establishments that sold healthy foods, the number of public and private places for physical activity, and the total income were characteristics significantly associated with lower odds of obesity. These associations remained significant after adjustment for level 1 variables: age, gender, education, and consumption of meat with visible fat.
This study confirms previous results indicating that the environmental determinants partly explain the variation in health outcomes, i.e., they are a result of a hierarchical structure (Robert and Reither, 2004).
The number of stores selling healthy foods is an indicator of supply in the surrounding neighbourhood because it increases the availability and potentially of the acquisition and consumption of healthier foods, which is associated with lower odds of obesity. These findings have potential applicability to Brazilian urban areas. For example, a positive correlation has been shown between the density of stores specialising in the sale of fruit and vegetables and obesity in São Paulo (Jaime et al., 2011). The higher availability and proximity of supermarkets increase the competition between establishments, which can improve prices, accessibility, and eating behaviour by providing better quality food options (Kamphuis et al., 2006, Mccrory et al., 2002).
In the urban context of this study, approximately 80% of the restaurants are free buffet or limited-service restaurants that serve meals by weight (Sindhorb, 2011). This retail model can minimise the effects of increased consumption of unbalanced meals because it allows the person to make a full meal quickly and with similar cost to a common snack (Jomori, 2006) and when people have the healthier option available, they probably reduce their overall consumption when they are paying by the kilo.
Black et al. (2010) evaluated determinants of obesity in New York City. The authors observed a higher risk of obesity in neighbourhoods with fewer supermarkets and facilities for physical activity and with lower income.
Areas with greater socioeconomic deprivation can encourage unhealthy behaviours in neighbourhoods that discourage physical activity and healthy diets, consequently increasing obesity rates. Recent evidence suggests that the socioeconomic status of the neighbourhood can influence the health of individuals and affect many (if not most) of the factors associated with obesity prevalence through environmental factors, such as access to food stores, healthy restaurants, sports facilities, and parks and the price and availability of healthy foods (Bodor et al., 2010, Monteiro et al., 2010, Victora et al., 2011).
In low-income residential areas with high deprivation levels, the availability of unhealthy products was significantly higher than in other areas. People living in areas of a higher socioeconomic level showed a higher consumption of healthy food. Lower-income neighbourhoods have fewer places for physical activity and a greater incidence of inactive behaviours than higher-income neighbourhoods (Del Duca et al., 2009, Santana et al., 2009); furthermore, a greater odds of developing obesity was exhibited by the population living in these lower-income locations.
In this study, the lowest prevalence of obesity was found in males and in younger individuals — which are consistent with other population-based studies (Ball and Crawford, 2005, Monteiro et al., 2001). Regarding the other individual characteristics, our results are consistent with studies that show association of age, gender, education and food consumption with obesity (Ball and Crawford, 2005, Marques-Vidal et al., 2008, Monteiro et al., 2001, Moreira and Padrão, 2006). Low level of education may hinder the understanding of guidance on promotion and prevention of obesity.
In general, the literature shows a consistent set of associations between the environment and obesity in developed countries. Despite the differences resulting from the historical development process of urban centres and recent modern changes in social and built environments in developmental countries, the conclusions of these studies might be applicable to populations of middle-income countries, such as Brazil.
The results of this research showed robust associations because the study was conducted with a representative sample. Appropriate adjustments for individual-level variables were performed. This method allows the accumulation of evidence that is better suited for the development of intervention strategies for different urban groups.
Some limitations of this study must be acknowledged. It is a cross-sectional study; therefore, the associations reported cannot be identified and/or can be interpreted only as hypothetical causal relations. The use of georeferenced information has a potential bias due to dynamic environmental changes over space and time; however, this type of data has been widely used in similar previous studies. There were a reduced number of participants in some CA-BHUs; however, sensitivity analyses using neighbourhoods with an adequate number of participants were performed. Other limitations refer to the fact that work conditions of the participants are not available and the sample was composed of people living in households with at least one landline telephone. The coverage of landlines in Belo Horizonte is higher than the national average, which reduces possible selection bias (Bernal and Silva, 2009).
Another potential limitation of the study is that obesity was diagnosed based on self-reported weight and height. Thus, undiagnosed cases of obesity may not have been reported because of the tendency to underestimate weight, especially among women, and overestimate height, especially among men. Despite this potential limitation, the use of self-reported weight and height has been widely used in epidemiological studies as an acceptable and valid method for Brazilian adults (Lucca and Moura, 2010).
Conclusion
The results showed that the food environment of the neighbourhood may influence the prevalence of obesity among adults. These data corroborate previous studies of urban settings in developed countries. Thus, addressing the obesity problem will require the development of effective intervention strategies and the expansion of programmes that address aspects of the physical and social environment.
Conflict of interest statement
The authors declare that there are no conflicts of interests.
Acknowledgments
We thank the financial support from Ministry of Health (88) and Thamara Gabriela for her assistance in the standardisation of the present study.
Contributor Information
Fernanda Penido Matozinhos, Email: nandapenido@hotmail.com.
Crizian Saar Gomes, Email: criziansaar@gmail.com.
Amanda Cristina de Souza Andrade, Email: amandasouza_est@yahoo.com.br.
Larissa Loures Mendes, Email: larissalouresmendes@gmail.com.
Milene Cristine Pessoa, Email: milenecpessoa@gmail.com.
Amélia Augusta de Lima Friche, Email: gutafriche@gmail.com.
Gustavo Velasquez-Melendez, Email: guveme@ufmg.br.
References
- Ball K., Crawford D. Socioeconomic status and weight change in adults: a review. Soc. Sci. Med. 2005;60(9):1987–2010. doi: 10.1016/j.socscimed.2004.08.056. (May) [DOI] [PubMed] [Google Scholar]
- Bernal R., Silva N.N. Cobertura de linhas telefônicas residenciais e vícios potenciais em estudos epidemiológicos. Rev. Saude Publica. 2009;43(3):421–426. doi: 10.1590/s0034-89102009000300005. (Set) [DOI] [PubMed] [Google Scholar]
- Black J.L., Macinko J., Dixon L.B. Neighborhoods and obesity in New York City. Health Place. 2010;16:489–499. doi: 10.1016/j.healthplace.2009.12.007. (May) [DOI] [PubMed] [Google Scholar]
- Bodor J.N., Arroz J.C., Farley T.A., Swalm C.M., Rose D. The association between obesity and urban food environments. J. Urban Health. 2010;87(5):771–781. doi: 10.1007/s11524-010-9460-6. (Sep) [DOI] [PMC free article] [PubMed] [Google Scholar]
- Brazil . Ministério da Saúde; Brasília: 2010. Ministério da Saúde. Secretaria de Vigilância em Saúde. Secretaria de Gestão Estratégica e Participativa. Vigitel Brazil 2009. Vigilância de fatores de risco e proteção para doenças crônica por inquérito telefônico. [Google Scholar]
- Carle A. Fitting multilevel models in complex survey data with design weights: recommendations. BMC Med. Res. Methodol. 2009;9:49. doi: 10.1186/1471-2288-9-49. (Jul) [DOI] [PMC free article] [PubMed] [Google Scholar]
- Chaix B. Neighborhood environments, mobility, and health: towards a new generation of studies in environmental health research. Revue d'E' pide'miologie et de Sante' Publique. 2013;61S:S139–S145. doi: 10.1016/j.respe.2013.05.017. (Agu) [DOI] [PubMed] [Google Scholar]
- Choudhary A.K., Donnelly L.F., Racadio J.M., Strife J.L. Diseases associated with childhood obesity. AJR Am. J. Roentgenol. 2007;188(4):1118–1130. doi: 10.2214/AJR.06.0651. (Apr) [DOI] [PubMed] [Google Scholar]
- Del Duca G.F. Associação entre nível econômico e inatividade física em diferentes domínios. Rev. Bras. Ativ. Fís. Saúde. 2009;14:123–131. (Mai/Ago) [Google Scholar]
- Egger G., Swinburn B. An ‘ecological’ approach to the obesity pandemic. Br. Med. J. 1997;315(7106):477–480. doi: 10.1136/bmj.315.7106.477. (Aug) [DOI] [PMC free article] [PubMed] [Google Scholar]
- Gigante D.P. Variação temporal na prevalência do excesso de peso e obesidade em adultos: Brazil, 2006 a 2009. Rev. Bras. Epidemiol. 2011;14(Suppl. 1):157–165. doi: 10.1590/s1415-790x2011000500016. (Set) [DOI] [PubMed] [Google Scholar]
- Jaime P.C. Investigating environmental determinants of diet, physical activity, and overweight among adults in Sao Paulo, Brazil. J. Urban Health. 2011;88(3):567–581. doi: 10.1007/s11524-010-9537-2. (Jun) [DOI] [PMC free article] [PubMed] [Google Scholar]
- Janssen I. Influence of individual and area level measures of socioeconomic status on obesity, unhealthy eating, and physical inactivity in Canadian adolescents. Am. J. Clin. Nutr. 2006;83(1):139–145. doi: 10.1093/ajcn/83.1.139. (Jan) [DOI] [PubMed] [Google Scholar]
- Jomori M.M. Universidade Federal de Santa Catarina; Florianópolis: 2006. Escolha alimentar do comensal de um restaurante por peso. (dissertação) [Google Scholar]
- Kamphuis C.B.M., Giskes K., De Bruijn G.-J., Wendel-Vos W., Brug J., Van Lenthe F.J. Environmental determinants of fruit and vegetable consumption among adults: a systematic review. Br. J. Nutr. 2006;96(4):620–635. (Out) [PubMed] [Google Scholar]
- Kirk S.F.L., Penney T.L., T-Lf Mchugh. Characterizing the obesogenic environment: the state of the evidence with directions for future research. Obes. Rev. 2010;11(2):109–117. doi: 10.1111/j.1467-789X.2009.00611.x. (Feb) [DOI] [PubMed] [Google Scholar]
- Low S., Chin M.C., Deurenberg-Yap M. Review on epidemic of obesity. Ann. Acad. Med. Singap. 2009;38(1):57–65. (Jan) [PubMed] [Google Scholar]
- Lucca A., Moura E.C. Validity and reliability of self-reported weight, height and body mass index from telephone interviews. Cad. Saúde Pública. 2010;26(1):110–122. doi: 10.1590/s0102-311x2010000100012. (Jan) [DOI] [PubMed] [Google Scholar]
- Marques-Vidal P. Prevalence of obesity and abdominal obesity in the Lausanne population. BMC Public Health. 2008;8(330) doi: 10.1186/1471-2458-8-330. (Sept) [DOI] [PMC free article] [PubMed] [Google Scholar]
- Mccrory M.A., Suen V.M.M., Roberts S.B. Biobehavioral influences on energy intake and adult weight gain. J. Nutr. 2002;132(12):3830S–3834S. doi: 10.1093/jn/132.12.3830S. (Dez) [DOI] [PubMed] [Google Scholar]
- Merlo J., Chaix B., Yang M., Lynch J., Ràstam L. A brief conceptual tutorial on multilevel analysis in social epidemiology: interpreting neighbourhood differences and the effect of neighbourhood characteristics on individual health. J. Epidemiol. Community Health. 2005;59:1022–1029. doi: 10.1136/jech.2004.028035. (Dez) [DOI] [PMC free article] [PubMed] [Google Scholar]
- Merlo J., Chaix B., Ohlsson H. A Brief Conceptual Tutorial of Multilevel Analysis in Social Epidemiology: using measures of clustering in multilevel logistic regression to investigate contextual phenomena. J. Epidemiol. Community Health. 2006;60(4):290–297. doi: 10.1136/jech.2004.029454. (Apr) [DOI] [PMC free article] [PubMed] [Google Scholar]
- Monteiro C.A., Conde W.L., Popkin B.M. Independent effects of income and education on the risk of obesity in the Brazilian adult population. J. Nutr., Rockville. 2001;131(3):881–886. doi: 10.1093/jn/131.3.881S. (Mar) [DOI] [PubMed] [Google Scholar]
- Monteiro C.A., Gomes F.S., Cannon G. The snack attack. Am. J. Public Health. 2010;100(6):975–981. doi: 10.2105/AJPH.2009.187666. (Jun) [DOI] [PMC free article] [PubMed] [Google Scholar]
- Moreira P., Padrão P. Educational, economic and dietary determinants of obesity in Portuguese adults: a cross-sectional study. Eat. Behav. 2006;7(3):220–228. doi: 10.1016/j.eatbeh.2005.08.008. (Aug) [DOI] [PubMed] [Google Scholar]
- Penney T.L. A spatial analysis of community level overweight and obesity. J. Hum. Nutr. Diet. 2013;27:65–74. doi: 10.1111/jhn.12055. (May) [DOI] [PubMed] [Google Scholar]
- Popkin B., Duffey K., Gordon-Larsen P. Environmental influences on food choice, physical activity and energy balance. Physiol. Behav. 2005;86(5):603–613. doi: 10.1016/j.physbeh.2005.08.051. (Dec) [DOI] [PubMed] [Google Scholar]
- Robert S.A., Reither E.N. A multilevel analysis of race, community disadvantage, and body mass index among adults in the US. Soc. Sci. Med. 2004;59(12):2421–2434. doi: 10.1016/j.socscimed.2004.03.034. (Dec) [DOI] [PubMed] [Google Scholar]
- Santana P., Santos R., Nogueira H. The link between local environment and obesity: a multilevel analysis in the Lisbon Metropolitan Area, Portugal. Soc. Sci. Med. 2009;68(4):601–609. doi: 10.1016/j.socscimed.2008.11.033. (Feb) [DOI] [PubMed] [Google Scholar]
- Sindhorb . 2011. Union Hotel, Restaurants and Bars Belo Horizonte Similar and Metropolitan Region. [Google Scholar]
- Victora C.G. Health conditions and health-policy innovations in Brazil: the way forward. Lancet. 2011;377(9782):2042–2053. doi: 10.1016/S0140-6736(11)60055-X. (Jun) [DOI] [PubMed] [Google Scholar]
- World Health Organization/WHO . Vol. 311. 2011. Obesity and overweight. (Mar. Disponível em: < http://www.who.int/mediacentre/factsheets/fs311/en/>. Acesso em: 17 março) [Google Scholar]