

Abstract
Peripherin/rds (p/rds), an integral membrane protein from the transmembrane 4 (TMF4) superfamily, possesses a multi-functional C-terminal domain that plays crucial roles in rod outer segment (ROS) disk renewal and structure. Here, we report that the calcium binding protein calmodulin (CaM) binds to the C-terminal domain of p/rds. Fluorescence spectroscopy reveals Ca2+-dependent association of CaM with a polypeptide corresponding to the C-terminal domain of p/rds. The fluorescence anisotropy of the polypeptide upon CaM titration yields a dissociation constant (KD) of 320 ± 150 nM. The results of the fluorescence experiments were confirmed by GST-pull down analyses in which a GST-p/rds C-terminal domain fusion protein was shown to pull down CaM in a calcium-dependent manner. Moreover, molecular modeling and sequence predictions suggest that the CaM binding domain resides in a p/rds functional hot spot, between residues E314 and G329. Predictions were confirmed by peptide competition studies and a GST-p/rds C-terminal domain construct in which the putative Ca2+/CaM binding site was scrambled. This GST-polypeptide did not associate with Ca2+/CaM. This putative calmodulin domain is highly conserved between human, mouse, rat, and bovine p/rds. Finally, the binding of Ca2+/CaM inhibited fusion between ROS disk and ROS plasma membranes as well as p/rds C-terminal-domain-induced fusion in model membrane studies. These results offer a new mechanism for the modulation of p/rds function.
Photoreceptor peripherin/rds (p/rds1) and the non-glycosylated homologue ROM-1 belong to a growing and increasingly complex family of proteins, the tetraspanins (also known as the TMF4 (transmembrane 4 superfamily)) (1, 2). P/rds shares 41% sequence homology with NET-7, its closest TMF4 relative (3, 4). These tetra-spanning proteins have a short cytoplasmic N-terminal region and a large hydrophilic extracellular loop (EC2) with several distinctive cysteine motifs necessary for intra and intermolecular disulfide bonding (1, 3–6) as well as a cytoplasmic C-terminal region. P/rds functions as an oligomer, a common theme in tetraspanin assembly and function (1, 5). Localized at the disk rim in the retinal rod outer segment (ROS) (7), p/rds is unique in this protein family in that it contains the largest and most functionally diverse C-terminal region (PerCter). Shown to be intrinsically disordered in solution (4), the PerCter contains a localization sequence required to target p/rds-containing vesicles to the outer segment (OS) (8, 9), an incisure-affinity domain (9), a membrane fusion domain (10–12), and a melanoregulin (MREG) binding domain (13). Additionally, the PerCter interacts with the β-subunit of the cGMP-gated channel (cNG channel) (14) via the N-terminal glutamic acid rich protein (GARP) domain. This growing body of evidence suggests that the PerCter confers multiple functionalities on p/rds.
In photoreceptors, p/rds is required for normal OS structure (15). Photoreceptor rod cells maintain a constant length and normal physiological function through a circadian rhythm-dependent renewal process (16, 17). Old disks are phagocytosed from the apical tip of the ROS, and newly emerging disks are created from evaginations of the plasma membrane at the base of the ROS (18). At the apical tip of the ROS, p/rds is postulated to be a component of a Ca2+-dependent fusion complex necessary for disk shedding and phagocytosis (18, 19). At the base of the ROS, p/rds is necessary for disk closure during morphogenesis (9, 18, 20). Thus, not only is p/rds multifunctional but also likely regulated by specific protein–protein interactions that differ along the length of the ROS.
On the extradiskal side of the disk rim, p/rds acts as a tethering protein, binding to the cNG channel of the ROS plasma membrane (PM) through GARP. Decreases in free calcium following illumination initiate multiple feedback mechanisms that contribute to light adaptation and photo-recovery (21, 22). These mechanisms typically involve calcium-binding proteins that sense and respond to small changes in free intracellular calcium levels. ROS calmodulin (CaM) is one such protein. One target of ROS CaM is the β-subunit of the cNG channel, located in the plasma membrane and linked to the disk rim through p/rds (23, 24). CaM binds to the N-terminal binding site of the β-subunit of the cNG channel (Kd = 21 nM), thereby modulating cGMP affinity (25). Low calcium levels cause the dissociation of CaM from the cNG channel, increasing the sensitivity of the channel for cGMP. However, modulation of channel sensitivity via CaM is small (26–28). CaM has also been shown to localize to incisures of Xenopus in areas enriched in acetylated tubulin (29).
Because localization of p/rds to the disk rim is required to stabilize ROS structure and align cNG channels, and p/rds mediates fusion through an interaction with the cytosolic surface of the ROS plasma membrane to the disk rim, we tested the hypothesis that Ca+2/CaM binds to the multifunctional PerCter. In this study, we used steady-state tryptophan fluorescence to detect the association of PerCter with Ca+2/CaM, quenching of tryptophan fluorescence to detect the sequestration of tryptophans when bound to Ca+2/CaM, fluorescence anisotropy to measure the binding constant of PerCter to Ca+2/CaM, and GST pull-down assays to verify PerCter binding to Ca+2/CaM. An initial analysis of the homology between the baa17 polypeptide, a synthetic tight-binding inhibitor of Ca2+/CaM (30, 31), and bovine p/rds revealed a possible CaM binding site within the PerCter. Scrambling of the putative Ca2+/CaM binding site on PerCter eliminated binding. Ca2+-dependent binding of CaM to p/rds could offer a means for modulating p/rds function because Ca2+/CaM binding was shown to inhibit one of those functions of p/rds, membrane fusion.
MATERIALS AND METHODS
Materials
CaM from bovine brains was obtained from Sigma (St. Louis, MO) and reconstituted in 10 mM MOPS or 10 mM Na2PO4 buffer at pH 7.2, with 1 mM or 10 mM CaCl2. The concentration of Ca2+/CaM was determined by absorbance at 275 nm using a molar extinction coefficient of 3300 M−1 cm −1 (32). Mouse monoclonal anti-CaM antibody was purchased from Sigma. CaM conjugated with Alexa Fluor 488 (Alexa Fluor 488CaM) was purchased from Molecular Probes (Eugene, OR) and reconstituted in PBS at pH 7.4 at 20 μg/11 μL. Phospholipids were purchased from Avanti Polar Lipids (Birmingham, AL). PP-5 and PP-3 peptides were synthesized by Quality Control Biochemicals (Hopkinton, MA). N-(7-Nitro-2,1,3-benzoxadiazol-4-yl) phosphatidylethanolamine (NBD-PE), N-(lissamine rhodamine B sulfonyl) phosphatidylethanolamine (Rh-PE), and octadecylrhodamine B chloride (R18) were purchased from Molecular Probes (Eugene, OR).
Expression and Purification of GST-Polypeptides
Glutathione S-transferase (GST)-fusion proteins encoding the bovine 63 amino acid PerCter (GST-PerCter, R284–G346), a “scrambled” bovine p/rds C-terminal domain of p/rds (GST-Scr. Helix), the bovine p/rds cytoplasmic N-terminal domain (GST-PerNter, M1–S27), and the bovine ROM-1 C-terminal domain (ROM-1Cter, R288–A351)(Table 1) were prepared as described in detail elsewhere (33). The generation of the GST-PerCter construct as well as the expression and purification of this fusion protein have been described previously (12). Briefly, E. coli BL21 (DE3) cells transformed with each respective GST-polypeptide construct in a pGEX-2T vector (12, 34) were grown in LB medium containing 50 μg of ampicillin/mL. Cells were harvested 2 h after induction with 0.1 mM of isopropyl-β-D-thiogalactopyranoside (IPTG), spun down, washed in PBS, and sonicated in the presence of 0.1% Triton X-100 in PBS at pH 7.2. Cellular debris was removed by centrifugation, and the GST-polypeptides were purified utilizing GST affinity columns from Amersham Biosciences (Piscataway, NJ). The full-length GST-polypeptides were eluted with reduced glutathione in GST binding buffer in PBS at pH 7.4, 8 mM DTT, and 0.1% Triton X-100 according to the manufacturer’s specifications for the GST-pull down assays. The final GST-polypeptide concentrations were determined by Lowry protein assays. The GST-polypeptides were used within 24 h after preparation for the GST pull-down and fusion assays.
Table 1.
Polypeptide Sequences
| PerCter | 284 – RYLHTAL EGMANPEDPE CESEGWLLEK SVPETWKAFL ESVKKLGKGN QVEAEGEDAG QAPAAG – 346 |
| Scr. Helix | 284 – RYLHTAL EGMANPEDPE CESEGWLLEK SVPEAWGATL ESVKKLGKDN YVEAEGEDAG QAPAAG – 346 |
| PerNter | 1 – MALLKVKFDQ KKRVKLAQGL WLMNWFS – 27 |
| ROM-lCter | 287 – RYLQ TALEGLGGVI DGEGEAQGYL FPAGLKDMLK TAWLQGAGPH RPAPGETPPE EKPPKECLPE A – 351 |
Column-bound GST-PerCter and GST-Scr. Helix were additionally eluted via thrombin cleavage (10 U of thrombin per mg of protein) for fluorescence studies. The GST-polypeptide constructs were engineered with thrombin cleavage sites immediately upstream of the polypeptide-encoding regions. Following cleavage, residual Triton X-100 was removed with Bio-Beads SM2 from Bio-Rad (Hercules, CA). The samples were dialyzed into 10 mM Na2PO4 or 10 mM MOPS buffer at pH 7.3, 1 mM CaCl2, and 100 mM KCl using a Pierce (Rockford, IL) 3,500 molecular weight-cutoff Slide-a-Lyzer. The PerCter and Scr. Helix concentrations were determined by absorbance at 280 nm using molar extinction coefficients of 12780 and 14060 M1 cm −1, respectively. The molar extinction coefficients at 280 nm were calculated on the basis of the number of tryptophan, tyrosine, and cystine residues present (35).
Fluorescence Spectroscopy
Steady-state fluorescence, fluorescence quenching, fluorescence anisotropy, and membrane fusion studies utilized L-format Perkin-Elmer (Wellesley, MA) LS 50B or LS55B luminescence spectrometers. Fluorescence anisotropy experiments were additionally performed on a T-format HORIBA Jobin Yvon (Edison, NJ) SPEX FluoroMax-3 spectrofluorometer. For all tryptophan fluorescence measurements, a 10 mm path length Spectosil quartz cuvette from Starna Cells, Inc. (Atascadero, CA) was used. All buffers were filtered through a 0.22 μm Millex-GV sterile filter unit from Millipore (Billercia, MA).
Steady-State Fluorescence
Fluorescence emission spectra of 10 μM PerCter in 10 mM HEPES at pH 7.3 and 100 mM KCl with either 10 mM CaCl2 or 4 mM ethyleneglycol-bis-(β-amino-ethyl ether) N,N′-tetra-acetic acid (EGTA) were recorded. Subsequently, spectra of an equimolar mixture of 10 μM PerCter and 20 μM CaM in the corresponding buffers were also obtained. Spectra of 10 μM Scr. Helix and 10 μM Scr. Helix with 20 μM CaM were recorded in 10 mM HEPES at pH 7.3, 100 mM KCl, and 10 mM CaCl2. All samples were excited at 295 nm, and emission spectra were recorded from 310 −450 nm. The excitation and emission band passes were 3 and 5 nm, respectively. The resulting spectra were corrected for background fluorescence and dilution. As a control to ensure negligible contributions from CaM to the PerCter fluorescence, spectra were recorded for 20 μM Ca2+/CaM and were indistinguishable from the buffer baseline.
Fluorescence Quenching
Iodide quenching experiments were performed essentially as described (36). Briefly, a solution of 10 μM PerCter, 20 μM CaM, 10 mM HEPES at pH 7.3, 100 mM KCl, and 10 mM CaCl2 was titrated with a stock solution of 10 mM HEPES at pH 7.3, 100 mM KI, 10 mM CaCl2, and 1 mM Na2S2O3. All quenching experiments were performed at room temperature. The ionic strength remained constant throughout the titration, and the reducing agent Na2S2O3 was used to prevent triiodide (I3−) formation. Samples were excited at 295 nm and spectra were recorded from 310–450 nm. The excitation and emission bandpasses were 3 and 5 nm, respectively. The resulting spectra were corrected for background fluorescence and dilution. The absorbance at 295 nm of KI was measured at each concentration and found to be negligible, ensuring no inner-filter from KI. The data were integrated from 310–450 nm and plotted according to the Stern–Volmer equation:
where Fo is the area under the unquenched fluorescence spectrum, F is the area under the fluorescence spectrum at quencher concentration Q, Kq is the bimolecular quenching constant, and To is the lifetime of the fluorophore (37).
Fluorescence Anisotropy and KD Determination
To characterize the PerCter–CaM interaction, we utilized steady-state fluorescence anisotropy. A 2 μM PerCter solution was titrated with a 20 mM CaM stock solution in 10 mM HEPES at pH 7.3, 10 mM CaCl2, and 50 mM NaCl. Experiments performed in other buffers showed no significant differences in the dissociation constant. Samples were excited at 295 nm at a constant temperature of 25 ± 0.1 °C, maintained using a NESLAB RTE-7 circulating water bath from Thermo Electron Corp. (Newington, NH). Fluorescence emission was recorded at 340 nm with an integration time of 1 s. The excitation polarizer was set at 0° and the emission polarizer set at 55°. The excitation and emission band passes were 2 and 10 nm, respectively.
The fraction of PerCter bound to Ca2+/CaM was determined from the anisotropy through the following equation:
where fB is the fraction bound, rF and rB are the anisotropies of the free and bound PerCter, respectively, r is the observed anisotropy, and R is the ratio of intensities of the free and bound PerCter (FB/FF) (37). The rB was determined by fitting the anisotropy titration to the equation for a one-binding-site hyperbola using Prism 3.0a software from GraphPad Software, Inc. (San Diego, CA). The fB was calculated, plotted versus [Ca2+/CaM], and fit to a one-binding-site hyperbola to determine the disassociation constant, KD.
GST Pull-Down Assays
GST pull-down assays were performed essentially as described (38). The GST-polypeptides were attached to BaculoGold glutathione agarose beads from BD Biosciences (San Jose, CA) in GST-binding buffer, PBS at pH 7.4, 8 mM DTT, and 0.1% Triton X-100, according to the manufacturer’s specifications. After overnight incubation at 4 °C, the beads were washed 5× in GST-binding buffer and incubated with 90 μg (20 μg/11 μL) of Alexa Fluor 488CaM reconstituted in PBS at pH 7.4. Alexa Fluor 488-CaM was incubated with the GST-polypeptides under low calcium, 0.1 μM, or high calcium levels, 1.0 mM. Following overnight incubation at 4 °C, beads were washed, and proteins were eluted with 1 mL of 10 mM reduced glutathione in 50 mM Tris-HCl at pH 8.0. In the peptide competition studies, non-labeled CaM was preincubated with either PP-5 or PP-3 for 30 min at 37 °C prior to incubation with the GST-polypeptide. PP-5 and PP-3 are peptides corresponding to the previously reported p/rds helical fusion domain, V312-L326, and a p/rds non-fusogenic region, V332–G346, respectively (10, 12). Samples were concentrated and proteins analyzed on 12% SDS–PAGE and by Western blotting. Gels were visualized on a Kodak Image Station 440 CF using a conventional FITC filter. Western blots were probed with mouse monoclonal anti-RDS antibody mAb 2B6 (a gift from Dr. R. Molday) or anti-CaM antibody.
R18 Fusion Assays
Bovine ROS disk and plasma membranes were prepared for fusion assays as described previously (19). Fusion between R18-labeled OS plasma membrane vesicles and target membranes was carried out as previously described (39). Briefly, ROS plasma membrane isolated using ricin-agarose (40) was labeled with self-quenching concentrations (3–5 mol % relative to phospholipid) of R18 as described (19). The R18-labeled plasma membrane (R18-PM, 50 μL of 1 mg/mL total phosphate) was added to 3.0 mL of disk membrane suspension (1 mg/mL rhodopsin). The increase in R18 fluorescence intensity as the PM fuses with the disk membranes was measured over time. A linear increase was observed for up to 30 min at 37 °C. In the inhibition studies, disk membrane suspensions were preincubated with 1 nM to 10 mM Ca2+/CaM at 37 °C for 30 min prior to the addition of R18-PM and the initiation of fusion. In the present studies, fusion is calculated as percent fusion, determined as the percent difference in the initial rate of fusion between control samples and those containing fusion inhibitor. Fusion kinetics was determined as described (10, 41–43), with the lag time corresponding to time before an increase in R18 fluorescence, the latter indicative of membrane mixing and fusion (39).
Vesicle Preparation
Phosphatidylcholine (PC), phosphatidylserine (PS), and cholesterol (Chol) were co-solubilized in chloroform in a 4:4:1 molar ratio, dried under N2, and lyophilized. Large unilamellar vesicles (LUVs) were prepared by extrusion essentially as described (44). Briefly, dried lipid films were lyophilized for 4 h, and the resulting film was resuspended in 5 m HEPES and 100 m NaCl (pH 7.4). The lipid dispersions were subjected to 10 freeze–thaw cycles in liquid nitrogen prior to 10 extrusion cycles. Extrusions were performed with a Nucleopore filtration device through either a membrane of 0.1 or 0.4 μm, depending on the types of assays. Phosphate was determined as described by Bartlett (45) and modified by Litman (46).
Resonance Energy Transfer (RET) Assay Depicting Membrane Mixing
The fusion between PC/PS/CHOL vesicles containing the fluorescent probes NBD-PE and Rh-PE was monitored as a mixing of membrane components using a fluorescence resonance energy transfer method as described originally in ref 47 (47). Using a mixture of fluorescently labeled and unlabeled vesicles, the assay is based on the dilution of a resonance energy transfer pair, Rh-PE and NBD-PE. Dilution due to membrane lipid mixing results in an increase in NBD-PE fluorescence. Vesicles containing 0.6% (mol %) Rh-PE and 0.6% (mol %) NBD-PE were mixed with unlabeled vesicles in a 1:1 molar ratio. At this concentration of fluorophores, NBD-PE fluorescence increases linearly with the dilution of the probe. Emission of NBD fluorescence was monitored at 530 nm, with the excitation wavelength set at 465 nm (NBD excitation).
RESULTS
Steady-State Fluorescence
Intrinsic tryptophan fluorescence is highly sensitive to the polarity of its environment and has been extensively used to study peptide–CaM interactions (36, 48–52). Because CaM does not possess any tryptophan residues (53), any observed Trp fluorescence would arise solely from the peptide in question. The p/rds C-terminus contains two Trp residues, W306 and W316. An increase in fluorescence emission intensity and a blue shift in emission maximum relative to the control would be consistent with the Trp residues moving from a polar environment such as water to a less polar environment such as being sequestered from water within a protein binding site (37).
Solutions of 10 μM PerCter alone and after the addition of 20 μM Ca2+/CaM were excited at 295 nm, and fluorescence emission spectra were recorded. Upon the addition of Ca2+/CaM, there was a 35% increase in the fluorescence intensity at 340 nm compared to the PerCter alone. Additionally, the λmax of the PerCter emission upon CaM addition shifted from 352 to 344 nm (Figure 2A). In the presence of 4 mM EGTA, there was no significant change in the emission spectrum of the PerCter upon the addition of CaM (Figure 2B). The fluorescence emission spectrum of 20 μM Ca2+/CaM was indistinguishable from the buffer, and the addition of the fluorescence emission spectra of Ca2+/CaM and of the PerCter showed no significant difference from that of the PerCter alone. The blue-shifted λmax and the increase in fluorescence intensity of the peptide in the presence of Ca2+/CaM are consistent with a calcium-dependent PerCter–Ca2+/CaM complex formation (30, 49, 50). Previous analysis of steady-state fluorescence emission from Trp-bearing Ca2+/CaM binding peptides report similar λmax values for the free peptide and blue-shifts ranging from 20 to 30 nm (30, 49, 51) after CaM addition. The somewhat smaller blue shift of 8 nm may suggest that both tryptophans in the PerCter are not fully sequestered from the polar solvent by binding (37). Taken together, these results suggested that at least one Trp within the PerCter was sequestered from the aqueous buffer in the presence of calcium, consistent with PerCter–Ca2+/CaM association.
Figure 2.

Steady-state tryptophan fluorescence emission of the PerCter in the presence CaM. Representative spectra of 10 μM PerCter (—) and 10 μM PerCter upon the addition of 20 μM CaM (---). Spectra were recorded in 10 mM HEPES at pH 7.3 and 100 mM KCl with (A) 10 mM CaCl2 or (B) 4 mM EGTA. (C) Representative spectra of 10 μM Scr. Helix (−) and 10 μM Scr. Helix upon the addition of 20 μM CaM (---). Spectra were corrected for background and dilution before being smoothed over a 5-point average. All samples were excited at 295 nm. These spectra represent at least six series of experiments.
Fluorescence Quenching
Iodide quenching of Trp fluorescence was used to determine the accessibility of the two Trp residues within the PerCter to iodide after binding to Ca2+/CaM. The steady-state fluorescence emission of the PerCter upon the addition of Ca2+/CaM clearly demonstrated that at least one Trp was moving to a less polar environment or being secluded from the solvent during PerCter–Ca2+/CaM complex formation. If this were indeed the case, then at least one Trp would also be less accessible to collisional quenching by iodide (37).
A solution of 10 μM PerCter with or without 20 μM Ca2+/CaM in a 10 mM CaCl2 buffer was titrated with 100 mM KI. The sample was excited at 295 nm, and the emission spectra were recorded from 310 to 450 nm. The resulting data were corrected and plotted according to the Stern–Volmer equation as detailed in Materials and Methods (Figure 3). The decreased slope of the Stern–Volmer plot upon the addition of Ca2+/CaM indicates that the tryptophan residues of the PerCter are at least partially protected from iodide quenching. These data are consistent with the steady-state fluorescence of the PerCter upon the addition of Ca2+/CaM and are similar to previous reports of other peptides binding to Ca2+/CaM (30, 36). The blue shift and increase in quantum yield of the steady-state tryptophan fluorescence emission and the decrease in iodide accessibility upon the addition of Ca2+/CaM support the hypothesis that Ca2+/CaM associates with PerCter.
Figure 3.
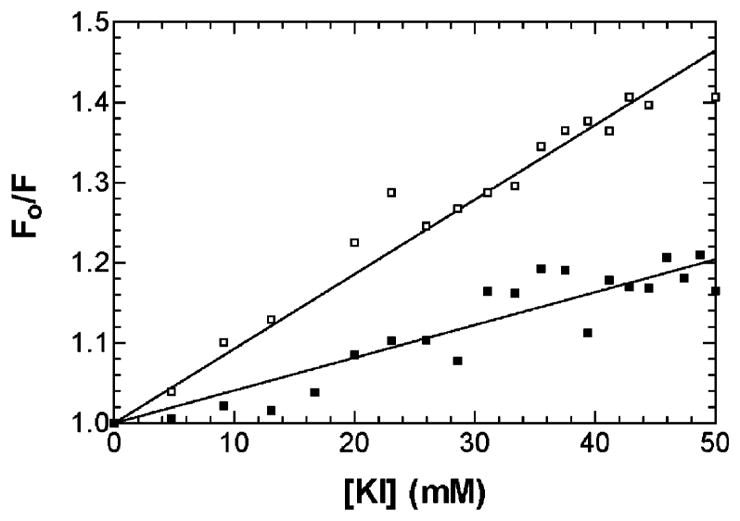
Iodide quenching of the tryptophan fluorescence in the PerCter–Ca2+/CaM complex. A solution of 10 μM PerCter alone (□) or in the presence of 20 μM CaM (■) was titrated with 100 mM KI. Emission spectra were recorded at least 10 min after addition to ensure equilibrium conditions. Spectra were corrected for background and dilution before being integrated from 310–450 nm. Fractional fluorescence (Fo/F) was then determined by dividing the area under the unquenched spectrum by the respective quenched spectrum.
Fluorescence Anisotropy
The steady-state Trp fluorescence anisotropy of the PerCter was utilized to determine the dissociation constant (KD) of the PerCter–Ca2+/CaM complex. Fluorescence anisotropy is dependent on the average rotational correlation time of all the respective fluorophores in solution (37). A larger PerCter–Ca2+/CaM complex (24,800 Da), tumbling more slowly in solution compared to PerCter alone (6,800 Da), would lead to an increased fluorescence anisotropy. The observed average fluorescence anisotropy for the free PerCter in solution, or rF, was 0.07. The PerCter was then titrated with Ca2+/CaM, and the resulting anisotropies were recorded.
From the plot (Figure 4A), it is apparent that as the Ca2+/CaM concentration increased, the average anisotropy of the PerCter increased in a hyperbolic manner, reaching a maximal anisotropy, or rB, of 0.12 as determined through curve fitting (Materials and Methods). This observation was consistent with Ca2+/CaM–PerCter complex formation. A previously reported experiment performed using the CaM binding peptide baa17 yielded similar results (30). Titration under the same conditions except for the presence of 4 mM EGTA (Figure 4A) showed no significant change in PerCter anisotropy, verifying that complex formation is calcium dependent. The resulting rB and rF from the titration were used to calculate the fraction of PerCter bound to Ca2+/CaM, or fB, at each respective Ca2+/CaM concentration (Figure 4B). The binding curves were fit assuming a single binding site. This simple model of binding proved adequate to the analysis of the data. Three titrations were performed and the curves yielded an average dissociation constant of 320 ± 150 nM.
Figure 4.
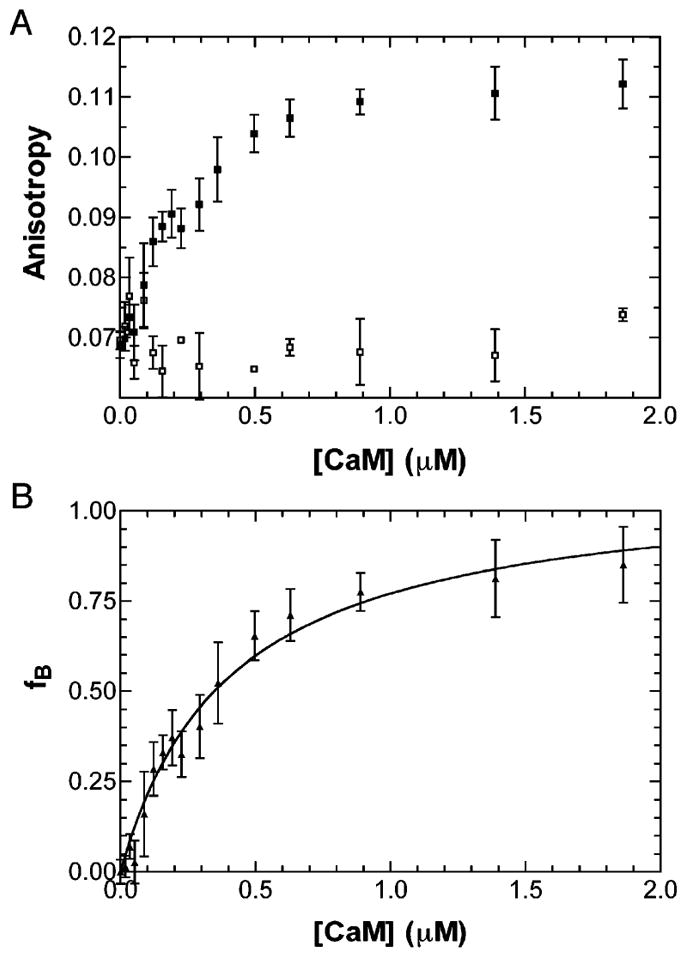
Determination of the PerCter–Ca2+/CaM disassociation constant. (A) Trp fluorescence anisotropy of the PerCter at increasing CaM concentration. A 2 μM PerCter solution was titrated with CaM as detailed in Materials and Methods in the absence of 4 mM EGTA (■) and in the presence of 4 mM EGTA (□). (B) fB (or fraction bound) at increasing CaM concentrations determined from steady-state Trp fluorescence anisotropy. The curve was fit assuming a single binding site, and the average disassociation constant of at least four titrations was determined to be 320 ± 150 nM. The error bars represent the standard deviation of at least three independent measurements.
GST Pull-Down Assays
Using GST pull-down assays, we tested the hypothesis that the C-terminal region of p/rds interacts with CaM. The template for the C-terminus of p/rds included an N-terminal GST tag linked to residues 284–346 of bovine p/rds (shown schematically in Figure 5A). The GST-p/rds fusion protein (called, GST-PerCter) was expressed in E. coli as described (12) and, when purified, exhibited the predicted molecular masses of 30 kDa for GST-PerCter and ~8 kDa for GST-cleaved PerCter (data not shown). The purified PerCter polypeptide is biologically active in that (1) it promotes membrane destabilization and membrane fusion in model systems, (2) it changes conformation in the presence of lipid vesicles (12), and (3) it targets to the ROS in transgenic Xenopus (8, 9, 54). In these studies, biological activity was confirmed using destabilization (data not shown) and model membrane fusion assays (Fig 7B).
Figure 5.

Association of the p/rds C-terminus with Ca2+/CaM. (A) Schematic diagram showing the organization of the GST-p/rds polypeptides. (B) GST-PerCter fusion protein attached to glutathione resin incubated with Alexa Fluor 488CaM at 4 °C overnight as detailed in Materials and Methods in the presence of 0.1 μM calcium (lanes 1, 3, and 5) or 1.0 mM calcium (lanes 2, 4, and 6). (C) CaM does not associate with the mutant peripherin/rds C-terminus containing a scrambled helical domain (Scr. Helix). The GST-PerCter WT or Scr. Helix as well as a GST-PerNter (see Table 1) fusion protein were attached to glutathione resin and incubated with Alexa Fluor 488CaM at 4 °C overnight as detailed in Materials and Methods in the presence of 0.1 μM calcium (lanes 1, 3, and 5) or 1.0 mM calcium (lanes 2, 4, and 6). (D) Peptide corresponding to the p/rds helical fusion domain, PP-5 (V311–L325), inhibits CaM association with the PerCter. Prior to CaM addition to the immobilized GST-PerCter polypeptide, CaM was preincubated with 1.0 mM PP-5, 1.0 mM PP-3 (Q331–E346), or an equimolar mixture of the two peptides (final peptide concentration = 1.0 mM) as indicated in the Figure. GST-pull down assays were then performed essentially as described. Samples were concentrated and proteins analyzed on 12% SDS–PAGE and by Western blotting. Gels were visualized on a Kodak Image Station 440 CF using a conventional FITC filter. Western blots were probed with mouse monoclonal anti-p/rds antibody, mAb 2B6 (from Dr. R. Molday), or mouse monoclonal anti-CaM antibody.
Figure 7.

Calmodulin inhibits disk-plasma membrane cell free fusion and p/rds C-terminal domain-dependent fusion. (A) Fusion between R18-labeled ROS plasma membrane vesicles and unlabeled disk membranes measured by fluorescence dequenching at 37 °C as described in Materials and Methods. Prior to the initiation of fusion, disk membranes (final phospholipid phosphate concentration of 1 uM) were preincubated for 15 min with CaM, at the concentrations indicated, and 1 mM calcium. Total fusion was calculated on the basis of fluorescence emission and normalized to disk membranes with no added Ca2+/CaM. Data are presented as a percentage of this value. (B) Purified C-terminal polypeptide promotes an NBD-PE and Rh-PE lipid mixing. The assessment of the fusogenic function of full-length C-terminal polypeptide is shown. Lipid mixing was detected using resonance energy transfer between NBD-PE and Rh-PE and was quantitated as the initial rate of fusion (IRF), % change in fluorescence intensity per second at 37 °C ± SEM, and n = 3. Fusion was initiated with the addition of GST-PerCter (C-terminus), the GST-Scr. Helix (Scr C-terminus), and a ROM-1 C-terminal polypeptide (ROM-1 C-terminus). In some experiments, the polypeptides were preincubated with 1 μM CaM (+CaM). The phospholipid to polypeptide ratio was 50–60:1.
When GST-PerCter was used as the bait and purified Alexa Fluor 488CaM added as prey, a 19 kDa fluorescent protein was detected in the bait–prey complex (Figure 5B, lanes 1 and 2). Substantially more CaM was detected in the presence of 1 mM levels of calcium as compared to 0.1 μM calcium (lane 1 vs lane 2). When purified Alexa Fluor 488CaM was added to GST beads, no binding was detected (Figure 5B, lane 3). PerCter was detected in the pull-downs with either 0.1 μM or 1 mM calcium. With 1 mM calcium (Figure 5C, lane 4), the relative amount of total protein appeared equal (based on UV total protein measurements) as compared to 0.1 μM calcium when PerCter was in obvious excess (Figure 5C, lane 3).
Sequence Alignment and CaM Binding Site Prediction
The results detailed above clearly demonstrate the association of Ca2+/CaM with a polypeptide corresponding to the p/rds C-terminal domain in vitro. To help identify the exact Ca2+/CaM binding site within the PerCter, the sequence homology between PerCter from several species and baa17 (Figure 6) was analyzed. The baa17 peptide was modeled as a classical Ca2+-dependent CaM binding motif that binds with a subnanomolar affinity to Ca2+/CaM (30). Sequence alignment was performed using multiple sequence comparison by log-expectation, or MUSCLE (55, 56), on the web-based MUSCLE server provided by the Wageningen University Laboratory of Bioinformatics (Wageningen, The Netherlands) (http://www.bioinformatics.nl/tools/muscle.html). The baa17 sequence and the corresponding region within the bovine p/rds C-terminus shared ~41% sequence identity. This region of the PerCter, which is rich in positively charged lysine and hydrophobic residues, has been shown to become helical upon detergent micelle association and modeled as a basic amphiphilic α-helix (12). Classical Ca2+/CaM binding domains are commonly found to be amphiphilic helices that associate with CaM through hydrophobic interactions within the CaM binding channel (30, 57–59).
Figure 6.

Sequence alignment of the baa17 peptide with a region of the p/rds C-terminal domain from several species. Shaded residues at each position indicate at least 25% conserved character; (+) indicates regions of predicted CaM binding.
The corresponding homologous region was further analyzed for potential CaM binding sites using the Calmodulin Target Database at the University of Toronto (Toronto, Canada) (http://calcium.uhnres.utoronto.ca/ctdb/ctdb/home-.html). Each respective full-length p/rds sequence was evaluated for potential CaM binding motifs and scored on a scale from 0 to 9, with 9 being the most likely binding site, for a sliding 20-residue window. Scores were based upon the hydropathy, alpha-helical propensity, residue weight, residue charge, hydrophobic residue content, helical class, and occurrence of particular residues within each 20-residue window and normalized over the entire queried sequence. The predicted regions of CaM binding within the p/rds C-terminal domain (Figure 6) were identified. Only two of the nine represented species, Xenopus laevis (African clawed frog) and Leucoraja erinacea (little skate), did not possess a predicted CaM binding motif in the p/rds C-terminal domain.
The significant homology between the baa17 peptide and the PerCter correlated with the predicted CaM binding site within the PerCter. This putative site only contained one of the PerCter’s two tryptophan residues. These results were consistent with the binding data and supported the hypothesis that Ca2+/CaM associates with the multi-functional PerCter. The most likely Ca2+/CaM binding site within the PerCter is, therefore, between residues E314 and G329.
Scrambled p/rds C-Terminal Domain Studies
To experimentally identify the Ca2+/CaM binding site within the PerCter, a scrambled p/rds C-terminal domain polypeptide, Scr. Helix, that possessed five distinct mutations designed to reduce the net positive charge and hydrophobicity (see Table 1) of the predicted CaM binding site (E314–G329) was generated. This region overlaps the previously identified helical fusion domain (12). Steady-state tryptophan fluorescence emission and GST pull-down assays were utilized to assess the binding of the Scr. Helix to Ca2+/CaM.
Fluorescence emission spectra of solutions containing 10 μM Scr. Helix alone and with 20 μM Ca2+/CaM were recorded (Figure 2C). Upon the addition of Ca2+/CaM, there was no significant change in the emission spectra of the Scr. Helix compared to that of the wild-type PerCter (Figure 2A). These results suggest neither of the two Trp residues within the Scr. Helix became sequestered from the buffer in the presence of Ca2+/CaM. In GST pull-down assays when GST-Scr. Helix was used as bait and CaM as prey, no binding was detected at either 0.1 μM or 1 mM calcium (Figure 5C, lanes 3 and 4) as compared to the wild type GST-PerCter (Figure 5C, lanes 1 and 2). Minimal calmodulin binding was detected at high calcium (1 mM) concentration when the N-terminal polypeptide, GST-PerNter, was used as bait, (Figure 5C, lanes 5 and 6). Finally, to further confirm the site of Ca2+/CaM–PerCter interaction, we preincubated calmodulin with either PP-5 or PP-3. As shown in Figure 5D, preincubation with PP-5 abolished calmodulin binding, whereas preincubation with PP-3 had no effect (lanes 2 and 3). These data point to a specific region on the PerCter that is responsible for the binding to Ca2+/CaM; this will be further explored below.
Membrane Fusion Assays
Fusion between R18-labeled ROS plasma membrane vesicles and disk membranes was monitored as an increase in R18 in fluorescence upon dequenching of the R18 probe as the two membranes merge. This well-characterized assay has been used extensively by our laboratory and others to follow cell–cell and cell–viral fusion events. When the disk membranes were preincubated with increasing concentrations of Ca2+/CaM, a decrease in fusion was observed with a 40% inhibition at sub-micromolar concentrations (Figure 7A). Fusion was not completely inhibited even at high concentrations of Ca2+/CaM. This likely reflects the equilibrium between fusogenic PerCter with and without Ca2+/CaM bound and/or the equilibrium with other conformers of PerCter that do not promote fusion.
To provide further support for our hypothesis that calmodulin binding to the C-terminus of peripherin-2 affects fusion, we turned to a model membrane fusion system. Here, mixing of the bilayer lipids of large unilamellar PC/PS/CHOL vesicles was monitored using fluorescence resonance energy transfer (RET). Vesicles that contained the lipid soluble fluorescent probes, Rh-PE and NBD-PE, at sufficiently high concentration for efficient energy transfer were prepared. The labeled vesicles were then mixed with unlabeled vesicles. Mixing of the lipids from the two vesicle populations was detected as an increase in NBD-PE fluorescence. In Figure 7B, the initial rate of fusion in response to the addition of PerCter was on the order of 60%. When the PerCter was preincubated with Ca2+/CaM (at a final concentration of 1 μM), a decrease in initial rates of fusion from 60% to 15% was observed. The addition of the Scr. Helix polypeptide, in which the amphiphilic fusogenic helical domain was scrambled, resulted in less than 12% fusion with a minor decrease in fusion upon the addition of calmodulin.
DISCUSSION
The biochemical and biophysical data presented here establish that CaM binds to the PerCter and that this association is calcium dependent. The steady-state Trp fluorescence experiments demonstrate that at least one of the two Trp residues within the PerCter has a blue-shifted emission maximum and increased fluorescence intensity upon Ca2+/CaM addition. The iodide quenching results establish that at least one of the Trp residues is protected from iodide quenching. The fluorescence anisotropy of the PerCter upon Ca2+/CaM addition increases in a hyperbolic manner, and curve fitting of these data yields a dissociation constant of 320 ± 150 nM. Additionally, in the presence of EGTA, the PerCter did not exhibit a blue shift in λmax or increased fluorescence intensity upon the addition of Ca2+/CaM, indicating that PerCter–CaM association is calcium dependent. The GST pull-down assays were consistent with these observations. Therefore, all of the data are consistent with Ca2+/CaM binding to PerCter.
Several key functions of p/rds have been localized to the PerCter. As shown in Figure 1, these functional domains are mostly localized within an overlapping region or hot spot. A putative binding site within the PerCter was determined and found to overlap this functional hot spot through homology analysis and binding site predication. This binding site was confirmed by the mutations in Scr. Helix.
Figure 1.

Schematic representation of the bovine p/rds C-terminal domain (PerCter). Beneath are the regions identified previously as the fusion regulatory region and fusion region (10, 11), the minimal sequence required for ROS localization (8, 9), the sequence required for disk incisure localization in the ROS (9), and the MREG binding region (13).
Extensive investigations directed at establishing the details of CaM molecular recognition (57–61) have helped to identify potential CaM targets. Classic Ca2+/CaM binding motifs have been characterized as basic amphiphilic helices that possess hydrophobic amino acid residues at positions 1-(5)-8-14 or 1-5-10. These residues are thought to reside on one side of the binding helix and bury deep within CaM’s hydrophobic binding channel, as seen in the NMR and X-ray crystallography structures of peptides bound to CaM (62–64). Within the predicted C-terminal region of the PerCter, W316–G329 possesses the most convincing Ca2+/CaM binding motif. With W316 at the N-terminal origin, the following residue sequence possesses hydrophobic amino acids at positions 1-5-8 (WxxxLxxVxxxxxG). However, this sequence lacks a strong hydrophobic residue at position 14. This tentative CaM binding motif lies within the PerCter basic amphiphilic α-helix, possesses four highly conserved lysine residues, and has an overall net charge of +3. Although one C-terminal Trp, W316, lays within this region, one Trp, W306, does not. A similar unconventional 1-5-8 CaM binding motif is found in the plasma membrane Ca2+ pump (65).
The Ca2+-dependent association of CaM to p/rds provides a means for modulating the multiple functions of the p/rds C-terminal domain. The PerCter is monomeric and adopts an extended or random-coil-like conformation in solution (4). The diversity of structural and functional characteristics exemplified by the PerCter within the cellular milieu in which p/rds resides are common features of the growing family of intrinsically disordered proteins (IDPs). IDPs are characterized by their ability to bind multiple structurally distinct targets (66) while coupling high specificity with low affinity. Within the ROS disk rim, the intrinsically disordered PerCter is ideally suited for adopting different mechanistic roles and structures during ROS disk renewal, including membrane fusion leading to packet formation and association with other ROS proteins stabilizing ROS structure. Ca2+/CaM binding to p/rds would be capable of sequestering the fusion domain of the PerCter, thereby preventing uncontrolled membrane fusion. The ability of Ca2+/CaM binding to inhibit the fusion function of p/rds was observed in this work in the fusion experiments between the ROS disk and plasma membrane and in the model membrane fusion experiments with PerCter. The interaction between p/rds oligomeric complexes and the cNG gated channel offers the first direct evidence for a protein–protein interaction capable of spanning the narrow gap between the ROS disk rim and the plasma membrane (14, 67, 68), and Ca2+/CaM binding could represent a means for regulating peripherin-2–cNG gated channel complex formation. The exact mode and functional consequences of Ca2+/CaM binding to the p/rds C-terminal domain in vivo will be the subject of future research.
Footnotes
This work was supported by USPHS Grant EY01420, E. Matilda Ziegler Vision Award, Vision Core Grant P30 EY001583, and an award from the Research Foundation of the University of Connecticut.
Abbreviations: CaM, calmodulin; Ca2+/CaM, calcium-bound CaM; Chol, cholesterol; EGTA, ethyleneglycol-bis-(β-amino-ethyl ether) N,N′-tetra-acetic acid; GARP, glutamic acid rich protein; GST, glutathione S-transferase; HEPES, N-cyclohexyl-2-aminoethanesulfonic acid; IDP, intrinsically disordered protein; IPTG, isopropyl-β-D-thiogalactopyranoside; LUVs, large unilamellar vesicles; mAb, monoclonal anti-body; MOPS, 3-(N-morpholino)-propanesulfonic acid; MREG, melanoregulin; MUSCLE, multiple sequence comparison by log expectation; NBD-PE, N-(7-nitro-2,1,3-benzoxadiazol-4-yl) phosphatidylethanolamine; OS, outer segment; PBS, phosphate buffered saline; PC, phosphatidylcholine; PerCter, peripherin/rds C-terminal domain; PerNter, peripherin/rds N-terminal domain; PM, plasma membrane; p/rds, peripherin/rds; PS, phosphatidylserine; R18, octadecylrhodamine B chloride; RDS, retinal degeneration slow protein; Rh-PE, N-(lissamine rhodamine B sulfonyl) phosphatidylethanolamine; ROS, rod outer segment; TMF4, transmembrane 4 superfamily; TM, transmembrane segment; Trp, tryptophan.
References
- 1.Hemler ME. Tetraspanin proteins mediate cellular penetration, invasion, and fusion events and define a novel type of membrane microdomain. Annu Rev Cell Dev Biol. 2003;19:397–422. doi: 10.1146/annurev.cellbio.19.111301.153609. [DOI] [PubMed] [Google Scholar]
- 2.Hemler M. Tetraspanin functions and associated micro-domains. Nat Rev Mol Cell Biol. 2006;6:801–811. doi: 10.1038/nrm1736. [DOI] [PubMed] [Google Scholar]
- 3.Stipp CS, Kolesnikova TV, Hemler ME. Functional domains in tetraspannin proteins. Trends Biochem Sci. 2003;28:106–112. doi: 10.1016/S0968-0004(02)00014-2. [DOI] [PubMed] [Google Scholar]
- 4.Ritter LM, Arakawa T, Goldberg AFX. Predicted and measured disorder in peripherin/rds, a retinal tetraspannin. Protein Pept Lett. 2005;12:677–686. doi: 10.2174/0929866054696217. [DOI] [PMC free article] [PubMed] [Google Scholar]
- 5.Hemler ME. Specific tetraspanin functions. J Cell Biol. 2001;155:1103–1107. doi: 10.1083/jcb.200108061. [DOI] [PMC free article] [PubMed] [Google Scholar]
- 6.Yunta M, Lazo PA. Tetraspannin proteins as organizers of membrane microdomains and signaling complexes. Cell Signalling. 2003;15:559–564. doi: 10.1016/s0898-6568(02)00147-x. [DOI] [PubMed] [Google Scholar]
- 7.Arikawa K, Molday LL, Molday RS, Williams DS. Localization of peripherin/rds in the disk membranes of cone and rod photoreceptors; relationship to disk membrane morphogenesis and retinal degeneration. J Cell Biol. 1992;116:658–667. doi: 10.1083/jcb.116.3.659. [DOI] [PMC free article] [PubMed] [Google Scholar]
- 8.Tam BM, Moritz OL, Hurd LB, Papermaster DS. Characterization of the functional properties of the c-terminus of Xenopus peripherin. Invest Opthalmol Visual Sci. 2002;43 [Google Scholar]
- 9.Tam BM, Moritz OL, Papermaster DS. The C terminus of peripherin/rds participates in rod outer segment targeting and alignment of disk incisures. Mol Biol Cell. 2004;15:2027–2037. doi: 10.1091/mbc.E03-09-0650. [DOI] [PMC free article] [PubMed] [Google Scholar]
- 10.Boesze-Battaglia K, Lamba OP, Napoli AAJ, Sinha S, Guo Y. Fusion between retinal rod outer segment membranes and model membranes: a role for photoreceptor peripherin/rds. Biochemistry. 1998;37:9477–9487. doi: 10.1021/bi980173p. [DOI] [PubMed] [Google Scholar]
- 11.Boesze-Battaglia K, Kong F, Lamba OP, Stefano FP, Williams DS. Purification and light-dependent phosphorylation of a candidate fusion protein, the photoreceptor cell peripherin/rds. Biochemistry. 1997;36:6835–6846. doi: 10.1021/bi9627370. [DOI] [PubMed] [Google Scholar]
- 12.Boesze-Battaglia K, Goldberg AFX, Dispoto J, Katragadda M, Cesarone G, Albert AA. A soluble peripherin/Rds c-terminal polypeptide promotes membrane fusion and changes conformation upon membrane association. Exp Eye Res. 2003;77:505–514. doi: 10.1016/s0014-4835(03)00151-9. [DOI] [PMC free article] [PubMed] [Google Scholar]
- 13.Boesze-Battaglia K, Damek-Poprawa M, Rachel R, Pankoski L, Copeland N, Jenkins N. Photoreceptor peripherin/rds fusogenic function is inhibited by dsu, through direct binding to the C-terminal domain. Invest Ophthalmol Visual Sci. 2005;46:3975. [Google Scholar]
- 14.Poetsch A, Molday LL, Molday RS. The cGMP-gated channel and related glutamic acid-rich proteins interact with peripherin-2 at the rim region of rod photoreceptor disc membranes. J Biol Chem. 2001;276:48009–48016. doi: 10.1074/jbc.M108941200. [DOI] [PubMed] [Google Scholar]
- 15.Clarke G, Goldberg AFX, Vidgen D, Collins L, Ploder L, Schwartz L, Molday LL, Rossant J, Szel A, Molday RS, Birch DG, McInnnes RR. Rom-1 is required for rod photoreceptor viability and the regulation of disk morphogenesis. Nat Genet. 2000;25:67–73. doi: 10.1038/75621. [DOI] [PubMed] [Google Scholar]
- 16.Van Gelder RN. Circadian rhythms: eyes of the clock. Curr Biol. 1998;8:R798–R801. doi: 10.1016/s0960-9822(07)00503-9. [DOI] [PubMed] [Google Scholar]
- 17.Young RW. Visual cells and the concept of renewal. Invest Opthalmol Visual Sci. 1976;15:700–725. [PubMed] [Google Scholar]
- 18.Boesze-Battaglia K, Goldberg A. Photoreceptor renewal: a role for peripherin/rds. Int Rev Cytol. 2002;271:183–225. doi: 10.1016/s0074-7696(02)17015-x. [DOI] [PMC free article] [PubMed] [Google Scholar]
- 19.Boesze-Battaglia K, Albert AA, Yeagle PY. Fusion between disk membranes and plasma membranes of bovine photoreceptor cells is calcium dependent. Biochemistry. 1992;31:3733. doi: 10.1021/bi00130a002. [DOI] [PubMed] [Google Scholar]
- 20.Wrigley JDJ, Ahmed T, Nevett CL, Findlay JBC. Peripherin/rds influences membrane vesicle morphology. J Biol Chem. 2000;273:13191–13194. doi: 10.1074/jbc.c900853199. [DOI] [PubMed] [Google Scholar]
- 21.Pugh ENJ, Nikonov S, Lamb TD. Molecular mechanisms of vertebrate photoreceptor light adaptation. Curr Opin Nuerobiol. 1999;9:410–418. doi: 10.1016/S0959-4388(99)80062-2. [DOI] [PubMed] [Google Scholar]
- 22.Matthews HR, Fain GL. The effect of light on outer segment calcium in salamander rods. J Physiol. 2003;542:829–841. doi: 10.1113/jphysiol.2003.050724. [DOI] [PMC free article] [PubMed] [Google Scholar]
- 23.Trudeau MC, Zagotta WN. Calcium/Calmodulin modulation of olfactory and rod cyclic nucleotide-gated ion channels. J Biol Chem. 2003;278:18705–18708. doi: 10.1074/jbc.R300001200. [DOI] [PubMed] [Google Scholar]
- 24.Molday RS. Calmodulin regulation of cyclic-nucleotide-gated channels. Curr Opin Neurobiol. 1996;6:445–452. doi: 10.1016/s0959-4388(96)80048-1. [DOI] [PubMed] [Google Scholar]
- 25.Grunwald ME, Yu WP, Yu HH, Yau KW. Identification of a domain on the beta-subunit of the rod cGMP-gated cation channel that mediates inhibition by calcium-calmodulin. J Biol Chem. 1998;273:9148–9157. doi: 10.1074/jbc.273.15.9148. [DOI] [PubMed] [Google Scholar]
- 26.Nakatani K, Koutalos Y, Yau KW. Ca2+ modulation of the cGMP-gated channel of bullfrog retinal rod photoreceptors. J Physiol. 1995;484:69–76. doi: 10.1113/jphysiol.1995.sp020648. [DOI] [PMC free article] [PubMed] [Google Scholar]
- 27.Koutalos Y, Yau KW. Regulation of sensitivity in vertebrate rod photoreceptors by calcium. Trends Neurosci. 1996;19:73–81. doi: 10.1016/0166-2236(96)89624-x. [DOI] [PubMed] [Google Scholar]
- 28.Koutalos Y, Nakatani K, Yau KW. The cGMP-phosphodiesterase and its contribution to sensitivity regulation in retinal rods. J Gen Physiol. 1995;106:891–921. doi: 10.1085/jgp.106.5.891. [DOI] [PMC free article] [PubMed] [Google Scholar]
- 29.Eckmiller MS. Calmodulin immunolocalization in outer segments of Xenopus laevis photoreceptors. Cell Tissue Res. 2002;308:439–442. doi: 10.1007/s00441-002-0558-3. [DOI] [PubMed] [Google Scholar]
- 30.DeGrado W, Prendergast F, Wolfe HJ, Cox J. The design, synthesis, and characterization of tight-binding inhibitors of calmodulin. J Cell Biochem. 1985;29:83–93. doi: 10.1002/jcb.240290204. [DOI] [PubMed] [Google Scholar]
- 31.Precheur B, Munier H, Mispelter J, Barzu O, Craescu C. 1H and 15N NMR characterization of free and bound states of an amphiphilic peptide interacting with calmodulin. Biochemistry. 1992;31:229–236. doi: 10.1021/bi00116a032. [DOI] [PubMed] [Google Scholar]
- 32.Moore RC, Durso NA, Cry RJ. Elongation Factor-1α stabilizes microtubules in calcium/calmodulin-dependent manner. Cell Motil Cytoskeleton. 1998;41:168–180. doi: 10.1002/(SICI)1097-0169(1998)41:2<168::AID-CM7>3.0.CO;2-A. [DOI] [PubMed] [Google Scholar]
- 33.Boesze-Battaglia K, Stefano FP, Fitzgerald C, Muller-Weeks S. ROM-1 potentiates photoreceptor specific membrane fusion processes. Exp Eye Res. 2007;84:22–31. doi: 10.1016/j.exer.2006.08.010. [DOI] [PMC free article] [PubMed] [Google Scholar]
- 34.Frangioni JV, Neel BG. Solubilization and purification of enzymatically active glutathione S-transferase (pGEX) fusion proteins. Anal Biochem. 1993;210:179–187. doi: 10.1006/abio.1993.1170. [DOI] [PubMed] [Google Scholar]
- 35.Gill SC, von Hippel PH. Calculation of protein extinction coefficients from amino cid sequence data. Anal Biochem. 1989;182:319–326. doi: 10.1016/0003-2697(89)90602-7. [DOI] [PubMed] [Google Scholar]
- 36.Chapman ER, Au D, Alexander KA, Nicolson TA, Storm DR. Characterization of the calmodulin binding domain of neuromodulin. Functional significance of serine 41 and phenylalanine 42. J Biol Chem. 1991;266:207–213. [PubMed] [Google Scholar]
- 37.Lakowicz JR. Principles of Fluorescence Spectroscopy. 2. Kluwer Academic/Plenum Publishers; New York: 1999. [Google Scholar]
- 38.Wu G, Krupnick JG, Benovic JL, Lanier SM. Interaction of arrestins with intracellular domain of muscarinic and α2-adrenergic receptors. J Biol Chem. 1997;272:17836–17842. doi: 10.1074/jbc.272.28.17836. [DOI] [PubMed] [Google Scholar]
- 39.Boesze-Battaglia K. Fusion between retinal rod outer segment membranes and model membranes: functional assays and role for peripherin/rds. Methods Enzymol. 2000;316:65–86. doi: 10.1016/s0076-6879(00)16717-5. [DOI] [PMC free article] [PubMed] [Google Scholar]
- 40.Boesze-Battaglia K, Albert AD. Fatty acid composition of bovine rod outer segment plasma membrane. Exp Eye Res. 1989;49:699–701. doi: 10.1016/s0014-4835(89)80064-8. [DOI] [PubMed] [Google Scholar]
- 41.Boesze-Battaglia K, Stefano FP, Fenner M, Napoli AA., Jr A peptide analogue to a fusion domain within photoreceptor peripherin/rds promotes membrane adhesion and depolarization. Biochim Biophys Acta. 2000;1463:343–354. doi: 10.1016/s0005-2736(99)00226-6. [DOI] [PMC free article] [PubMed] [Google Scholar]
- 42.Hoekstra D, Klappe K. Sendai virus-erythrocyte membrane interaction: Quantitative and kinetic analysis of viral binding, dissociation and fusion. J Virol. 1986;58:87–95. doi: 10.1128/jvi.58.1.87-95.1986. [DOI] [PMC free article] [PubMed] [Google Scholar]
- 43.Hoekstra D, de Boer T, Klappe K, Wilschut J. Fluorescence method for measuring the kinetics of fusion between biological membranes. Biochemistry. 1984;23:5675–5681. doi: 10.1021/bi00319a002. [DOI] [PubMed] [Google Scholar]
- 44.Hope MJ, Bally MB, Webb G, Cullis PR. Production of large unilamellar vesicles by a rapid extrusion procedure: Characterization of size, trapped volume and ability to maintain a membrane potential. Biochim Biophys Acta. 1985;812:55–65. doi: 10.1016/0005-2736(85)90521-8. [DOI] [PubMed] [Google Scholar]
- 45.Bartlett GR. Phosphorus assay in column chromatography. J Biol Chem. 1959;234:466–468. [PubMed] [Google Scholar]
- 46.Litman BJ. Lipid model membranes. Characterization of mixed phospholipid vesicles. Biochemistry. 1973;12:2545–2554. doi: 10.1021/bi00737a028. [DOI] [PubMed] [Google Scholar]
- 47.Struck DK, Hoekstra D, Pagano RE. Use of resonance energy transfer to monitor membrane fusion. Biochemistry. 1981;20:4093–4099. doi: 10.1021/bi00517a023. [DOI] [PubMed] [Google Scholar]
- 48.Libich DS, Hill CMD, Haines JD, Harauz G. Myelin basic protein has multiple calmodulin-binding sites. Biochem Biophys Res Commun. 2003;338:313–319. doi: 10.1016/s0006-291x(03)01380-9. [DOI] [PubMed] [Google Scholar]
- 49.Chabbert M, Piemont E, Prendergast FG, Lami H. Fluorescence of a tryptophan bearing peptide from smooth muscle myosin light chain kinase upon binding to two closely related calmodulins. Arch Biochem Biophys. 1995;332:429–436. doi: 10.1006/abbi.1995.1485. [DOI] [PubMed] [Google Scholar]
- 50.Lakowicz JR, Gryczynski I, Laczko G, Wiczk W, Johnson L. Distribution of distances between the tryptophan and the N-terminal residue of melittin in its complex with calmodulin troponin C, and phospholipids. Protein Sci. 1994;3:628–637. doi: 10.1002/pro.5560030411. [DOI] [PMC free article] [PubMed] [Google Scholar]
- 51.Murase T, Lio T. Static and kinetic studies of complex formations between calmodulin and MastoparanX. Biochemistry. 2002;41:1618–1629. doi: 10.1021/bi011782r. [DOI] [PubMed] [Google Scholar]
- 52.Sitaram N, Subbalakshmi C, Nagaraj R. Indolicidin, a 13-residue basic antimicrobial peptide rich in tryptophan and proline, interacts with Ca2+-calmodulin, communications. Biochem Cell Biol. 2003;309:879–884. doi: 10.1016/j.bbrc.2003.08.095. [DOI] [PubMed] [Google Scholar]
- 53.Watterson DM, Sharief F, Vanaman TC. The complete amino acid sequence of the Ca2+-dependent modulator protein (calmodulin) of bovine brain. J Biol Chem. 1980;255:962–975. [PubMed] [Google Scholar]
- 54.Tam BM, Martin HE, Hurd LB, Papermaster DS. Are the COOH terminal regions for rod outer segment proteins potential targeting signals? Invest Opthalmol Visual Sci. 2001;42 [Google Scholar]
- 55.Edgar RC. MUSCLE: a multiple sequence alignment method with reduced time and space complexity. BMC Bioinf. 2004;5:113. doi: 10.1186/1471-2105-5-113. [DOI] [PMC free article] [PubMed] [Google Scholar]
- 56.Edgar RC. MUSCLE: multiple sequence alignment with high accuracy and high throughput. Nucleic Acids Res. 2004;32:1792–1797. doi: 10.1093/nar/gkh340. [DOI] [PMC free article] [PubMed] [Google Scholar]
- 57.O’Neil KT, DeGrado WF. How calmodulin binds its targets: sequence independent recognition of amphiphilic alpha helices. Trends Biochem Sci. 1990;15:59–64. doi: 10.1016/0968-0004(90)90177-d. [DOI] [PubMed] [Google Scholar]
- 58.Vetter SW, Leclerc E. Novel aspects of calmodulin target recognition and activation. Eur J Biochem. 2003;270:404–414. doi: 10.1046/j.1432-1033.2003.03414.x. [DOI] [PubMed] [Google Scholar]
- 59.Rhoads AR, Friedberg F. Sequence motifs for calmodulin recognition. FASEB J. 1997;11:331–340. doi: 10.1096/fasebj.11.5.9141499. [DOI] [PubMed] [Google Scholar]
- 60.James P, Vorherr T, Carafoli E. Calmodulin-binding domains: just two faced or multi-faceted? Trends Biochem Sci. 1995;20:38–42. doi: 10.1016/s0968-0004(00)88949-5. [DOI] [PubMed] [Google Scholar]
- 61.Ehrhardt MR, Urbauer JL, Wand AJ. The energetics and dynamics of molecular recognition by calmodulin. Biochemistry. 1995;34:2731–2738. doi: 10.1021/bi00009a001. [DOI] [PubMed] [Google Scholar]
- 62.Meador WE, Means AR, Quiocho FA. Target enzyme recognition by calmodulin: 2.4A structure of calmodulin-peptide complex. Science. 1992;257:1251–1255. doi: 10.1126/science.1519061. [DOI] [PubMed] [Google Scholar]
- 63.Meador WE, Means AR, Quiocho FA. Modulation of calmodulin plasticity in molecular recognition on the basis of X-ray structures. Science. 1993;262:1718–1721. doi: 10.1126/science.8259515. [DOI] [PubMed] [Google Scholar]
- 64.Ikura M, Clore GM, Gronenborn AM, Zhu G, Klee CB, Bax A. Solution structure of calmodulin target peptide complex by multidimensional NMR. Science. 1992;256:632–638. doi: 10.1126/science.1585175. [DOI] [PubMed] [Google Scholar]
- 65.Strehler EE. Recent advances in the molecular characterization of the plasma membrane Ca2+ pump. J Membr Biol. 1991;120:1–15. doi: 10.1007/BF01868586. [DOI] [PubMed] [Google Scholar]
- 66.Receveur-Bréchot V, Bourhis J-M, Uversky VN, Canard B, Longhi S. Assessing protein disorder and induced folding. Proteins. 2006;62:24–45. doi: 10.1002/prot.20750. [DOI] [PubMed] [Google Scholar]
- 67.Kajimura N, Harada Y, Usukura J. High-resolution freeze-etching replica images of the disk and the plasma membrane surfaces in purified bovine rod outer segments. J Electron Microsc (Tokyo) 2000;49:691–697. doi: 10.1093/oxfordjournals.jmicro.a023860. [DOI] [PubMed] [Google Scholar]
- 68.Roof DJ, Heuser JE. Surfaces of rod photoreceptor disk membranes: integral membrane components. J Cell Biol. 1982;95:487–509. doi: 10.1083/jcb.95.2.487. [DOI] [PMC free article] [PubMed] [Google Scholar]