Abstract
Cells must interpret environmental information that often changes over time. We systematically monitored growth of yeast cells under various frequencies of oscillating osmotic stress. Growth was severely inhibited at a particular resonance frequency, at which cells show hyperactivated transcriptional stress responses. This behavior represents a sensory misperception - the cells incorrectly interpret oscillations as a staircase of ever-increasing osmolarity. The misperception results from the capacity of the osmolarity-sensing kinase network to retrigger with sequential osmotic stresses. Although this feature is critical for coping with natural challenges — like continually increasing osmolarity — it results in a tradeoff of fragility to non-natural oscillatory inputs that match the retriggering time. These findings demonstrate the value of non-natural dynamic perturbations in exposing hidden sensitivities of cellular regulatory networks.
Cells have evolved complex signaling networks to monitor and respond to stimuli in their environment. As the cellular environment can dynamically change, evolution may select for sensory systems that are optimized for temporal patterns of stimulation that are frequently encountered by the organism. Such sensory systems may perform poorly when challenged by a non-natural stimulus patterns. Thus exposing cells to time-variant inputs in controlled experiments can shed light not only on the mechanisms underlying cellular response but also on the selection forces that shaped the biological system during evolution.
We systematically probed how the fitness of yeast cells responded to different dynamic patterns of osmotic stress. In Saccharomyces cerevisiae, the Hog1 mitogen-activated protein kinase (MAPK) pathway responds to increases in osmotic stress and ultimately leads to increased synthesis and retention of glycerol (1). Activation of the Hog1 MAPK is transient, even when osmotic stress persists (2). This adaptation allows cells to reset themselves and remain responsive to further increasing osmolarity that might occur with evaporation (3). Although MAPK signaling dynamics are well characterized, relatively little is known about the fitness of yeast cells when faced with different dynamic patterns of osmolarity.
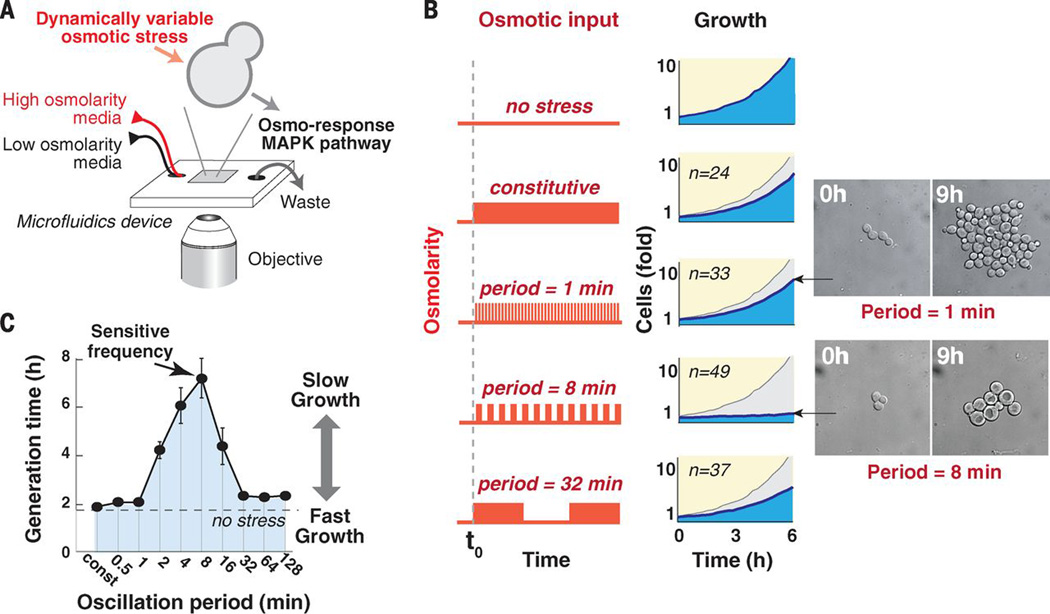
We used time-lapse microscopy with single-cell resolution to monitor cell growth under dynamically controlled osmolarity profiles (Fig. 1A). Cells grown in microfluidic chambers were subjected to regular oscillations in osmolarity over a timespan allowing for multiple rounds of cell division (amplitude range: 0 to 0.4M KCl). We tracked colony growth when cells were exposed to continuous high osmolality (single step increase) or to oscillations in osmolarity with a periodicity of 1, 8 or 32 minutes (Fig. 1B). Although the integrated osmolarity experienced by cells during these experiments was identical, cells grew considerably slower under the intermediate frequency of eight minutes (movie S1). When tested under a wide range of oscillatory frequencies (0.5 to 128 minutes) cellular growth was drastically hampered in a narrow range of intermediate frequencies, with this inhibitory effect peaking at an eight minute resonance frequency (Fig. 1C). Interestingly, at this periodicity, cells were larger and contained large vacuoles. (Fig. S2).
Fig. 1.
Osmotic oscillations at an intermediate frequency cause slow proliferation. (A) Schematic of the flow chamber used. (B) Cell growth under various frequencies of mild osmostress (0.4M KCl). The graphs show the average number of progeny cells relative to the number of cells before stress is applied (n shows the number of parental cells monitored). Growth without osmotic stress is shown in gray. The inset shows representative images of cells. (C) A systematic frequency scan of mild osmotic oscillations (0.4M KCl). The graph shows the mean doubling time over a period of 8h. Each point marks the mean generation time calculated from at least 50 individual sets of progeny in two biological repeats, bars mark the standard error.
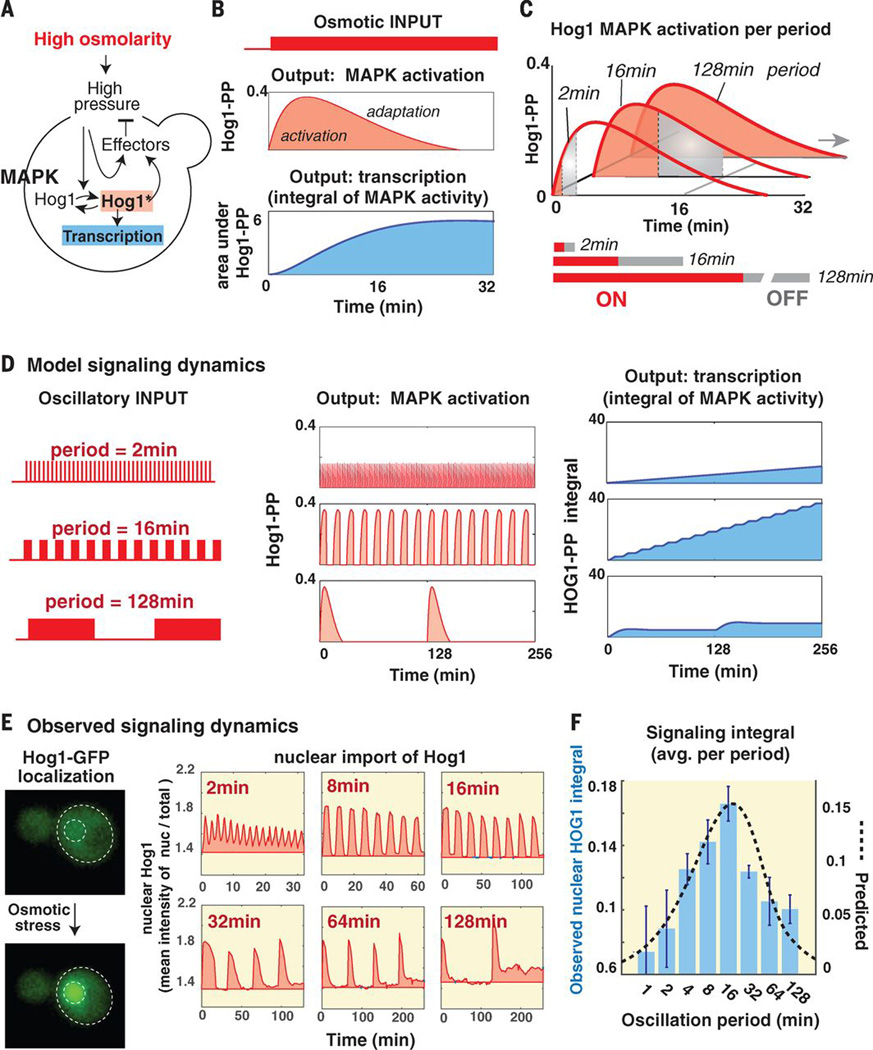
To explore what cellular mechanisms might underlie the band-pass frequency selectivity of growth inhibition we used a computational model developed to study the adaptive dynamics of the yeast osmotic signaling (3) (Fig. 2A). Changes in the turgor pressure across the cell wall and membrane are sensed and culminate in phosphorylation of the MAPK Hog1. Phosphorylated Hog1 (Hog1-PP) regulates cytoplasmic proteins and gene expression, thus increasing internal glycerol concentrations and restoring turgor pressure. In response to a step osmotic shock, accumulation of Hog1-PP shows two phases, an induction phase that quickly peaks at 5 minutes, followed by slower adaptation within 30 minutes (Fig. 2B). However, if osmolarity stress is suddenly removed, Hog1-PP levels decrease almost immediately through action of protein phosphatases.
Fig. 2.
Mathematical modeling of adaptive signaling of the osmotic pathway predicts downstream pathway hyperactivation at resonant stress frequency. (A) Schematic of osmotic pathway (3). Changes in turgor pressure activate Hog1-dependent and Hog1-independent response arms that act to reduce deviation from the optimal turgor pressure. (B) Pathway activation according to the perfect adaptation model (3). The top panel shows the predicted amounts of Hog1 phosphorylation in response 0.4M increase in osmolality with induction and adaptation phases. The lower panel shows the integral under the Hog1-PP curve and is taken as an approximation of the accumulated transcriptional output. (C) Pathway activation at three representative pulse durations (ON and OFF intervals are marked in red and gray, respectively). The top panel shows the predicted signaling dynamics and the lower panel shows the area under the signaling curve normalized by pulse duration (ON+OFF). (D) Model predicted signaling and transcriptional dynamics under representative oscillation periods. (E) Experimentally observed signaling dynamics under representative oscillation periods by tracking Hog1-GFP nuclear localization. The panels show the mean intensity ratio of nuclear Hog1-GFP over total Hog1-GFP in 40–100 cells (relative to the basal ratio at t=0min). (E) Measured signaling integral (normalized per min) in a frequency scan. The bars show the average integral in two biological repeats (bars mark the standard deviation). The pink graph marks the model predictions.
Because downstream changes in Hog1-PP-induced gene expression are expected to operate at a much slower time scale (hours) (4) than MAPK adaptation (minutes) we can use the integral of Hog1-PP as an approximation for the expected level of downstream transcriptional output (Fig. 2B). In response to single step increase in osmolarity, Hog1-PP shows a transient adaptive curve and transcriptional output is expected to monotonically increase and reach a plateau once Hog1-PP returns to its basal level (protein levels will slowly decay afterwards due to dilution and degradation). Similar downstream dynamics are not restricted only to transcription but can manifest in any cellular activity that decays slowly and hence acts as an integrator of MAPK signaling activity over time.
This computational model, by tracking expected changes in osmotic stress-induced gene expression, can explain the stress sensitivity at the resonance frequency. We used the model to estimate response dynamics for a cell exposed to a pulse of high osmolarity of three representative pulse durations (Fig. 2C). Under oscillations the ON pulse is followed by an OFF pulse of the same length, therefore the averaged transcriptional rate is given by the integral under the signaling curve divided by length of full pulse period (ON+OFF duration). The model predicts that the normalized transcriptional output will maximize at intermediate frequency of 16min (as thought the system contains a band-pass filter) (Fig. 2C). The signaling dynamics have markedly different effects at different frequencies (Fig. 2D): Under a high frequency stimulus the signaling is terminated quickly leading to very slow transcription. However, under an intermediate frequency, the signaling peaks in each oscillation. Because oscillations are still relatively frequent, signaling results in a high, ever increasing transcriptional output. Under a low frequency, signaling peaks and completely adapts, yet because the encounters with stress are rare this leads to a slow overall transcriptional output. We experimentally tested this hypothesis by tracking Hog1-GFP localization under osmotic oscillations as a proxy of signaling dynamics (Hog1-GFP enters the nucleus when activated; Fig. 2E) and observed a good agreement with the model predictions: the integral under nuclear Hog1-GFP maximizes for an intermediate frequency of 16min (Fig. 3F).
Fig. 3.
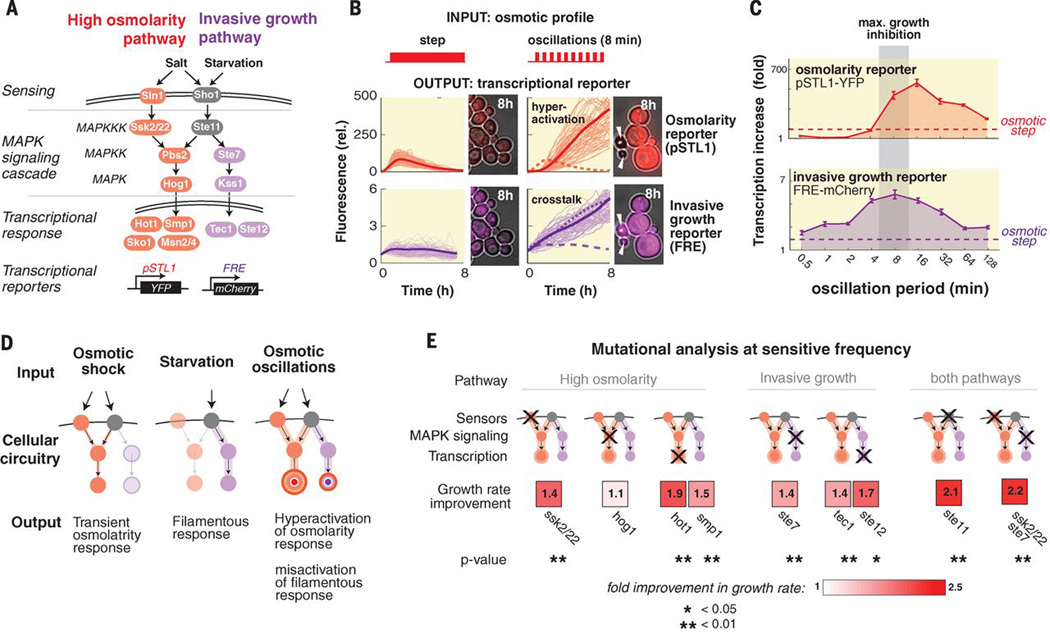
Pathway hyper-activation and crosstalk underlie growth inhibition at the sensitive frequency. (A) A network diagram of the high osmolality and invasive growth pathways. (B) Transcriptional output of the pathways in response to alternative inputs. The graphs show the mean fold induction in florescence per cell and the single cell traces of cells within the interquartile range. Although pathway isolation is maintained under a step input profile, osmotic oscillations lead to hyper-activation of the osmotic response and full activation of the invasive growth pathway. (C) Transcriptional response at various frequencies of osmotic stress (0.4M KCl). The activity of both reporters behaves as a band-pass filter with peaked activity at intermediate frequencies (8–16min). (D) A frequency dependent model of the MAPK network that explains growth inhibition at the resonance frequency. (E) A mutational analysis points to contribution of both the pathways in growth inhibition under osmotic oscillations (0.4M, 8min period). The color code marks the fold improvement of the deleted strain relative to the wild-type strain. Statistical significance was tested with the t-test (comparing the mean growth rate of multiple progeny of the deleted strain and multiple progeny of the co-cultured wild-type strain).
Thus the model points to a plausible cellular mechanism – adaptive signaling dynamics (the ability of the MAPK to reset and retrigger) may lead to downstream pathway hyperactivation at an intermediate resonance frequency. We used live-cell reporters (promoters linked to fluorescent proteins) to examine the transcriptional activity of the osmotic pathway and the intimately related invasive growth MAPK pathway that is triggered by starvation (Fig. 3A) (7, 11). Note that despite sharing many common components, the individual pathways normally remain highly insulated from one another (5–10). Under a single-step osmotic stress, cells transiently induced the osmotic transcriptional response (peaking at 50 fold after 2h, movie S1) with very little effect on the invasive growth pathway (Fig. 3B). However, oscillatory osmolarity led to continuous induction of the osmotic response culminating in pathway hyperactivation (450 fold increase after 8h, movie S1). Moreover, the oscillations also led to full activation of the normally isolated invasive pathway (also consistent with morphology changes observed for some cells, Fig S2). A frequency scan showed that transcription of both pathways peaks at an intermediate frequency range (8–16min) (Fig. 3C). The mating pathway, a third interwoven pathway, remains isolated (Fig S3 and (9, 13)). Thus, stimulation at the resonant frequency led to hyperactivation of the osmotic response, and misactivation of the invasive growth response (Fig. 3D).
To test if both osmotic hyper-activation and cross-talk with the invasive pathway are detrimental to growth, we tested the phenotypes of specific mutations. We reasoned that deletions that weaken pathway activity might improve growth under oscillatory osmotic stress (Fig. 3E and S5). Our measurements indicated that weakening the pathway by deletion of one of the osmosensing branches improved growth (complete knockout of the osmotic pathway did not improve growth since the core protective osmotic response is still necessary even under oscillations). We also observed that knockout of invasive pathway genes is beneficial and that deletions that target shared components in both pathways, such as Ste11 MAPKKK (14), are more advantageous than targeting only one pathway.
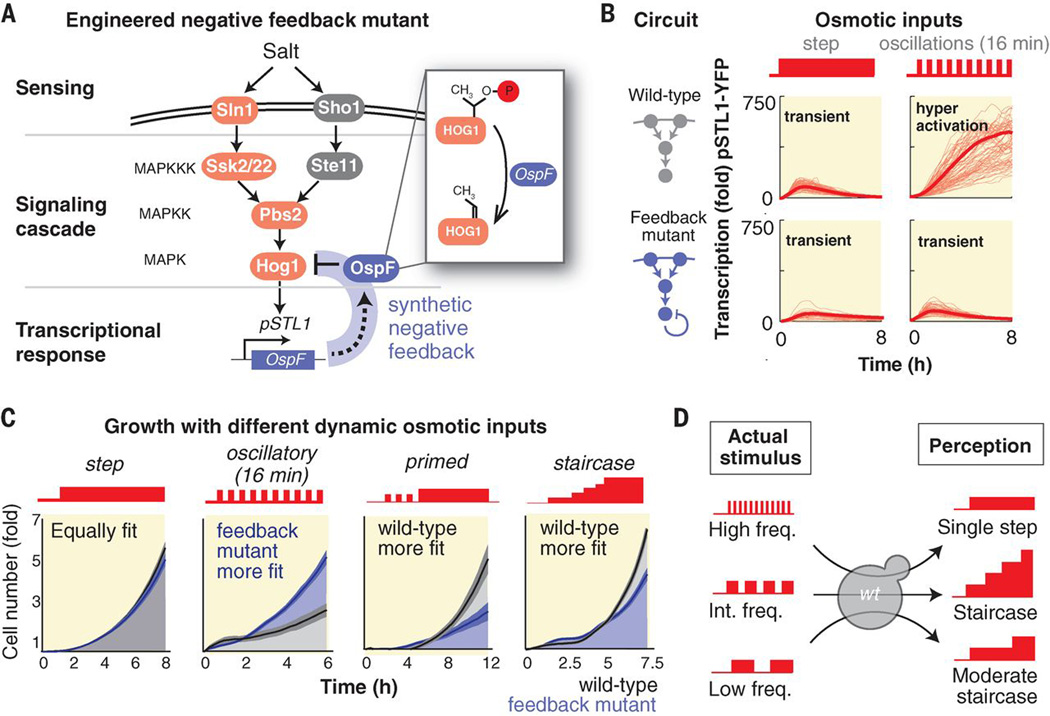
Given the detrimental effects of pathway hyperactivation we reasoned that an improved cascade could be engineered by adding a slow negative feedback loop to the MAPK cascade. Ideally this feedback would allow an initial osmotic response while dampening rapid retriggering (adding a longer refractory period). We implemented a feedback loop using OspF, a previously characterized bacterial effector protein, that irreversibility inactivates phosphorylated Hog1 (15) (Fig. 4A). Monitoring the transcription in an engineered strain showed that the engineered pathway is still responsive to a single-step input but is not hyperactivated under oscillations (Figure 4B, movie S2).
Fig. 4.
Introducing a synthetic feedback loop resolves osmotic hyperactivation and relieves growth inhibition under osmotic oscillations but also reduces proliferation under more natural input dynamics. (A) A diagram of the genetic circuit that underlies the conditional negative feedback. The bacterial effector OspF (fused to an osmotic stress responsive promoter) deactivates phosphorylated Hog1 by removing a hydroxyl group (15), leading to a longer delay in retriggering of the pathway. (B) Transcriptional response of the osmotic pathway in the wild-type strain and engineered strain. Both strains show a transient response after an osmotic shock but respond differently to an oscillating input. The graphs show the mean fold induction in florescence per cell and the single cell traces of cells within the interquartile range. (C) Comparative growth assays of the wild-type and engineered strains under alternative inputs. (D) Growth inhibition under oscillatory input originates from the adaptive nature of the osmotic response. Although the signaling cascade effectively filters oscillatory inputs at a high frequency (16), oscillations in a lower frequency lead to repeated stimulation of the osmotic pathway. In this frequency range the cascade circuitry perceives an oscillatory input as gradually increasing osmolarity and keeps the osmotic pathway continuously active to counteract the seemingly increasing high-osmolality. Growth inhibition is maximized at an intermediate frequency since it is interpreted as the steepest staircase increase in osmolality, which leads to peaked levels of downstream hyperactivation.
We then tested whether this network rewiring could improve growth under alternative dynamic stress inputs (Fig. 4C). Consistent with measurements of transcriptional activity, we observed that the engineered and wild-type strains had equal growth rates when exposed to a single-step of osmotic stress but that the engineered negative-feedback strain grew considerably faster under osmotic oscillations. Nonetheless, when we compared strain growth under more natural types of dynamic stress profiles we observed an opposite trend: Under a primed or gradually increasing osmolarity pattern, as may occur during evaporation of an aqueous niche, the wild-type strain grew faster. Thus there is an inherent tradeoff – our rewiring prevents detrimental pathway hyperactivation in response to oscillations but also leads to impaired growth in dynamic environments that truly require pathway re-activation (such as naturally occurring upward ramps of stress).
The detrimental sensitivity to osmotic oscillations can be viewed as an inherent limitation of the underlying biological system (Fig. 4D). In analogy to a sensory misperception phenomenon, the ability of oscillations to re-trigger the osmotic response is misinterpreted by the cells as an infinite staircase increase in osmolality (16) that culminates in deleterious transcriptional hyperactivation. Thus although the adaptive response allows the biological system to remain responsive in complex environments that it experiences in nature, it also creates an inherent Achilles heel due to its failure to prevent pathway hyperactivation in non-natural oscillating environments. From an evolutionary perspective, this Achilles heel is not significant since the yeast are unlikely to experience oscillatory stress at the resonant frequency.
Our observations in yeast may have implications for the dynamic sensitivities of other biological systems, as many responses display adaptation or the ability to retrigger (17), and these may also have resonance frequency sensitivities. Our results may also be relevant for cellular signaling in disease, as mutations affecting cellular signaling are common in cancer, autoimmune disease, and diabetes. These mutations may rewire the native network, and thus could modify its activation and adaptation dynamics. Such network rewiring in disease may lead to changes that can be most clearly revealed by simulation with oscillatory inputs or other “non-natural” patterns. The changes in network response behaviors could be exploited for diagnosis and functional profiling of disease cells, or potentially taken advantage of as an Achilles heel to selectively target cells bearing the diseased network (18).
Supplementary Material
Acknowledgments
We thank H. Youk, R. Almeida, S. Coyle and M. Thomson for insightful discussions. This work was supported by NIH grants R01 GM55040, R01 GM62583, PN2 EY016546, and P50 GM081879, the NSF Synthetic Biology Engineering Research Center (SynBERC), and the Howard Hughes Medical Institute (HHMI) (to W.A.L.). Supported in part by MOST grant 2015CB910300 and NSFC grant 31470819, and Peking-Tsinghua Center for Life Sciences (to P.W.). A. M. is an EMBO Fellow (ALTF 419-2010) and the Program for Breakthrough Biomedical Research, UCSF.
Footnotes
Materials and Methods
Figures S1. Media switching dynamics.
Figure S2. Frequency scan of cell size and cell morphology
Figure S3. The mating pathway remains inactivated under osmotic oscillations.
Figure S4. The comparative growth assay.
Figure S5. Mutational analysis.
Movie S1 – Cell growth and osmoreponse under time-variant osmostress.
Movie S2 – Cell growth and osmoreponse of wild-type and OspF strains.
Table S1 – plasmids used
Table S2 – strains used.
References
- 1.Saito H, Posas F. Response to hyperosmotic stress. Genetics. 2012;192:289–318. doi: 10.1534/genetics.112.140863. [DOI] [PMC free article] [PubMed] [Google Scholar]
- 2.Brewster JL, de Valoir T, Dwyer ND, Winter E, Gustin MC. An osmosensing signal transduction pathway in yeast. Science. 1993;259:1760–1763. doi: 10.1126/science.7681220. [DOI] [PubMed] [Google Scholar]
- 3.Muzzey D, Gómez-Uribe CA, Mettetal JT, van Oudenaarden A. A systems-level analysis of perfect adaptation in yeast osmoregulation. Cell. 2009;138:160–171. doi: 10.1016/j.cell.2009.04.047. [DOI] [PMC free article] [PubMed] [Google Scholar]
- 4.Alon U. An Introduction to Systems Biology: Design Principles of Biological Circuits. 2006 [Google Scholar]
- 5.Good MC, Zalatan JG, Lim WA. Scaffold proteins: hubs for controlling the flow of cellular information. Science. 2011;332:680–686. doi: 10.1126/science.1198701. [DOI] [PMC free article] [PubMed] [Google Scholar]
- 6.Good M, Tang G, Singleton J, Reményi A, Lim WA. The Ste5 scaffold directs mating signaling by catalytically unlocking the Fus3 MAP kinase for activation. Cell. 2009;136:1085–1097. doi: 10.1016/j.cell.2009.01.049. [DOI] [PMC free article] [PubMed] [Google Scholar]
- 7.Madhani HD, Fink GR. Combinatorial control required for the specificity of yeast MAPK signaling. Science. 1997;275:1314–1317. doi: 10.1126/science.275.5304.1314. [DOI] [PubMed] [Google Scholar]
- 8.Madhani HD, Styles CA, Fink GR. MAP kinases with distinct inhibitory functions impart signaling specificity during yeast differentiation. Cell. 1997;91:673–684. doi: 10.1016/s0092-8674(00)80454-7. [DOI] [PubMed] [Google Scholar]
- 9.O'Rourke SM, Herskowitz I. The Hog1 MAPK prevents cross talk between the HOG and pheromone response MAPK pathways in Saccharomyces cerevisiae. Genes \& development. 1998;12:2874–2886. doi: 10.1101/gad.12.18.2874. [DOI] [PMC free article] [PubMed] [Google Scholar]
- 10.Elion EA. The Ste5p scaffold. Journal of Cell Science. 2001;114:3967–3978. doi: 10.1242/jcs.114.22.3967. [DOI] [PubMed] [Google Scholar]
- 11.Furukawa K, Hohmann S. Synthetic biology: lessons from engineering yeast MAPK signalling pathways. Mol Microbiol. 2013;88:5–19. doi: 10.1111/mmi.12174. [DOI] [PubMed] [Google Scholar]
- 12.Lorenz MC, Cutler NS, Heitman J. Characterization of alcohol-induced filamentous growth in Saccharomyces cerevisiae. Molecular Biology of the Cell. 2000;11:183–199. doi: 10.1091/mbc.11.1.183. [DOI] [PMC free article] [PubMed] [Google Scholar]
- 13.Zalatan JG, Coyle SM, Rajan S, Sidhu SS, Lim WA. Conformational control of the Ste5 scaffold protein insulates against MAP kinase misactivation. Science. 2012;337:1218–1222. doi: 10.1126/science.1220683. [DOI] [PMC free article] [PubMed] [Google Scholar]
- 14.Posas F, Saito H. Osmotic activation of the HOG MAPK pathway via Ste11p MAPKKK: scaffold role of Pbs2p MAPKK. Science. 1997;276:1702–1705. doi: 10.1126/science.276.5319.1702. [DOI] [PubMed] [Google Scholar]
- 15.Wei P, et al. Bacterial virulence proteins as tools to rewire kinase pathways in yeast and immune cells. Nature. 2012;488:384–388. doi: 10.1038/nature11259. [DOI] [PMC free article] [PubMed] [Google Scholar]
- 16.Hersen P, McClean MN, Mahadevan L, Ramanathan S. Signal processing by the HOG MAP kinase pathway. Proc Natl Acad Sci USA. 2008;105:7165–7170. doi: 10.1073/pnas.0710770105. [DOI] [PMC free article] [PubMed] [Google Scholar]
- 17.Purvis JE, Lahav G. Encoding and decoding cellular information through signaling dynamics. Cell. 2013;152:945–956. doi: 10.1016/j.cell.2013.02.005. [DOI] [PMC free article] [PubMed] [Google Scholar]
- 18.Behar M, Barken D, Werner SL, Hoffmann A. The dynamics of signaling as a pharmacological target. Cell. 2013;155:448–461. doi: 10.1016/j.cell.2013.09.018. [DOI] [PMC free article] [PubMed] [Google Scholar]
Associated Data
This section collects any data citations, data availability statements, or supplementary materials included in this article.


