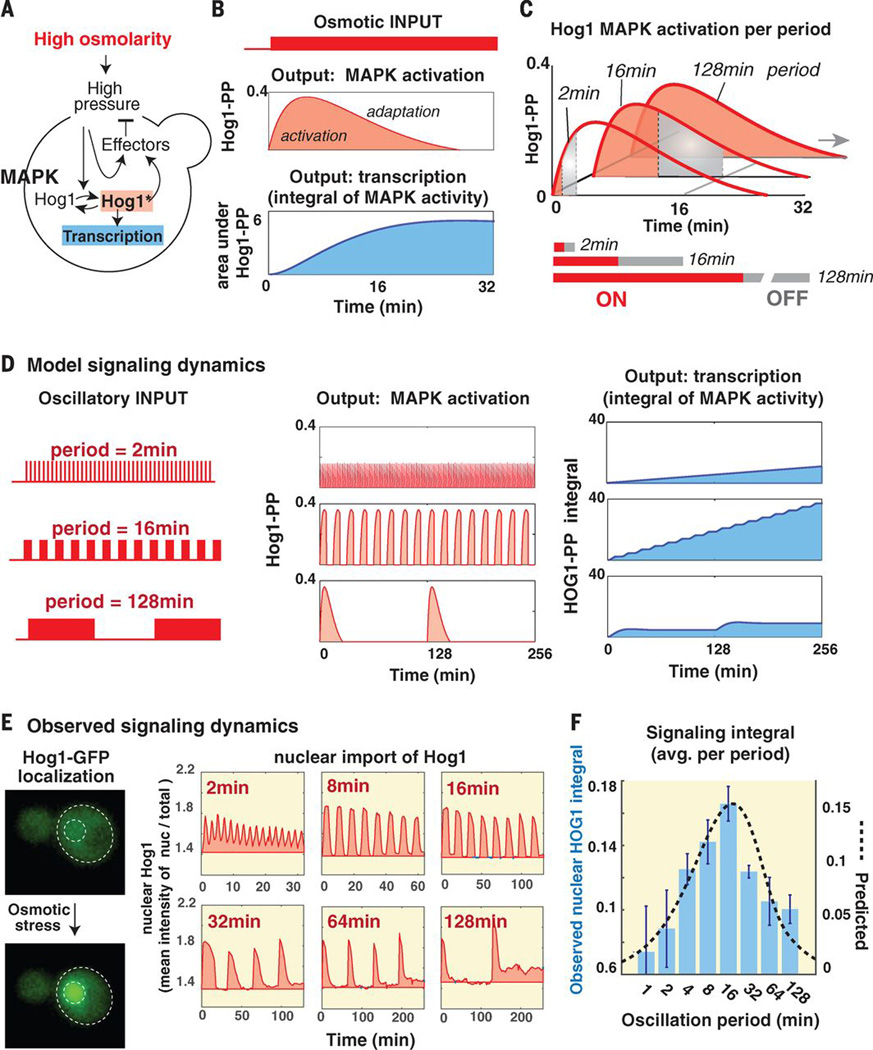
Fig. 2.
Mathematical modeling of adaptive signaling of the osmotic pathway predicts downstream pathway hyperactivation at resonant stress frequency. (A) Schematic of osmotic pathway (3). Changes in turgor pressure activate Hog1-dependent and Hog1-independent response arms that act to reduce deviation from the optimal turgor pressure. (B) Pathway activation according to the perfect adaptation model (3). The top panel shows the predicted amounts of Hog1 phosphorylation in response 0.4M increase in osmolality with induction and adaptation phases. The lower panel shows the integral under the Hog1-PP curve and is taken as an approximation of the accumulated transcriptional output. (C) Pathway activation at three representative pulse durations (ON and OFF intervals are marked in red and gray, respectively). The top panel shows the predicted signaling dynamics and the lower panel shows the area under the signaling curve normalized by pulse duration (ON+OFF). (D) Model predicted signaling and transcriptional dynamics under representative oscillation periods. (E) Experimentally observed signaling dynamics under representative oscillation periods by tracking Hog1-GFP nuclear localization. The panels show the mean intensity ratio of nuclear Hog1-GFP over total Hog1-GFP in 40–100 cells (relative to the basal ratio at t=0min). (E) Measured signaling integral (normalized per min) in a frequency scan. The bars show the average integral in two biological repeats (bars mark the standard deviation). The pink graph marks the model predictions.

