Abstract
Purpose
To identify the presence and extent of artifacts in prostate diffusion-weighted MRI (DW-MRI) and discuss tradeoffs between imaging at 1.5 Tesla (1.5T) and 3.0 Tesla (3.0T). In addition, we aim to provide quantitative estimates of signal-to-noise ratios (SNRs) at both field strengths.
Methods
The institutional review board waived informed consent for this HIPAA-compliant, retrospective study of 53 consecutive men who underwent 3.0T endorectal DW-MRI and 53 consecutive men who underwent 1.5T endorectal DW-MRI between October and December 2010. One radiologist and one physicist, blinded to patient characteristics, image acquisition parameters and field strength, scored DW-MRI artifacts. On b=0 images, SNR was measured as the ratio of the mean signal from a region-of-interest (ROI) at the level of the verumontanum (the “reference region,”) to the standard deviation from the mean signal in an artifact-free ROI in the rectum.
Results
Both readers found geometric distortion and signal graininess significantly more often at 3.0T than at 1.5T (P<0.0001, all comparisons). Reader 2 (but not Reader 1) found ghosting artifacts more often at 3.0T (P=0.001) and blurring more often at 1.5T (P=0.006). Mean SNR at the urethra (87.92±27.76) at 3.0T was 1.43 times higher than at 1.5T (64.51±14.96) (P < 0.0001).
Conclusion
At 3.0T (as compared to 1.5T), increased SNR on prostate DW-MRI comes at the expense of geometric distortion and can also lead to more pronounced ghosting artifacts. Therefore, to take full advantage of the benefits of 3.0T, further improvements in acquisition techniques are needed to address DW-MRI artifacts corresponding to higher field strengths.
INTRODUCTION
Diffusion-weighted MR imaging (DW-MRI) is a promising technique that can provide both qualitative and quantitative information regarding the mobility of water molecules within tissue, can be added to existing imaging protocols without a substantial increase in the overall examination time (1–5 minutes), and does not require the administration of exogenous contrast material (1). Preliminary studies at both 1.5 Tesla (T) (2–5) and 3.0T (6–8) have suggested that DW-MRI may have clinical utility in the detection and management of prostate cancer. The recent trend is toward the use of 3.0T clinical MRI scanners, under the premise of exploiting potential benefits of a higher signal-to-noise ratio (SNR).
DW-MR images are most commonly collected using acquisition schemes based on the widely available single-shot spin-echo echo-planar imaging (SSSE-EPI) sequence, using a pair of rectangular-shaped gradient pulses along three orthogonal axes. The ‘snapshot’ image acquisition methodology minimizes motion artifacts, hence minimizing the need for advanced post-processing. However, SSSE-EPI is vulnerable to susceptibility-related image artifacts, which can have a detrimental effect on image quality and can interfere with diagnostic interpretation. Susceptibility artifacts occur near the interfaces of materials of different magnetic susceptibility, such as bone-soft tissue or air-tissue interfaces, as the result of microscopic gradients or frequency shifts. The artifacts that result from these local magnetic field inhomogeneities are spatial displacements of several pixels (i.e., image distortion) and/or signal dropout. It has been suggested that susceptibility artifacts can increase exponentially with field strength (9), and they are known to cause significant geometric image distortions, stretching, and blurring on DW-MR images at 3.0T (10). Other limitations of EPI acquisition are the relatively low spatial resolution achievable with the present hardware and the inherently long echo-train, which lead to image blurring.
DW-MRI parameters are sensitive to phase shift due to microscopic motion. When the body moves several millimeters or more, artifacts can result that impact both the numerical calculation of diffusion-related parameters and the image display. Motion during the acquisition of k-space will result in “ghosts” along the phase-encoding direction.
Prostate cancer is the most common non-cutaneous cancer in American men (11). Since the introduction of prostate specific antigen (PSA) testing in the 1980’s, there has been a downward trend in cancer stage at the time of diagnosis (12, 13). Although many prostate cancers have an excellent prognosis and are consider indolent, there is a still a subgroup of patients with rapidly progressing and often fatal disease. In the absence of non invasive and accurate detection and risk-stratification methods, there is increasing interest in the potential role of MRI in this clinical context.
It is often thought that state-of-the-art prostate imaging involves the use of a 3.0T MRI unit and multi-parametric MRI techniques. Incorporating DW-MRI, dynamic contrast-enhanced MRI, and MR spectroscopic imaging in addition to conventional T2-weighted images has been shown to increase specificity for prostate cancer detection and localization (14). Imaging at 3.0T provides higher SNR and, according to some authors, high-quality images of the prostate without the use of an endorectal coil (15). However, there are also potential disadvantages of imaging at 3.0T compared to lower field strengths, including increased imaging artifacts (16). The aim of this study was to identify the presence and extent of artifacts in prostate diffusion-weighted MRI (DW-MRI) and discuss tradeoffs between imaging at 1.5T and 3.0T. In addition, we aimed to provide quantitative estimates of signal-to-noise ratios (SNRs) at both field strengths.
MATERIALS AND METHODS
Our institutional review board waived the requirement for informed consent for this retrospective study, which was compliant with the Health Insurance Portability and Accountability Act. We included consecutive patients (n=53; median age, 64 years; age range, 37–86 years) who underwent a 3.0T MRI exam of the prostate that included DW-MRI between October and December 2010. In addition, we identified and included a set of 53 consecutive patients (median age, 62 years; age range, 41–83 years) who had a 1.5T MRI exam of the prostate that included DW-MRI between October and December 2010. Distribution of patient characteristics is summarized in Table 1.
Table 1.
Distribution of Patient Characteristics
| 1.5T | 3.0T | |||
|---|---|---|---|---|
|
| ||||
| N | % | N | % | |
| Biopsy Gleason Grade | ||||
|
| ||||
| 3+3 | 30 | 57 | 29 | 55 |
| 3+4 | 13 | 25 | 11 | 21 |
| 4+3 | 6 | 11 | 8 | 15 |
| 4+4 | 3 | 5 | 3 | 5 |
| 4+5 | 1 | 2 | 2 | 4 |
|
| ||||
| Median | Range | Median | Range | |
|
| ||||
| Age (years) | 62 | 41–83 | 64 | 37–86 |
| PSA (ng/mL) | 4.60 | 0.05 – 18.9 | 4.90 | 0.05 – 36.4 |
MRI Data Acquisition
1.5T MRI examinations were performed on a whole-body unit (Signa Excite Lx; GE Medical Systems, Milwaukee, WI) using a combined pelvic four-channel phased-array coil combined with a commercially available balloon-covered expandable endorectal coil (Medrad, Pittsburgh, PA) for signal reception. 3.0T MRI examinations were performed on a whole-body unit (Signa Excite Lx; GE Medical Systems, Milwaukee, WI) using a pelvic eight-channel phased-array coil and a commercially available balloon-covered expandable endorectal coil (Medrad, Pittsburgh, PA) for signal reception. For both sets of patients a localization sequence was followed by the acquisition of transverse, sagittal, and coronal T2-weighted (T2W) fast spin-echo images of the prostate and seminal vesicles. DW-MR images were acquired with the sequence parameters summarized in Table 2.
Table 2.
Distribution of acquisition parameters
| Parameter | 1.5T | 3.0T |
|---|---|---|
|
| ||
| TE | 80.6 [72.4, 89.8] ms | 77.6 [69.6, 101.2] ms |
| TR | 3500 [2925, 5075] ms | 3500 [3300, 6300] ms |
| FOV | 140 mm | 160 mm |
| matrix(frequency×phase) | 96×96 | 128×128 |
| Slice thickness | 3 mm | 3 mm |
| Voxel size | 1.46×1.46×3 mm | 1.25×1.25×3 mm |
| Acceleration Factor | 2 | 2 |
| Pixel Bandwidth | 1304 Hz | 1953 Hz |
Image Analysis
All images were analyzed separately by two researchers: one radiologist (--) with 4 years of experience and one physicist (--) with 7 years of experience. Both readers were blinded to the field strength, the clinical findings and sequence parameters and were asked to interpret only the quality of the diffusion images.
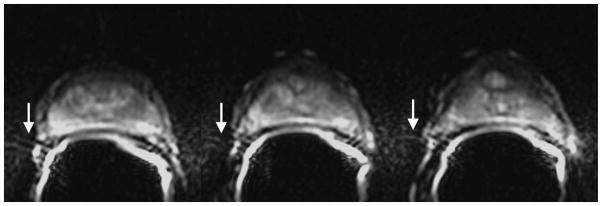
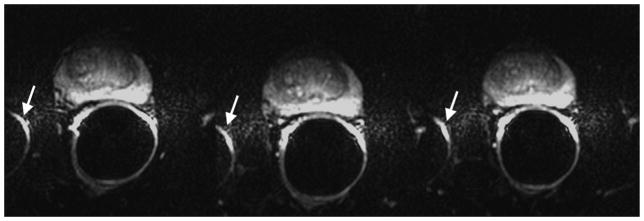
Images were reviewed on a picture archiving and communication system (PACS) workstation (Centricity PACS, GE Healthcare). For each patient, a summary sheet was generated to characterize the type(s) of artifacts observed. The readers agreed in advance on the types of artifact that would be noted and their definitions (summarized in Table 3). In addition to the above, for each case, the area(s) worst affected by artifacts were also noted from the following four options: none, seminal vesicles/base, midgland, and apex. Adequacy of endorectal coil positioning was also assessed. Figures 1–3 show susceptibility-related, ghosting and motion artifacts.
Table 3.
Summary of artifacts and their descriptions
| Artifact | Description |
|---|---|
|
| |
| Motion/Ghosting | Artifacts caused by patient or organ motion during acquisition of data creating ghost images in the phase-encode direction |
| Image Blurring | Image blurring due to the low spatial resolution and long-echo train of the EPI acquisition |
| Susceptibility | Artifacts that occur near the interfaces of materials of different magnetic susceptibility, manifesting as spatial displacement of several pixels and/or signal dropout |
| Geometric distortion | Distortions due to magnetic field inhomogeneity |
| Signal “graininess” | The presence of noise, which gives the image a mottled, grainy, textured, or snowy appearance (a qualitive measure of signal-to-noise ratio) |
Figure 1.
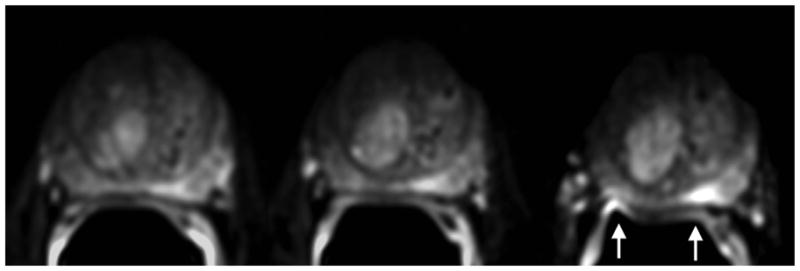
Susceptibility-induced image distortion at 3.0T. Shown are three consecutive axial slices. The air in the rectum or within the balloon of the endorectal coil causes local magnetic field inhomogeneity and susceptibility-related artifacts. Images were obtained with the following imaging parameters: b-value = 1000 s/mm2, TR/TE = 3500/76.8 ms, 2 NEX, matrix 128×128, FOV 160×160 mm2, resolution 1.25×1.25×3 mm3.
Figure 3.
Motion/ghosting and susceptibility-related artifacts at 3.0T DW-MRI. Shown are three consecutive axial slices. Artifacts that occur close to or through the prostate can obscure the anatomy and limit tumor detection. Sequence parameters are identical to those used for Figure 1.
The physicist estimated the SNR for each patient using b=0 images. First, the mean signal intensity within a region-of-interest (ROI) was measured at the level of the verumontanum (reference region); then, a second ROI was identified within the air cavity inside the rectum where no apparent ghosting artifacts were present, and the standard deviation from the mean signal intensity of voxels within the ROI was determined as an estimate of the noise. The ROI selection areas were contained within a 5.62×5.62 mm2 rectangle. The ratio of the mean signal intensity of the reference region (drawn on the original b=0 images) to the standard deviation of signal intensity within the noise ROI was used as an estimate of the SNR.
Estimation of the spatial sensitivity profile of the endorectal coil at each field strength was performed by the physicist in the following manner: First, from the DW-MR image series, the central axial slice covering the urethra of the prostate with b=0 was selected, and a low-pass Gaussian filter with a radius (or sigma value) of 4 voxels was performed. This was done to estimate the signal variation caused by the coil profile itself rather than by local pathology. The filtered image was subsequently cropped to a rectangular region to cover the prostate. The central bottom region of the prostate was selected arbitrarily as the reference region. The normalized SNR (nSNR) profile for all regions was expressed as a ratio of the mean SNR from each region to that of the reference region. All quantitative measurements were performed using both MATLAB software (version 7.1, Mathworks, Natick, MA) and ImageJ analysis software (version 1.41o).
Statistical Analysis
Statistics for all continuous and ordinal data were reported as mean±SD. The Wilcoxon signed rank test was used to test statistical significance. A P value of 0.05 or less was defined as significant.
RESULTS
Table 4 summarizes the frequency with which individual types of artifacts were identified by each reader on 1.5T and 3.0T DW-MR imaging studies. According to reader 1, ghosting artifacts due to motion were present in both 1.5T and 3.0T imaging studies, and the number of cases exhibiting these artifacts did not differ significantly between the two field strengths. Reader 2 found ghosting artifacts significantly more often in studies obtained at 3.0T than in those obtained at 1.5T and, conversely, found that blurring affected a significantly greater number of studies obtained at 1.5T as compared to 3.0T. Neither reader noted a significant difference in the occurrence of susceptibility-related artifacts between field strengths. As for geometric distortion, both readers found it significantly more often among 3.0T imaging studies than among 1.5T imaging studies (P < 0.0001 for both readers). Finally, both readers noted that significantly more 1.5T images than 3.0T images were impacted by low SNR (P < 0.0001 for both readers). Neither reader found as association between incorrect coil placement and the presence and/or extent of artifacts at either field strength.
Table 4.
Comparison of rates of occurrence of image artifacts among 1.5T and 3.0T DW-MR images according to two readers. The values represent the percentages of cases where the readers indicated that the artifact was present, while the values in brackets represent the actual numbers of cases in which each artifact was present out of a total of 53 patients in each group.
| Artifact | Reader 1 – Radiologist | Reader 2- Physicist | ||||
|---|---|---|---|---|---|---|
|
| ||||||
| 1.5T | 3.0T | P†‡ | 1.5T | 3.0T | P†‡ | |
| Motion/Ghosting | 86.8 [46] | 96.2 [51] | 0.1 (NS) | 20.8 [11] | 52.8 [28] | 0.001 |
| Blurring | 18.9 [10] | 24.5 [13] | 0.5 (NS) | 30.2 [16] | 7.5 [4] | 0.006 |
| Susceptibility | 7.5 [4] | 3.8 [2] | 0.3 (NS) | 13.2 [7] | 26.4 [14] | 0.09 (NS) |
| Geometric distortion | 26.5 [14] | 79.2 [42] | <0.0001 | 39.6 [21] | 81.1 [43] | <0.0001 |
| Signal “graininess” | 75.5 [40] | 9.4 [5] | <0.0001 | 58.5 [31] | 13.2 [7] | <0.0001 |
| Incorrect coil placement | 5.7 [3] | 1.9 [1] | 0.6 (NS) | 1.9 [1] | 1.9 [1] | 1.0 (NS) |
P < 0.05 is considered statistically significant.
NS indicates not significant.
Table 5 shows the locations of area(s) worst affected by artifacts at the two magnetic field strengths according to each reader. Notably, reader 1 found substantial numbers of artifacts at the seminal vesicles/base on both 1.5T and 3.0T imaging studies (35/53 and 43/53, respectively).
Table 5.
Comparison of the locations of area(s) worst affected by artifacts on 1.5T and 3.0T DW-MR imaging studies as determined by each reader. The readers selected from the following options: none, seminal vesicles/base, midgland, and apex. The values represent the percentages of cases where the readers indicated that the artifact was present, while the values in brackets represent the actual numbers of cases out of a total of 53 patients in each group.
| Artifact | Reader 1 – Radiologist | Reader 2 - Physicist | ||||
|---|---|---|---|---|---|---|
|
| ||||||
| 1.5T | 3.0T | P†‡ | 1.5T | 3.0T | P†‡ | |
| None | 5.7 [3] | 13.2 [7] | 0.1 (NS) | 45.3 [24] | 18.9 [10] | 0.002 |
| Seminal vesicles/base | 66.0 [35] | 81.1 [43] | 0.1 (NS) | 22.6 [12] | 35.9 [19] | 0.1 (NS) |
| Midgland | 7.5 [4] | 11.2 [6] | 0.1 (NS) | 13.2 [7] | 34.0 [18] | 0.09 (NS) |
| Apex | 35.8 [19] | 17.0 [9] | 0.09 (NS) | 34.0 [18] | 21.0 [11] | 0.5 (NS) |
P < 0.05 is considered statistically significant.
NS indicates not significant.
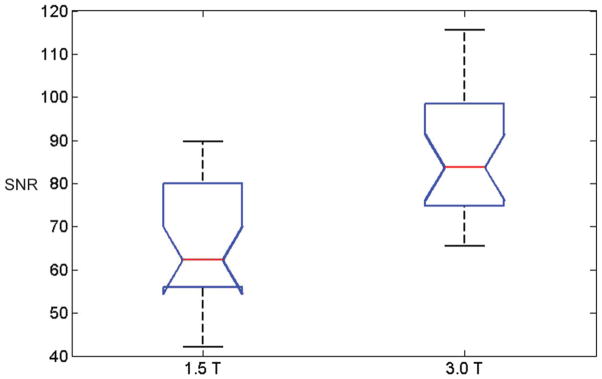
Figure 4 shows box-and-whisker plot of the SNR measurements of the reference ROIs at 1.5T and 3.0T. In this plot, comparison intervals are drawn using notches. Two median SNR measurements are significantly different (at the 5% significance level) since their intervals do not overlap. The SNR in 1.5T ROIs (mean±SD, 64.51±14.96) was significantly lower than the SNR in 3.0T ROIs (mean±SD 87.92±27.76) (P < 0.0001). The ratio of the mean SNR of the reference ROI at 3.0T to the mean SNR at 1.5T was 1.43±0.55.
Figure 4.
Box-and-whisker plot of the SNRs of the reference regions in 53 patients imaged at 1.5T and 53 patients imaged at 3.0T. The red line indicates the median, the whiskers indicate the range, and the box indicates the 25th and 75th percentiles. Comparison intervals are drawn using notches. The interval endpoints are the extremes of the notches or the centers of the triangular markers.
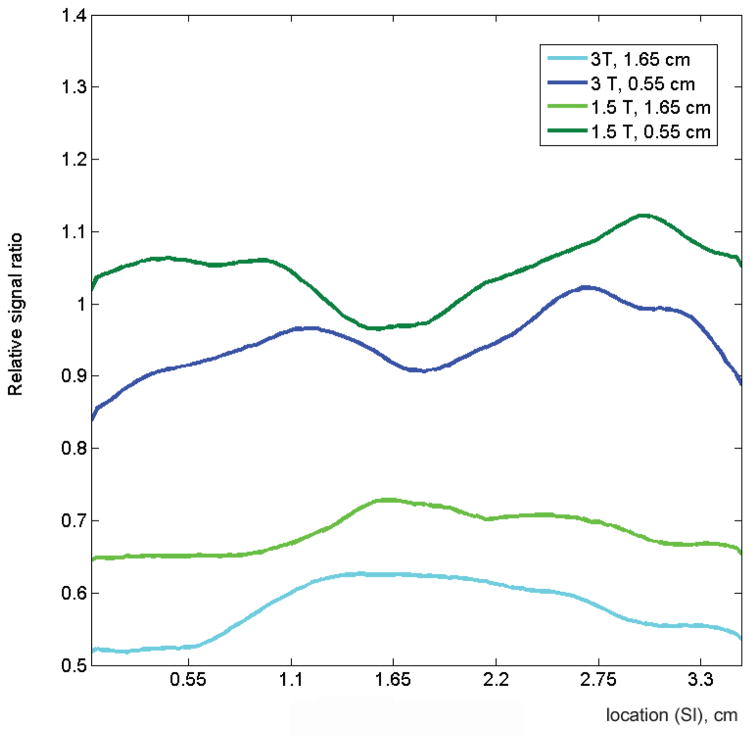
Figure 5 shows comparisons of the average normalized SNRs of all patients for each field strength, derived from b=0 images. The mesh plot provides a comparison of the normalized SNR profile, averaged over all patients, at the two magnetic field strengths. Also shown are representative profiles in the right-left (RL) and superior-inferior (SI) planes. The normalized profiles obtained from the two field strengths are similar, but the normalized 3.0T profile is consistently lower than the normalized 1.5T profile.
Figure 5.
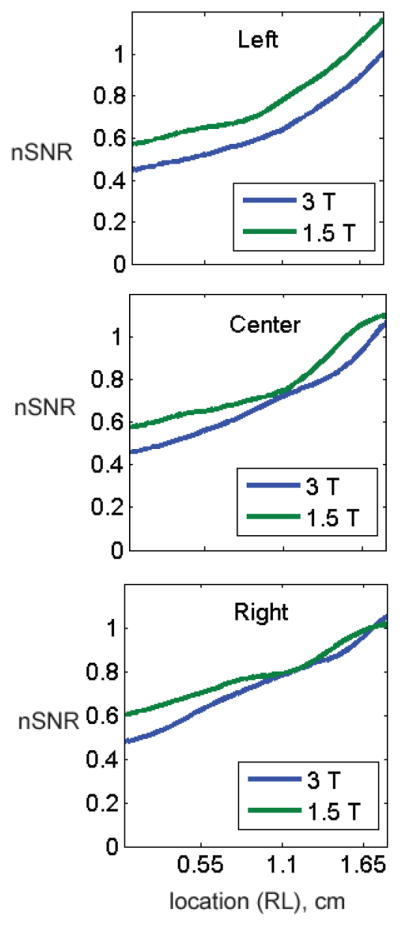
(A) Mesh surface displays of the average normalized SNRs (nSNRs) of all patients for each field strength derived from b=0 images. Both displays demonstrate a drop in nSNR as a function of distance from the coil, with a rapid drop in SNR towards the anterior portion and edges of the prostate. Average nSNR profiles in (B) three horizontal (right-to-left, RL) planes located in the left, center and right planes and (C) two vertical (superior-inferior, SI) planes located at distances of 0.55 cm and 1.65 cm from the bottom of the coil are show. Overall, the normalized profiles are similar for the two field strengths in both the RL and SI planes. However, the normalized profile of 3.0T images is consistently lower than that of 1.5T images.
DISCUSSION
Our study provided two alternative assessments of DW-MR image quality. First, the readers, blinded to the field strength and the clinical findings, indicated the presence and extent of artifacts selected from a pre-determined list. Secondly, a quantitative measure of the SNR was obtained for each imaging study. In terms of artifacts, both readers agreed that geometric distortions occurred more often at 3.0T than at 1.5T and that the signal was more grainy (an indirect qualitative measure of SNR) at 1.5T. The quantitative measure of SNR at the base of the prostate was found to be significantly greater at 3.0T than at 1.5T. Voxel volume was 1.36 times larger at 1.5T compared to 3.0T (6.39 mm3 at 1.5T compared to 4.70 mm3 at 3.0T). However, due to lower field strength, the signal remained grainier at 1.5T compared to 3.0T. Although these results are consistent with expected trade-offs associated with the use of a higher field strength (resulting in more SNR) while using smaller voxel size (resulting in less SNR), they highlight the fact that improved DW-MR images of the prostate at 3.0T can only be expected if the corresponding artifacts are addressed.
A drawback of using endorectal coils is the non-uniform reception signal profile along the imaging plane. The profile is impacted by a number of factors including coil design, field strength, and placement of the coil. This signal intensity is significantly brighter near the coils than deeper in the prostate.
In our study, we used acceleration factors of two for both field strengths. Parallel imaging techniques (such as SENSE (17) and SMASH (18)) reduce distortion and improve image quality on DW-MRI. Parallel imaging allows for a reduction of the number of phase-encoding steps that are necessary for image generation, hence reducing distortion and speeding up the image acquisition (19). The reduced echo train length provided by parallel imaging reduces susceptibility artifacts in the SSSE-EPI sequence commonly used for MR-DWI. Further improvements in parallel imaging could have an important impact on the quality of DW-MRI.
There was no significant association between the anatomical location of artifacts (seminal vesicles/prostate base, prostate midgland or prostatic apex) and MRI field strength for either reader. However, according to both readers, the majority of artifacts were located in the region of the seminal vesicles, prostatic base or apex. The prostatic midgland was the least affected by artifacts. It is plausible that the majority of the artifacts are at the upper and lowermost parts of the probe because of the geometric distortion caused by pronounced susceptibility effects at soft tissue interfaces with the air cavity. Care must be taken to avoid overlap of the right to left ghosting artifacts of the bright rectal wall with the peripheral zone, so as not to limit detection of extracapsular extension near the peripheral zone and rectum (20).
In our study, the imaging protocol for each field strength was optimized independently, thus we did not use identical sequence parameters for acquiring DW-MR images at 3.0T and 1.5T. The TEs and TRs used at 3.0T DW-MRI were not substantially different from those used at 1.5T DW-MRI. However, the voxel size, pixel bandwidth, and the number of phased-array coil channels were all different at 3.0T than at 1.5T. This partly explains why the intrinsic SNR did not double with the doubling of the field strength from 1.5T to 3.0T, as theoretically expected. The above stated differences in the 1.5T protocol compared to the 3.0T protocol contribute towards differences in signal “graininess in the two field strengths”.
All images were acquired with an endorectal coil inflated with air. Inflating the inner balloon with a liquid rather than air increases magnetic field homogeneity by eliminating the air-tissue interface and thereby reduces susceptibility artifacts, which are more severe at 3.0T than at 1.5T. Liquids that have reportedly been used to fill the balloon have included nonabsorbable agents such as barium sulfate suspensions (21), perfluorochemicals (PFC) (22), or kaopectate (23). Inflating the endorectal coil with barium sulfate suspensions or PFC results in greater local magnetic field homogeneity and improves the spectral resolution compared to air without contributing contaminating signal to the 1H spectrum. Barium suspension provides an available, cheap, and safe alternative to PFC (24).
Overall, the two readers, a radiologist and a physicist had similarities on rates of occurrence of image artifacts among 1.5T and 3.0T DW-MR images. However, there were also differences. Reader 2 (but not Reader 1) found ghosting artifacts more often at 3.0T and blurring more often at 1.5T.
Recently Rosenkrantz et al compared DW-MR image quality, ADC values, and ADC reproducibility of abdominal organs obtained at 1.5T and 3.0T in 8 healthy volunteers. The authors found generally similar ADC values at 1.5T and 3.0T for all assessed organs. However, comparison of subjectively rated image quality yielded worse image quality at 3.0T compared to 1.5T. They concluded that this finding indicated the need for improvement of abdominal DW-MRI at 3.0T. The finding is consistent with the work of Kuhl et al (9), which also showed worse image distortion at 3.0T in intra-individual assessments of DW-MRI in the brain at 1.5T and 3.0T. Our study is consistent with the findings of these prior studies of DW-MRI in the abdomen and brain, as it shows that improvements in image acquisition techniques are needed for 3.0T DW-MRI of the prostate as well.
Our study has several limitations. First, we did not account for eddy current-related artifacts in our DW-MR images, nor did we account for off-resonance chemical shift effects due to fat. There was no clear approach to distinguish the effects of eddy currents and image misregistration from artifacts based on the data available for this retrospective study. Second, ADC maps or values were not incorporated in our analysis. Without pathological validation (such as step-section pathology) comparison of ADC values has limited potential, as the values are affected by pathology as well as the MR acquisition technique. In this study, we did not require step-section pathology as an inclusion criterion, and hence we did not incorporate ADC analysis in our investigation. Given that ADC is a powerful tool to characterize diffusion properties within the prostate, further analysis on the impact of artifacts on ADC measurements is warranted. It also was not possible to compare diffusion artifacts within the same patients at 1.5.0T and 3.0T, as each patient only underwent imaging at one field strength. Third, comparison between 1.5.0T and 3.0T were made with images were acquired with an endorectal coil. At many institutions, MRI of the prostate is performed without the use of an endorectal coil (using only phased-array coil). Comparison of DW image quality using phased-array coils is warranted. Finally, for the purpose of this study we used scanners from a single manufacturer and platform. Evaluation of artifacts that occur with the use of newer platforms and with MRI units made by other manufactures may be warranted.
In conclusion, using a combination of qualitative and quantitative analyses, we showed that DW-MR images of the prostate obtained at 3.0T have higher SNRs but more pronounced geometric distortion and ghosting artifacts than those obtained at 1.5T. Further improvements in image acquisition techniques are needed to reduce artifacts in 3.0T DW-MR images of the prostate.
Figure 2.
3.0T DW-MR images showing the impact of field inhomogeneity. Ghosting artifacts of the bright rectal wall are seen on the right and left sides of prostate on three consecutive axial slices. Due to the location of the prostate within the field-of-view, ghosting artifacts have not wrapped back onto the prostate. Sequence parameters are identical to those used for Figure 1.
Acknowledgments
We are grateful to Ada Muellner, M.S. for helping to edit this manuscript. This research was supported by the National Institutes of Health (R01 CA76423 to H.H.).
Footnotes
Publisher's Disclaimer: This is a PDF file of an unedited manuscript that has been accepted for publication. As a service to our customers we are providing this early version of the manuscript. The manuscript will undergo copyediting, typesetting, and review of the resulting proof before it is published in its final citable form. Please note that during the production process errors may be discovered which could affect the content, and all legal disclaimers that apply to the journal pertain.
References
- 1.Koh DM, Collins DJ. Diffusion-weighted MRI in the body: applications and challenges in oncology. Ajr. 2007;188(6):1622–35. doi: 10.2214/AJR.06.1403. [DOI] [PubMed] [Google Scholar]
- 2.Issa B. In vivo measurement of the apparent diffusion coefficient in normal and malignant prostatic tissues using echo-planar imaging. J Magn Reson Imaging. 2002;16(2):196–200. doi: 10.1002/jmri.10139. [DOI] [PubMed] [Google Scholar]
- 3.Shimofusa R, Fujimoto H, Akamata H, et al. Diffusion-weighted imaging of prostate cancer. Journal of computer assisted tomography. 2005;29(2):149–53. doi: 10.1097/01.rct.0000156396.13522.f2. [DOI] [PubMed] [Google Scholar]
- 4.Sato C, Naganawa S, Nakamura T, et al. Differentiation of noncancerous tissue and cancer lesions by apparent diffusion coefficient values in transition and peripheral zones of the prostate. J Magn Reson Imaging. 2005;21(3):258–62. doi: 10.1002/jmri.20251. [DOI] [PubMed] [Google Scholar]
- 5.Hosseinzadeh K, Schwarz SD. Endorectal diffusion-weighted imaging in prostate cancer to differentiate malignant and benign peripheral zone tissue. J Magn Reson Imaging. 2004;20(4):654–61. doi: 10.1002/jmri.20159. [DOI] [PubMed] [Google Scholar]
- 6.Gibbs P, Pickles MD, Turnbull LW. Diffusion imaging of the prostate at 3.0 tesla. Investigative radiology. 2006;41(2):185–8. doi: 10.1097/01.rli.0000192418.30684.14. [DOI] [PubMed] [Google Scholar]
- 7.Kim CK, Park BK, Han JJ, Kang TW, Lee HM. Diffusion-weighted imaging of the prostate at 3 T for differentiation of malignant and benign tissue in transition and peripheral zones: preliminary results. Journal of computer assisted tomography. 2007;31(3):449–54. doi: 10.1097/01.rct.0000243456.00437.59. [DOI] [PubMed] [Google Scholar]
- 8.Vargas HA, Akin O, Franiel T, et al. Diffusion-weighted endorectal MR imaging at 3 T for prostate cancer: tumor detection and assessment of aggressiveness. Radiology. 2011;259(3):775–84. doi: 10.1148/radiol.11102066. [DOI] [PMC free article] [PubMed] [Google Scholar]
- 9.Kuhl CK, Gieseke J, von Falkenhausen M, et al. Sensitivity encoding for diffusion-weighted MR imaging at 3.0 T: intraindividual comparative study. Radiology. 2005;234(2):517–26. doi: 10.1148/radiol.2342031626. [DOI] [PubMed] [Google Scholar]
- 10.Gillard JH, Papadakis NG, Martin K, et al. MR diffusion tensor imaging of white matter tract disruption in stroke at 3 T. The British journal of radiology. 2001;74(883):642–7. doi: 10.1259/bjr.74.883.740642. [DOI] [PubMed] [Google Scholar]
- 11.Siegel R, Naishadham D, Jemal A. Cancer statistics, 2012. CA: a cancer journal for clinicians. 2012;62(1):10–29. doi: 10.3322/caac.20138. [DOI] [PubMed] [Google Scholar]
- 12.Cooperberg MR, Broering JM, Carroll PR. Time trends and local variation in primary treatment of localized prostate cancer. J Clin Oncol. 2010;28(7):1117–23. doi: 10.1200/JCO.2009.26.0133. [DOI] [PMC free article] [PubMed] [Google Scholar]
- 13.Jemal A, Ward E, Thun M. Declining death rates reflect progress against cancer. PLoS One. 2010;5(3):e9584. doi: 10.1371/journal.pone.0009584. [DOI] [PMC free article] [PubMed] [Google Scholar]
- 14.Hoeks CM, Barentsz JO, Hambrock T, et al. Prostate cancer: multiparametric MR imaging for detection, localization, and staging. Radiology. 2011;261(1):46–66. doi: 10.1148/radiol.11091822. [DOI] [PubMed] [Google Scholar]
- 15.Barentsz JO, Richenberg J, Clements R, et al. ESUR prostate MR guidelines 2012. European radiology. 2012;22(4):746–57. doi: 10.1007/s00330-011-2377-y. [DOI] [PMC free article] [PubMed] [Google Scholar]
- 16.Cornfeld DM, Weinreb JC. MR imaging of the prostate: 1.5T versus 3T. Magnetic resonance imaging clinics of North America. 2007;15(3):433–48. viii. doi: 10.1016/j.mric.2007.06.004. [DOI] [PubMed] [Google Scholar]
- 17.Pruessmann KP, Weiger M, Scheidegger MB, Boesiger P. SENSE: sensitivity encoding for fast MRI. Magn Reson Med. 1999;42(5):952–62. [PubMed] [Google Scholar]
- 18.Sodickson DK, Griswold MA, Jakob PM. SMASH imaging. Magnetic resonance imaging clinics of North America. 1999;7(2):237–54. vii–viii. [PubMed] [Google Scholar]
- 19.Bammer R, Auer M, Keeling SL, et al. Diffusion tensor imaging using single-shot SENSE-EPI. Magn Reson Med. 2002;48(1):128–36. doi: 10.1002/mrm.10184. [DOI] [PubMed] [Google Scholar]
- 20.Noworolski SM, Crane JC, Vigneron DB, Kurhanewicz J. A clinical comparison of rigid and inflatable endorectal-coil probes for MRI and 3D MR spectroscopic imaging (MRSI) of the prostate. J Magn Reson Imaging. 2008;27(5):1077–82. doi: 10.1002/jmri.21331. [DOI] [PMC free article] [PubMed] [Google Scholar]
- 21.Rosen Y, Bloch BN, Lenkinski RE, Greenman RL, Marquis RP, Rofsky NM. 3T MR of the prostate: reducing susceptibility gradients by inflating the endorectal coil with a barium sulfate suspension. Magn Reson Med. 2007;57(5):898–904. doi: 10.1002/mrm.21166. [DOI] [PubMed] [Google Scholar]
- 22.Brown JJ, Duncan JR, Heiken JP, et al. Perfluoroctylbromide as a gastrointestinal contrast agent for MR imaging: use with and without glucagon. Radiology. 1991;181(2):455–60. doi: 10.1148/radiology.181.2.1924788. [DOI] [PubMed] [Google Scholar]
- 23.Mitchell DG, Vinitski S, Mohamed FB, Mammone JF, Haidet K, Rifkin MD. Comparison of Kaopectate with barium for negative and positive enteric contrast at MR imaging. Radiology. 1991;181(2):475–80. doi: 10.1148/radiology.181.2.1924791. [DOI] [PubMed] [Google Scholar]
- 24.Panaccione JL, Ros PR, Torres GM, Burton SS. Rectal barium in pelvic MR imaging: initial results. J Magn Reson Imaging. 1991;1(5):605–7. doi: 10.1002/jmri.1880010515. [DOI] [PubMed] [Google Scholar]


