

Abstract
Measurement of the nuclear DNA content allows classification of human cancers as either diploid or aneuploid. To gain further insight into mechanisms of aneuploidy, we compared the cytogenetic profile of mismatch-repair–deficient diploid versus mismatch-repair–proficient aneuploid colorectal carcinoma cell lines using comparative genomic hybridization and spectral karyotyping. Aneuploid carcinomas revealed an average of 19 chromosomal imbalances per cell line. Such numerical aberrations were exceedingly scarce in the diploid tumors. This pattern of chromosomal aberrations is consistent with a mechanism involving the impairment of chromosome segregation fidelity during mitotic cell division. In support of this idea, we demonstrate the exclusive occurrence of centrosome amplification and instability in all of the aneuploid tumor cell lines analyzed. All diploid tumors contained centrosomes that were functionally and structurally indistinguishable from those in normal human fibroblasts. Due to the observed differences in centrosomes between these two classes of tumors, we incubated the cells with the microtubule depolymerizing drugs nocodazole and griseofulvin. Our results indicate that the aneuploid tumor cell lines have an increased sensitivity to these reagents and a delay in aster formation and microtubule regrowth. However, microtubule nucleation was initiated from one or two centers in both the diploid and aneuploid cells. These observations support the notion that the integrity of the centrosome plays a central role in the development of aneuploidy.
Introduction
The application of comparative genomic hybridization (CGH) for the identification of DNA copy number changes has revealed a surprisingly tumor type-specific pattern of chromosomal copy number changes in virtually all human carcinomas (Forozan et al., 1997; Ried et al., 1999). This finding suggests that mechanisms controlling the fidelity of proper chromosome segregation during mitosis play an important role in the development of aneuploid tumors. In this respect, colorectal carcinomas are an ideal model system for studying such processes because these tumors can be divided into two classes; those with a diploid genome and those that contain gross alterations in their nuclear DNA content (aneuploidy). Indeed, the comparison of diploid and aneuploid colorectal carcinoma cell lines revealed a different pattern of genome instability (Schlegel et al., 1995; Eshleman et al., 1998), and further studies indicated that mutations of mitotic checkpoints contribute to frequent chromosome segregation errors (Lengauer et al., 1997; Cahill et al., 1998).
It is also tempting to speculate that cellular structures involved in chromosome segregation at mitosis could contribute to chromosomal gains and losses. In its role as the cellular organizer of the spindle apparatus responsible for the physical separation of sister chromatids during mitosis, the centrosome is a candidate worthy of further study. Prior to mitotic cell division, the centrosome duplicates and moves to the opposite poles of the nucleus where it nucleates microtubules and organizes the spindle apparatus. In mouse embryonic fibroblasts, the absence of wild-type TP53 or BRCA1 greatly perturbs the centrosome cycle, and cells with abnormal centrosome numbers are frequently observed (Fukasawa et al., 1996; Xu et al., 1999). Centrosome amplification has also been observed in human tumors (Lingle et al., 1998; Pihan et al., 1998). In an attempt to understand whether aberrant centrosomes are involved in the generation of genetically distinct tumors, we examined these structures in both diploid and aneuploid colorectal cancer cell lines. Centrosome number, structure, and function were analyzed using a fluorescently labeled antibody directed against γ-tubulin, electron microscopy, and microtubule nucleation assays, respectively. The results of these assays were compared with the cytogenetic profiles of each tumor type generated by CGH and spectral karyotyping (SKY). We also explored the response of colorectal tumor cell lines with unstable (aneuploid) and stable (diploid) centrosomes to the microtubule depolymerizing drugs nocodazole and griseofulvin.
Material and Methods
Cell Lines
The following cell lines were purchased from ATCC: SW48, HCT116, and DLD-1 (all diploid and/or tetraploid); SW837, SW480, LoVo, HT-29, COLO-201, T-84, and Caco2 (all aneuploid). Mismatch repair status was retrieved from the literature (Lengauer et al., 1997; Cahill et al., 1998).
CGH and SKY
For CGH, tumor DNA was labeled with biotin-16-dUTP and sex-matched reference DNA with digoxigenin-11-dUTP (both Boehringer Mannheim). In situ hybridization and detection was performed essentially as described (Ried et al., 1996). Gray-scale images were acquired with a cooled CCD camera (Sensys, Photometrics, Tucson, AZ) mounted to a Leica DMRXA microscope equipped with fluorochrome-specific optical filters (Chroma Technology, Brattleboro, VT) using Leica Q-FISH software. CGH analyses were performed with Cytovision software (Applied Imaging).
Metaphase chromosomes for SKY analyses were prepared according to standard procedures. SKY analyses followed published protocols (Schröck et al., 1996). Briefly, 24 differentially labeled chromosome painting probes were hybridized to metaphase chromosomes. Biotin-labeled probes were detected using avidin-Cy5 (Amersham) and digoxigenin-labeled sequences were detected with a mouse anti-digoxigenin antibody followed by a goat anti-mouse antibody conjugated to Cy5.5 (Amersham) and images were acquired using a Spectracube (Applied Spectral Imaging) and the SkyView software package (Applied Spectral Imaging). Hybridizations were analyzed by assigning spectra-specific pseudocolors to all chromosomes. Inverted DAPI images were contrast-enhanced using SkyView.
Immunofluorescence
Cells were grown on Falcon culture slides (Becton and Dickinson, NJ), permeabilized with Triton 0.5% in PHEM Buffer, and fixed in −20°C methanol. Centrosomes were detected with a polyclonal antibody against γ-tubulin (Sigma, diluted 1:2,000 in 1% goat serum) for 1 hr at 37°C, followed by three washes in PBS. The primary antibody was detected with a fluorescein-conjugated goat anti-rabbit antibody (Sigma, diluted 1:1,000 in 1% goat serum) followed by three washes in 1 × PBS. Cells were counterstained with propidium iodide, immersed in an antifade solution, and coverslipped. Images were acquired using Leica Q-FISH software. One hundred and fifty nuclei were evaluated and centrosome number and structure were recorded. Immunofluorescent detection of centrosomes was repeated by another investigator and enumerated. Only isolated cells were counted.
Microtubule Nucleation Assay
Cell lines were grown on Falcon culture slides. Cells were then incubated with the microtubule destabilizer nocodazole (10 μg/ml) for 1.5 hr at 37°C, washed five times with 1 × PBS at room temperature, and incubated in PBS for 2 and 30 min to determine recovery times. Slides were then fixed in -20°C methanol. Microtubule structures were detected using a monoclonal anti–γ-tubulin antibody (1:500 in 1% BSA for 1 hr, Sigma). The primary antibody was detected with an FITC-labeled sheep antimouse antibody (1:500, 1 hr, Sigma) and cells counterstained with propidium iodide. Asters were counted when clear signals at the periphery of the nucleus were detected. The completion of microtubule regrowth was scored when the pattern of immunofluorescence resembled the one prior to the nocodazole induced depolymerization.
Griseofulvin Toxicity Assay
Cell lines were plated at different concentrations in Falcon culture dishes. They were incubated for 5–8 hr to allow attachment. The media were replaced with media containing different concentrations of griseofulvin (0, 5, 10, 20, and 40 μg/ml). Incubation with griseofulvin-containing media was for 24 hr. Cells were washed in PBS, trypsinized, and live cells counted after trypan blue exclusion.
Electron Microscopy
Cells were cultured on glass coverslips (22 × 22 mm2), washed in PBS, and fixed in 3% glutaraldehyde. Thin sections were examined in a Hitachi H-7000 transmission electron microscope operated at 75 kV.
Results
Comparative Genomic Hybridization and Spectral Karyotyping
In order to identify and map chromosomal gains and losses, all cell lines were analyzed using CGH. DNA copy number changes were present in all cancer cell lines and the chromosomal distribution of DNA copy alterations, such as the frequent gain of 7, 8q, 13q, and 20q, was in agreement with previous studies on aneuploid colorectal carcinomas (Ried et al., 1996). Examples of the CGH analyses for cell lines DLD-1 (diploid) and HT29 (aneuploid) are shown in Figure 1A and B. DLD-1 revealed an almost balanced genome and DNA gains and losses were only detected on 2p14–22, 6p25, and 11p15.3–15.5. In HT29, 16 sites of copy number imbalances were identified on 13 chromosomes. The data for all cell lines are summarized in Table 1. The average number of copy alterations (ANCA) in the diploid, mismatch-repair–deficient cell lines amounts to 3.7. Significantly more chromosomal copy number variations were detected in the aneuploid tumors in which the ANCA was 19.5.
Figure 1.
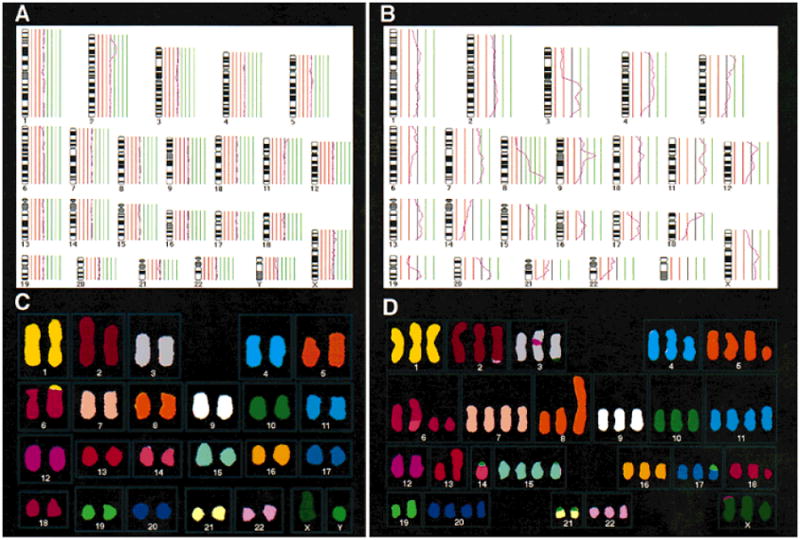
CGH and SKY. The average CGH ratio profiles for the diploid cell line DLD-1 and the aneuploid cell line HT29 are presented in A and B. Note the remarkably stable genome of DLD-1 with only three copy number variations (chromosomes 2, 6, and 11). HT29 shows a highly aberrant ratio profile, with copy number alterations occurring on 13 chromosomes. The gains of 7, 8q, 13, and 20q are common aberrations in colorectal carcinomas. SKY of metaphase chromosomes prepared from these cell lines is shown in C and D. No numerical aberrations were identified in the diploid cell line (C), whereas trisomies were common in the aneuploid cell line HT29 (D). All aberrations detected by SKY were also seen by CGH analysis. This indicates that no reciprocal, balanced chromosomal translocations have occurred.
Table 1. Summary of Ploidy, MMR Status, and Centrosome Numbers, Function, and Chromosomal Aberration Patterns in 10 Colorectal Carcinoma Cell Lines.
| Cell line | Ploidy | MMR | Centrosome | Chromosomal aberrations | ||
|---|---|---|---|---|---|---|
|
|
|
|||||
| Numbers (elevated in % of cells) | Function | Numerical | Structural | |||
| HCT116 | Diploid | Deficient | 0% | Intact | 0 | 3 |
| SW 48 | Diploid | Deficient | 0% | Intact | 1 | 5 |
| DLD-1 | Diploid | Deficient | 0% | Intact | 0 | 3 |
| LoVo | Aneuploid | Deficient | 30% | Intermediate | 4 | 2 |
| SW 837 | Aneuploid | Proficient | 50% | Impaired | 18 | 15 |
| SW 480 | Aneuploid | Proficient | 35% | Impaired | 19 | 17 |
| HT29 | Aneuploid | Proficient | 25% | Impaired | 17 | 19 |
| Colo-201 | Aneuploid | Proficient | 0% | Impaired | 19 | 26 |
| T-84 | Aneuploid | Proficient | 35% | 22 | 15 | |
| Caco2 | Aneuploid | Proficient | 35% | 18 | 16 | |
CGH is limited, however, in that no information regarding the nature of chromosomal aberrations causing the genomic imbalances can be extracted. We therefore applied SKY to determine whether the copy number changes detected by CGH were caused by numerical aberrations including whole chromosome gains and losses and aberrations involving entire chromosome arms. Figure 1C shows the SKY analysis results of metaphase chromosomes from the diploid cell line DLD-1. Few structural aberrations, namely t(1;6), dup(2p), and dup(11p), could be identified. No whole chromosome or whole chromosome arm aberrations were detected. In contrast, the aneuploid cell line HT29 contained 36 chromosomal aberrations, 17 of which involved entire chromosomes and chromosomal arms (Fig. 1D). In summary, the average number of whole chromosome or whole chromosome arm aberrations per cell was 18.8 in the aneuploid tumor cell lines. An average of only 0.3 numerical aberrations per cell was detected in the diploid cell lines. Thus, aneuploid tumors had a 63-fold increase in the amount of numerical chromosomal aberrations over the diploid tumors, whereas there was only a 4.5-fold increase in the number of structural, unbalanced aberrations (Table 1).
Centrosomes
Centrosomes can be visualized immunocytochemically with antibodies directed against γ-tubulin (Oakley et al., 1990) and appear in normal G1/S-phase fibroblasts as a compact, punctuate structure adjacent to the nuclear membrane. Figure 2 displays centrosome staining in normal human fibroblasts as well as representative diploid (DLD-1) and aneuploid (HT29, SW837, LoVo) cell lines. Centrosome analysis in each mismatch-repair–deficient diploid tumor cell line revealed a pattern that was indistinguishable from normal human fibroblasts (Fig. 2B). The aneuploid cell lines, however, contained gross irregularities in both centrosome number and structure as revealed by epifluorescence detection with FITC-conjugated anti–γ-tubulin antibodies (Fig. 2C–E). A variable percentage of cells of the aneuploid cancer lines contained 3–7 centrosomes, many of which appeared structurally aberrant as defined by their heterogeneity in size and shape (Fig. 2C–E, Table 1). In addition, some of the supernumerary centrosomes were detached from the nucleus (Fig. 2E). Six of seven aneuploid cell lines with centrosome irregularities had either TP53 mutations or expressed increased levels of the protein.
Figure 2.
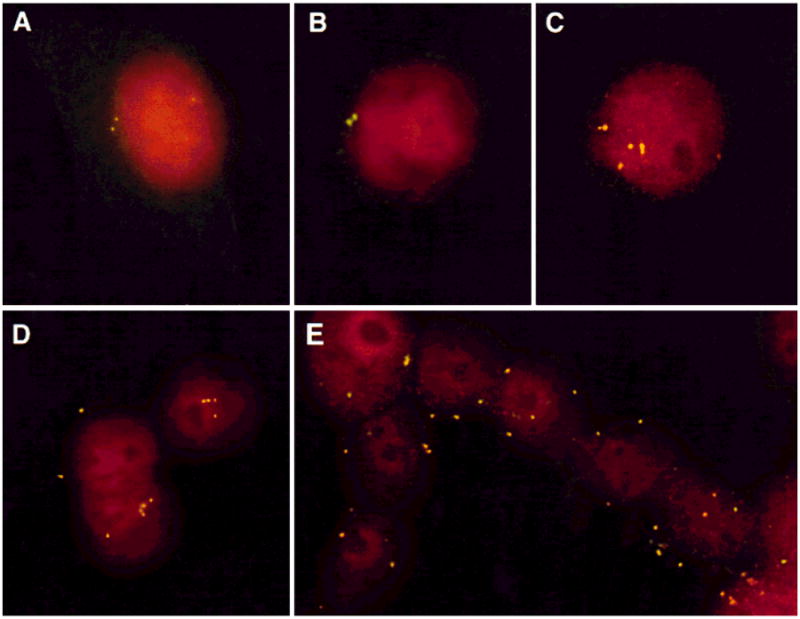
Centrosome amplification in cell lines established from colorectal carcinomas. Centrosomes were detected after staining with an antibody directed against γ-tubulin. A: In normal human fibroblasts, centrosomes appear as point-like structures and never exceed two copies per cell. B: An identical pattern was observed in the mismatch-repair–deficient diploid cell lines, as shown for DLD-1. C–E: Gross variation in centrosome number occurred in the aneuploid cell lines, with up to eight centrosomes per cell: SW837(C), LoVo(D), HT29(E). As many as 20%–50% of the cells were enumerated with aberrant centrosome numbers. Note that in addition to centrosome number, variations in structure appear, such as significant differences in the size of the centrosomes (see, e.g., C).
In order to evaluate functional aspects of centrosomes, i.e., microtubule nucleation activity, we performed a nocodazole washout assay. The amount of time required for the reformation of microtubules from the endogenous pool of α- and (β-tubulin was assessed for normal human fibroblasts and the tumor cell lines DLD1, HCT116, SW48, SW837, HT29, Colo201, SW480, and LoVo. In concordance with the observed numerical and structural aberrations seen in the aneuploid cell lines, the nucleation capacity of these centrosomes was greatly diminished and the recovery after nocodazole treatment significantly delayed. Normal human fibroblasts and the diploid, mismatch-repair–deficient cell lines DLD-1, HCT116, and SW48 showed recovery after 2 min as visualized by the formation of asters, with full recovery achieved by 30 min (Fig. 3A–F, respectively, and Table 2). The aneuploid cell lines HT29, SW837, SW480, and Colo201 showed severe impairment of the centrosomes' ability to nucleate microtubules after 2 min recovery. After 30 min of recovery time, nucleation activity was detected in only 5% of the cells (Fig. 3J–L). This indicates a distinct impairment of centrosome function as yet another defining characteristic of these aneuploid tumor cell lines.
Figure 3.
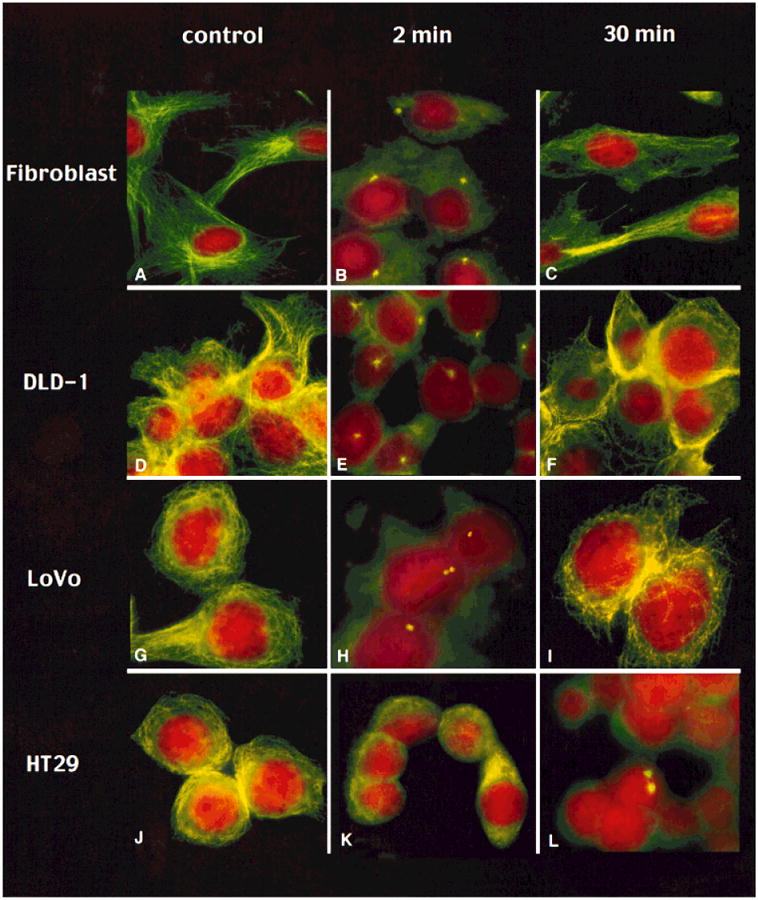
Time course of microtubule nucleation assay after nocodazole treatment of normal human fibroblasts (A–C), the diploid cell line DLD-1 (D–F), and the aneuploid cell lines LoVo (G–I) and HT29 (J–L). The column on the left (no nocodazole) shows the tubulin network of the cells after staining with an antibody against α-tubulin. The center column shows the cells 2 min after nocodazole removal. The column on the right displays cells 30 min after removal of nocodazole. In normal fibroblasts and the diploid tumor cell line DLD-1, nucleation activity is observed after 2 min of recovery by emerging asters, and full recovery has occurred after 30 min in all cells. The cell line LoVo, which is aneuploid and mismatch-repair–deficient, shows beginning recovery in few cells after 2 min, yet in a lower percentage of cells than the normal fibroblasts and the diploid cell line DLD-1. In contrast, HT29 shows no regrowth after 2 min and only 5% reveal nucleating centers after 30 min.
Table 2. Microtubule Regrowth After Nocodazole Washout.
| Cell line | Aster formation | Microtubule reassembly 30 min | |
|---|---|---|---|
|
| |||
| 2 min | 30min | ||
| Fibroblast | + | + | |
| HCT116 | + | + | |
| SW 48 | + | + | |
| DLD-1 | + | + | |
| LoVo | +/− | + | |
| SW 480 | − | +/− | − |
| HT29 | − | +/− | − |
| Colo-201 | − | +/− | − |
The cell line LoVo revealed a pattern different from that seen in both the diploid and aneuploid cell lines. Asters were not visible after 2 min but accumulation of unorganized tubulin was observed. Full recovery of the tubulin network, however, was accomplished after 30 min (Fig. 3G–I). This correlates well with the intermediate phenotype of LoVo with regard to the other parameters analyzed: LoVo had an ANCA value that was higher than the diploid but significantly lower than the grossly aneuploid tumors (Table 1). It has an aneuploid DNA content, but shows microsatellite instability as well. As such, this particular cell line deviates from the observed pattern of the diploid and aneuploid tumor cell lines.
In addition to the inability to recover aster formation after nocodazole treatment, the number of nucleating centers is also an important measure of centrosome function. Nucleation activity in normal fibroblasts and the three diploid tumor cell lines DLD-1, HCT116, and SW48 as well as LoVo was initiated from either one or two centrosomes. Invariably, microtubule nucleation in the aneuploid cell lines was always initiated from two centrosomes in the low percentage of nucleating centers in the aneuploid cell line HT29, SW480, and Colo-201. This indicates that only those centrosomes that remained attached to the nucleus displayed nucleation activity and that only those centrosomes that are able to duplicate recover after nocodazole induced microtubule depletion. This interpretation is corroborated by data using serial sections and electron microscopy. We could not observe intact centrioles in the aneuploid cell lines in the periphery of the cells (data not shown).
These results indicate an increased sensitivity of aneuploid tumor cell lines to the microtubule destabilizing reagent nocodazole. In order to explore whether this reflects a more general phenomenon, we exposed the diploid and aneuploid cell lines to griseofulvin. Griseofulvin destabilizes microtubules, induces structural changes to tubulin, and binds to the centrosome. All of the aneuploid cell lines tested responded strongly to griseofulvin and ceased to divide at concentrations of griseofulvin (10 μg/ml) that had no effect on either normal human fibroblasts or diploid tumors after 36-hr exposure to the drug. An assay examining the growth inhibitory effect of griseofulvin after 96 hr was unable to detect any statistically significant difference between diploid and aneuploid colorectal cell lines.
Discussion
Our comprehensive cytogenetic evaluation of the pattern of chromosomal aberrations in diploid and aneuploid colorectal cancer cell lines by CGH and SKY points to several distinguishing features between these two groups. The most important difference is that the mechanism by which the high number of chromosomal aberrations in aneuploid cell lines occur seems to be different to diploid cell lines. The frequency of aberrations that could be explained by a chromosome segregation error during mitotic cell division was 63 times higher in aneuploid cell lines. This suggests that genomic imbalances acquired via numerical chromosomal aberrations are the premier cytogenetic event in aneuploid colorectal carcinoma cell lines.
Work by Lengauer et al. (1997) and Cahill et al. (1998) elucidated some aspects of this apparent discrepancy. They showed that chromosomal instability occurred exclusively in the aneuploid tumors with a segregation error occurring as frequently as once in every 5 cell divisions, that mutations in mitotic check point genes occurred in the aneuploid but not the diploid tumors, and that aneuploidy arose upon expression of a mutant version of the yeast homolog of BUB in diploid cells.
Recently published work provides evidence for centrosome amplification in malignant tumors (Lingle et al., 1998; Pihan et al., 1998). Overexpression of the STK15 kinase and the POLO like kinase (PLK1), which are among the kinases that colocalize with the centrosome, can induce centrosome amplification and aneuploidy in cell lines (Galaktionov et al., 1995; Sen et al., 1997; Zhou et al., 1998). The fact that colorectal carcinoma cell lines have such a distinctly different cytogenetic profile prompted us to assess the involvement of centrosome abnormalities as a defining parameter for the induction of chromosome segregation errors and the development of aneuploidy. All but one of the aneuploid cell lines revealed significantly increased centrosome numbers, a pattern that was never observed in the diploid cell lines.
In addition to centrosome number, we attempted to understand functional aspects of centrosomes in the diploid and aneuploid cell lines. Centrosomes in aneuploid tumors were more sensitive to nocodazole treatment than in diploid tumors and normal fibroblast controls, as the recovery time after nocodazole release was greatly prolonged. In fibroblast controls and diploid tumor cells, recovery was initiated from one centrosome. However, even in cells that revealed centrosome amplification, such as HT29 and LoVo, nucleation was never initiated from more than two centers. This indicates that not all centrosomes in aneuploid cells are equal in terms of their potential to nucleate microtubules. Because we have observed multiple cytoplasmic centrosomes in the aneuploid cell lines, we interpret these findings as evidence that detached centrosomes are less capable of microtubule organization than their counterparts close to the nucleus. Alternatively, the cellular structures detected with the antibody against γ-tubulin are nonfunctional, fragmented centrosomes. This hierarchy of centrosomes is not surprising as it is difficult to envision how cell division would continue if every centrosome was equally equipped to participate in chromosome segregation. The consequences of such equality, namely catastrophic mitoses, were not observed in the cell lines analyzed here. We rather conclude that the existence of multiple centrosomes increases the probability for chromosomal segregation errors to occur. This is in striking contrast to the observation of multiple functionally active centrosomes in mouse embryonic fibroblasts defective for the tumor suppressor genes TP53 and BRCA1 (Fukasawa et al., 1996; Xu et al., 1999). The remarkable fragility of centrosomes in aneuploid tumors is further underlined by the division arrest exerted by low concentrations of griseofulvin.
Six of seven aneuploid tumors showed gains or genomic amplification of chromosome arm 20q. This copy number change was not detected in diploid tumors. The gene for the centrosome-associated serine/threonine kinase aurora localizes to 20q and was recently shown to be amplified in a variety of tumors. Overexpression of this gene resulted in centrosome amplification and aneuploidy (Sen et al., 1997; Zhou et al., 1998). Two aneuploid tumor cell lines also carried a copy number increase on chromosome arm 16p, which is the site for another kinase, PLK1, known to be involved in the maturation of mitotic centrosomes (Golsteyn et al., 1994; Lane and Nigg, 1996).
Our results provide direct evidence that chromosome segregation errors correlate with abnormalities in centrosome number, structure, and function and occur exclusively in aneuploid tumor cell lines. The analysis of a larger series of human tumors might establish further evidence that the vast majority of aneuploid carcinomas could be the result of a disease of the centrosome, and that centrosome instability defines the mechanism along which aneuploid tumors develop. These findings corroborate the hypotheses established a century ago by Theodor Boveri (1914) on the role of abnormal centrosomes and unequal chromosome segregation for malignant transformation.
Acknowledgments
The authors are grateful to Dr. Richard D. Klausner for helpful discussions and to Tamara Howard and David L. Spector for help with electron microscopy. B.M.G. received a postdoctoral fellowship from the Deutsche Krebshilfe.
Footnotes
This article is a US Government work and, as such, is in the public domain in the United States of America.
References
- Boveri T. Zur Frage der Entstehung maligner Tumoren. Gustav Fischer; Jena: 1914. [Google Scholar]
- Cahill DP, Lengauer C, Yu J, Riggins GJ, Willson JKV, Markowitz SD, Kinzler KW, Vogelstein B. Mutations of mitotic checkpoint genes in human cancers. Nature. 1998;392:300–303. doi: 10.1038/32688. [DOI] [PubMed] [Google Scholar]
- Eshleman JR, Casey G, Kochera ME, Sedwick WD, Swinler SE, Veigl ML, Wilson JKV, Schwartz S, Markowitz SD. Chromosome number and structure both are remarkedly stable in RER colorectal cancers and are not destabilized by mutations of p53. Oncogene. 1998;17:719–725. doi: 10.1038/sj.onc.1201986. [DOI] [PubMed] [Google Scholar]
- Forozan F, Karhu R, Kononen J, Kallioniemi A, Kallioniemi OP. Genome screening by comparative genomic hybridization. Trends Genet. 1997;13:405–409. doi: 10.1016/s0168-9525(97)01244-4. [DOI] [PubMed] [Google Scholar]
- Fukasawa K, Choi T, Kuriyama R, Rulong S, Vande Woude GF. Abnormal centrosome amplification in the absence of p53. Science. 1996;271:1744–1747. doi: 10.1126/science.271.5256.1744. [DOI] [PubMed] [Google Scholar]
- Galaktionov K, Lee AK, Eckstein J, Draetta G, Meckler J, Loda M, Beach D. CDC25 phosphatases as potential human oncogenes. Science. 1995;269:1575–1577. doi: 10.1126/science.7667636. [DOI] [PubMed] [Google Scholar]
- Golsteyn RM, Schultz SJ, Bartek J, Ziemiecki A, Ried T, Nigg EA. Cell cycle analysis and chromosomal localization of human Plk1, a putative homologue of the mitotic kinases Drosophila polo and Saccharomyces cerevisiae Cdc5. J Cell Sci. 1994;107:1509–1517. doi: 10.1242/jcs.107.6.1509. [DOI] [PubMed] [Google Scholar]
- Lane HA, Nigg EA. Antibody microinjection reveals an essential role for human polo-like kinase 1 (Plk1) in the functional maturation of mitotic centrosomes. J Cell Biol. 1996;135:1701–1713. doi: 10.1083/jcb.135.6.1701. [DOI] [PMC free article] [PubMed] [Google Scholar]
- Lengauer C, Kinzler KW, Vogelstein B. Genetic instability in colorectal cancers. Nature. 1997;386:623–627. doi: 10.1038/386623a0. [DOI] [PubMed] [Google Scholar]
- Lingle WL, Lutz WH, Ingle JN, Maihle NJ, Salisbury JL. Centrosome hypertrophy in human breast tumors: implications for genomic stability and cell polarity. Proc Natl Acad Sci USA. 1998;95:2950–2955. doi: 10.1073/pnas.95.6.2950. [DOI] [PMC free article] [PubMed] [Google Scholar]
- Oakley BR, Oakley CE, Yoon Y, Jung MK. Gamma-tubulin is a component of the spindle pole body that is essential for microtubule function in Aspergillus nidulans. Cell. 1990;61:1289–1301. doi: 10.1016/0092-8674(90)90693-9. [DOI] [PubMed] [Google Scholar]
- Pihan GA, Purohit A, Wallace J, Knecht H, Woda B, Quesenberry P, Doxsey SJ. Centrosome defects and genetic instability in malignant tumors. Cancer Res. 1998;58:3974–3985. [PubMed] [Google Scholar]
- Ried T, Knutzen R, Steinbeck R, Blegen H, Schröck E, Heselmeyer K, du Manoir S, Auer G. Comparative genomic hybridization reveals a specific pattern of chromosomal gains and losses during the genesis of colorectal tumors. Genes Chromosomes Cancer. 1996;15:234–245. doi: 10.1002/(SICI)1098-2264(199604)15:4<234::AID-GCC5>3.0.CO;2-2. [DOI] [PubMed] [Google Scholar]
- Ried T, Heselmeyer-Haddad K, Blegen H, Schröck E, Auer G. Genomic changes defining genesis, progression and malignancy potential in human solid tumors: a phenotype/genotype correlation. Genes Chromosomes Cancer. 1999;25:195–204. doi: 10.1002/(sici)1098-2264(199907)25:3<195::aid-gcc1>3.0.co;2-8. [DOI] [PubMed] [Google Scholar]
- Schlegel J, Stumm G, Scherthan H, Bocker T, Zirngibl H, Ruschoff J, Hofstödter F. Comparative genomic in situ hybridization of colon carcinomas with replication error. Cancer Res. 1995;55:6002–6005. [PubMed] [Google Scholar]
- Schröck E, du Manoir S, Veldman T, Schoell B, Wienberg J, Ferguson-Smith MA, Ning Y, Ledbetter DH, Bar-Am I, Soenksen D, Garini Y, Ried T. Multicolor spectral karyotyping of human chromosomes. Science. 1996;273:494–497. doi: 10.1126/science.273.5274.494. [DOI] [PubMed] [Google Scholar]
- Sen S, Zhou H, White RA. A putative serine/threonine kinase encoding gene BTAK on chromosome 20q13 is amplified and overexpressed in human breast cancer cell lines. Oncogene. 1997;14:2195–2200. doi: 10.1038/sj.onc.1201065. [DOI] [PubMed] [Google Scholar]
- Xu X, Weaver Z, Linke S, Li C, Gotay J, Wang XW, Ried T, Deng CD. Centrosome amplification and defective G2/M checkpoint induce genetic instability in BRCA1 exon 11 isoform(s)-deficient mice. Molec Cell. 1999;3:389–395. doi: 10.1016/s1097-2765(00)80466-9. [DOI] [PubMed] [Google Scholar]
- Zhou H, Kuang J, Zhong L, Kuo WL, Gray JW, Sahin A, Brinkely BR, Sen S. Tumor amplified kinase STK15/BTAK induces centrosome amplification, aneuploidy and transformation. Nat Genet. 1998;20:189–193. doi: 10.1038/2496. [DOI] [PubMed] [Google Scholar]