

Abstract
Purpose
There is a wide spectrum of tumor responsiveness of rectal adenocarcinomas to preoperative chemoradiotherapy ranging from complete response to complete resistance. This study aimed to investigate whether parallel gene expression profiling of the primary tumor can contribute to stratification of patients into groups of responders or nonresponders.
Patients and Methods
Pretherapeutic biopsies from 30 locally advanced rectal carcinomas were analyzed for gene expression signatures using microarrays. All patients were participants of a phase III clinical trial (CAO/ARO/AIO-94, German Rectal Cancer Trial) and were randomized to receive a preoperative combined-modality therapy including fluorouracil and radiation. Class comparison was used to identify a set of genes that were differentially expressed between responders and nonresponders as measured by T level downsizing and histopathologic tumor regression grading.
Results
In an initial set of 23 patients, responders and nonresponders showed significantly different expression levels for 54 genes (P < .001). The ability to predict response to therapy using gene expression profiles was rigorously evaluated using leave-one-out cross-validation. Tumor behavior was correctly predicted in 83% of patients (P = .02). Sensitivity (correct prediction of response) was 78%, and specificity (correct prediction of nonresponse) was 86%, with a positive and negative predictive value of 78% and 86%, respectively.
Conclusion
Our results suggest that pretherapeutic gene expression profiling may assist in response prediction of rectal adenocarcinomas to preoperative chemoradiotherapy. The implementation of gene expression profiles for treatment stratification and clinical management of cancer patients requires validation in large, independent studies, which are now warranted.
INTRODUCTION
Surgery is the primary treatment for rectal adenocarcinomas. In locally advanced stages of the disease, surgery is supported by radiation or combined-modality therapy (chemotherapy and radiation) to reduce the risk of local recurrence. Chemoradiotherapy can be administered before surgery or after tumor resection; however, the timing is still a matter of controversy.1–3 Preoperative regimens might be particularly attractive for the following reasons: (1) a priori not curatively resectable tumors can possibly be downsized to achieve the undisputed benefit of tumor cell–free surgical margins (R0 resection); (2) preoperative treatment has the potential to reduce tumor burden and, therefore, might increase the possibility for sphincter preservation; and (3) postoperative clinical complications preclude subsequent adjuvant chemoradiotherapy.
However, the response of individual tumors to adjuvant therapies, either pre- or postoperatively, is not uniform. This poses a considerable clinical dilemma because patients with a priori resistant tumors could be spared exposure to radiation or DNA-damaging drugs, treatments that are associated with substantial adverse effects, and surgery could be scheduled without delay. Alternatively, different adjuvant treatment modalities, including additional chemotherapeutics, could be pursued. Therefore, it would be of significant clinical relevance to identify predictive markers of cancer response to chemotherapy or combined-modality therapy. Accordingly, numerous groups have used targeted approaches to correlate expression levels of candidate genes in response to different chemotherapeutic drugs, radiation, and combinations of chemotherapy and radiation (recently reviewed by Pasche et al4 and Adlard et al5). For instance, thymidylate synthase (TS) and other fluorouracil (FU)-associated enzymes, such as thymidylate phosphorylase and dihydropyrimidine dehydrogenase, have been analyzed with respect to local recurrence and development of metastases of colorectal carcinomas after postoperative FU chemotherapy. High levels of TS are associated with decreased disease-free survival and poorer overall outcome in colorectal carcinomas.6–10
In contrast to colon carcinomas for which adjuvant treatment includes exclusively chemotherapy, preoperative treatment of locally advanced rectal carcinomas can be based on either radiation alone or combination therapy (chemotherapy and radiation). Therefore, measuring expression levels of TS may not be sufficient for response prediction in rectal carcinomas treated with combined-modality therapy. This prompted the exploration of additional or alternative markers, such as p53, p27, p21, bcl2, Ki-67, PCNA, MSH2, and surviving for response prediction.11–26 However, the predictive value of at least some of these markers remains controversial.11–13,22
The value of gene expression profiling based on microarray technologies for the prediction of drug response was tested in several model systems, including the NCI-60 cancer cell line panel,27,28 in tumor xenografts,29 in 30 established colorectal cancer cell lines,30 in primary tumors,31 and during treatment.32 Gene expression profiling also showed value in prediction of recurrence in Dukes’ B colon carcinomas.33 The results of these studies provide evidence that, at least for some tumors and a subset of drugs, pretherapeutic gene expression profiles might predict treatment response. This prompted us to explore whether gene expression profiles of primary rectal carcinomas could offer insight into specific transcriptional patterns that determine response to preoperative chemoradiotherapy. To address this question, we ascertained, under strictly standardized conditions, diagnostic biopsies from 30 patients with locally advanced rectal carcinomas (determined by rectal ultrasound as uT3 and uT4) who are participants of a prospective randomized phase III trial (CAO/ARO/AIO-94, German Rectal Cancer Trial).34 Global gene expression profiles were evaluated using microarrays. Class-comparison statistics were used to correlate the expression results with tumor downsizing after preoperative chemoradiotherapy and with morphologic tumor regression according to a grading system35,36 that was used in the German Rectal Cancer Trial.37 The robustness of the analysis was rigorously assessed using an established statistical method (ie, leave-one-out cross-validation [LOOCV]) and validated on an independent, oligonucleotide-based microarray platform.
PATIENTS AND METHODS
Patients, Samples, and Treatment
All patients are participants in a multicenter, randomized prospective phase III clinical trial (CAO/ARO/AIO-94, German Rectal Cancer Trial) aimed at determining the relative benefits of preoperative versus postoperative chemoradiotherapy.34 Preoperative chemoradiotherapy, the histologic diagnosis, and surgical resection of carcinomas were standardized as part of the clinical trial. For the study here, we prospectively collected biopsies from 30 patients assigned to the preoperative treatment arm adhering to the guidelines set by the local ethical review board. Pretherapeutic staging was performed, including complete medical history and physical evaluation, digital rectal examination, endorectal ultrasound, rigid rectoscopy with two tumor biopsies, colonoscopy, abdominal ultrasound, abdominal and pelvic computed tomography, and chest x-ray. Endoscopic ultrasound was performed by two experienced surgeons (B.M.G. and C.L.), and staging was based on the degree of tumor infiltration through the rectal wall (T level) according to standard criteria.38–40 In previous studies, we showed that T level assessment as performed by pretherapeutic rectal ultrasound (uT) correlates well with the histomorphologic diagnosis of resected tumor specimens.38 Only patients with uT level 3 (n=29) and uT level 4 (n=1) carcinomas located within 16 cm from the anocutaneous verge were included. Two pretherapeutic biopsies were taken from representative adjacent areas of the tumors, one of which was examined by a pathologist (L.F.). The second biopsy was used for RNA extraction.
All 30 patients subsequently received a total dose of 50.4 Gy of radiation (single dose of 1.8 Gy, delivered in 28 fractions using a three- or four-field box technique with individually shaped portals) accompanied by FU (1,000 mg/m2/d on days 1 through 5 and days 28 through 33) as a 120-hour continuous intravenous application.34
Standardized surgery was performed, including total mesorectal excision,41 after an interval of approximately 6 weeks after chemoradiotherapy. The histologic work-up of surgical specimens was performed according to International Union Against Cancer (UICC) standards.42 The experimental design is summarized in Figure 1, and the clinical data are listed in Table 1. Additionally, three matched pairs of preoperative biopsies and resected tumor specimens from patients of the adjuvant treatment arm were analyzed to establish the degree of similarity between the biopsy and resected specimen.
Fig 1.
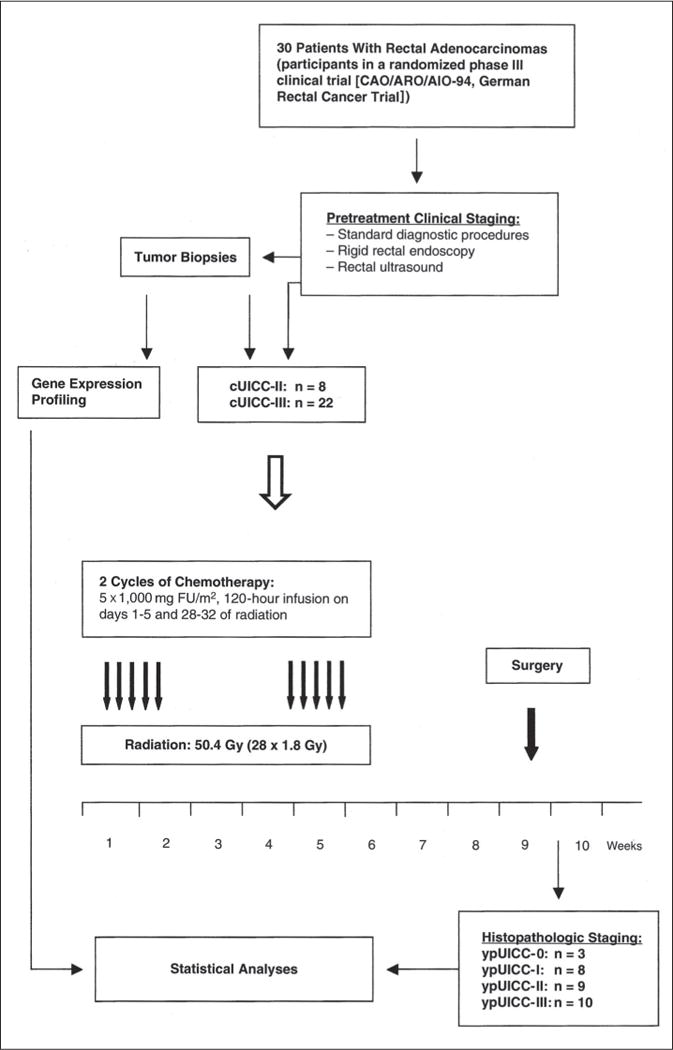
Pictorial presentation of specimen accrual, clinical diagnosis, and experimental design. cUICC refers to pretherapeutic clinical staging of tumors. ypUICC refers to histopathologic assessment of the resected specimens after completion of preoperative therapy. UICC, International Union Against Cancer; FU, fluorouracil.
Table 1.
Clinical Data of 30 Patients
| Tumor Samples |
uT | ypT | ypN | ypN Total |
ypN Infiltrated |
ypGrading | R | Regression Grading |
cUICC | ypUICC |
|---|---|---|---|---|---|---|---|---|---|---|
| 1 | 3 | 0 | 0 | 18 | 0 | x | 0 | 4 | II | 0 |
| 2 | 3 | 0 | 0 | 27 | 0 | x | 0 | 4 | III | 0 |
| 3 | 3 | 0 | 0 | 16 | 0 | x | 0 | 4 | II | 0 |
| 4 | 3 | 2 | 0 | 22 | 0 | 2 | 0 | 3 | III | I |
| 5 | 3 | 1 | 0 | 20 | 0 | 2 | 0 | 3 | II | I |
| 6 | 3 | 2 | 0 | 24 | 0 | 2 | 0 | 3 | III | I |
| 7 | 3 | 1 | 0 | 18 | 0 | 2 | 0 | 3 | II | II |
| 8 | 4 | 3c | 1 | 19 | 3 | 3 | 0 | 3 | III | III |
| 9 | 3 | 2 | 0 | 16 | 0 | 3 | 0 | 2 | II | I |
| 10 | 3 | 3b | 1 | 30 | 1 | 2 | 0 | 3 | III | III |
| 11 | 3 | 3b | 0 | 15 | 0 | 2 | 0 | 3 | III | II |
| 12 | 3 | 3b | 0 | 8 | 1 | 3 | 0 | 3 | II | III |
| 13 | 3 | 3b | 1 | 27 | 1 | 2 | 0 | 3 | III | III |
| 14 | 3 | 4a | 1 | 19 | 1 | 2 | 0 | 2 | III | III |
| 15 | 3 | 3b | 0 | 28 | 0 | 2 | 0 | 2 | III | II |
| 16 | 3 | 3a | 0 | 21 | 0 | 2 | 0 | 2 | III | II |
| 17 | 3 | 3b | 1 | 19 | 2 | 3 | 0 | 2 | III | III |
| 18 | 3 | 4a | 1 | 21 | 2 | 2 | 0 | 3 | III | III |
| 19 | 3 | 3c | 0 | 24 | 0 | 3 | 0 | 1 | III | II |
| 20 | 3 | 3c | 0 | 16 | 0 | 2 | 0 | 1 | II | II |
| 21 | 3 | 3c | 0 | 17 | 0 | 2 | 0 | 1 | III | II |
| 22 | 3 | 3a | 0 | 14 | 0 | 2 | 0 | 1 | III | II |
| 23 | 3 | 4a | 1 | 22 | 1 | 2 | 0 | 1 | III | III |
| 24 | 3 | 2 | 0 | 16 | 0 | 2 | 0 | 3 | II | I |
| 25 | 3 | 2 | 0 | 17 | 0 | 2 | 0 | 2 | III | I |
| 26 | 3 | 3 | 0 | 20 | 0 | 2 | 0 | 2 | III | II |
| 27 | 3 | 2 | 2 | 14 | 5 | 2 | 0 | 3 | III | III |
| 28 | 3 | Tis | 1 | 17 | 1 | 3 | 0 | 3 | III | III |
| 29 | 3 | 3 | 0 | 15 | 0 | 2 | 0 | 2 | III | II |
| 30 | 3 | 2 | 0 | 12 | 0 | 2 | 0 | 2 | III | I |
NOTE. Tumor samples 1 to 23 comprised the initial group analyzed by cDNA microarray, whereas patients 24 to 30 were used to test cross-platform robustness.
Abbreviations: uT, T level determined by rectal ultrasound before any treatment; ypT, T level by histopathologic assessment after preoperative treatment; (yp), ypN, lymph node status by histopathologic assessment; ypN total, complete number of analyzed lymph nodes; ypN infiltrated, number of affected lymph nodes; ypGrading, tumor grading by histopathologic assessment; R, resectability (0 refers to histologically tumor cell–free surgical margins); cUICC, clinical International Union Against Cancer stage; ypUICC, post-treatment International Union Against Cancer stage; Tis, tumor in situ.
Response Classification
Response classification of primary tumors to preoperative therapy is problematic. This is reflected by the fact that several classifications exist, two of which we have used here. First, response was evaluated as downsizing of the primary rectal cancer by comparing the uT category (determined by rectal ultrasound) with the histopathology after completion of preoperative chemoradiotherapy. This response classification is referred to as T level downsizing and was defined as the reduction of tumor infiltration by at least one T level. We thought that using an established response classification system was an acceptable intermediate end point. Once 5-year survival rates become available, we will establish correlations between the results presented here and survival. Furthermore, T level downsizing is an important clinical parameter with direct impact on patient management and prognosis with respect to sphincter preservation and R0 resections rates.
Second, histopathologic tumor regression was based on a semiquantitative classification system as proposed earlier.35,36 As previously reported,22 tumors were considered responsive when assigned to the regression grades 3 and 4 because these grades are defined by the almost complete (grade 3) or complete (grade 4) absence of remaining tumor cells. All other grades were classified as nonresponsive. The clinical data and tumor response classifications are listed in Table 1.
RNA Isolation and Expression Profiling
After rectal ultrasound, tumor biopsies were ascertained and stored immediately in RNAlater (Ambion, Austin, TX). Tumor material was in the range of 5 mg to 80 mg. RNA extraction was performed using TRIZOL (Invitrogen, Carlsbad, CA) following standard procedures. High-quality RNA could be successfully extracted from all samples. To generate enough RNA for repeat hybridizations, mRNA was amplified using the RiboAmp RNA amplification kit (Arcturus, Mountain View, CA) for the cDNA arrays and the Amino Allyl MessageAmp aRNA Kit (Ambion) for the oligonucleotide arrays, which resulted in antisense mRNA amounts that averaged 50 μg. RNA was labeled indirectly incorporating 5-(3-Aminoallyl)-2′-deoxy-uridine-5′-triphosphate, followed by chemical coupling of Cy3 (Amersham, Piscataway, NJ). Control cRNA was generated by amplification of a reference mRNA pool (Stratagene, La Jolla, CA) and labeled using Cy5 (Amersham). RNA quantification and labeling efficiency was determined using the Nanodrop quantification device (Nanodrop, Rockland, DE).
Expression profiling was carried out on the National Cancer Institute cDNA (9,984 features) and oligonucleotide (22,231 features) arrays as follows: 5.0 μg of Cy3-labeled test cDNA/cRNA and 5.0 μg of Cy5-labeled control cDNA/cRNA were hybridized at 42°C overnight in specifically designed hybridization cassettes (TeleChem International, Sunnyvale, CA). After hybridization, slides were washed and scanned on an Axon scanner using GenePixPro (3.0) software (Axon Instruments, Union City, CA). Spot quality was assessed according to criteria in GenePixPro (3.0) software. Background subtraction and normalization was performed on extraction of the data from the Center for Information Technology/National Institutes of Health microarray database, mAdb (http://nciarray.nci.nih.gov/). Spots with a size of less than 10 μm or an intensity less than 100 in both the red and green channels were eliminated, as were genes with more than 50% of missing data. This a priori filtering to remove genes with unreliable signals resulted in a final tally of 9,059 genes on the cDNA arrays and 12,291 genes on the oligonucleotide arrays. An initial set of 23 tumors was hybridized to cDNA arrays. To establish the reproducibility on different platforms, 10 of these 23 samples and an additional set of seven tumors were hybridized to oligonucleotide arrays.
Statistical Analysis
The statistical analyses were performed using the BRB Array-Tools package for microarray analysis developed at the Biometric Research Branch of the National Cancer Institute (Bethesda, MD)43 and MATLAB from The Mathworks (Natick, MA). The two technical replicate expression profiles of the same tumor specimen were highly consistent (correlation coefficient > 0.95) and were averaged for analysis. A class-comparison analysis was applied to determine which genes were differentially expressed between the two classes. For this, we used a two-sample t test with a randomized variance model.44 The randomized variance model assumes that the variance of the expression of each gene is randomly drawn from an inverse-gamma distribution and enables sharing of variance information among genes without assuming that all genes have the same variance. We used a stringent statistical significance threshold of P<.001 for the identification of genes differentially expressed between responders and nonresponders. This controls for the number of genes tested. Tests were performed for 9,059 genes, which passed the filtering criteria, and the expected number of false-positive genes was thus nine. Because 54 genes were found to be significant at P<.001 for T level downsizing, the false discovery rate was 16.67%.
We applied diagonal linear discriminant analysis45 to predict response. The genes that are differentially expressed at a P<.001 level were used as predictive features in the classifiers. Complete LOOCV was used to estimate the prediction accuracy for each classification method. With LOOCV, one sample is left out, and the remaining samples are used to build a classifier, which is then used to classify the left-out sample. Both feature selection and classifier design was repeated each time a different sample was left out, thus this analysis was repeated 23 times. The fraction of samples that are classified correctly is an estimate of the classification accuracy. LOOCV is a more efficient method of estimating prediction error than the split-sample approach of dividing the data once into a training set and a validation set. LOOCV provides unbiased estimates of prediction error that are as valid as those for the split-sample approach as long as the entire model building process is repeated for each leave-one-out training set.46,47
The significance of the classification results is calculated by permuting the class labels of the samples and then finding the fraction of times this relabeling resulted in higher LOOCV classification accuracy. We permuted 10,000 times, which resulted in P = .021. The method takes into account the sample size and is suitable for small sample numbers.48
Ten samples out of the 23 hybridized on cDNA were also hybridized to oligonucleotide arrays. This set of 10 was used to calculate a normalization to make the oligonucleotide data comparable to the cDNA data. We found that there is a consistent gene-specific bias between the oligonucleotide and cDNA measurements of gene expression (ie, for any particular gene, there is a difference in the log-expression ratios measured using cDNA and oligonucleotide that is consistent across samples, but depends on the specific gene). If O(g,s) denotes the gene expression measured using oligonucleotide arrays for gene g (there are 6,939 common genes between the cDNA and oligonucleotide arrays) and sample s, and C(g,s) denotes the corresponding measurement using cDNA arrays, then:
where B(g) is the gene-specific bias for gene g, and η is random noise with zero mean. This implies that the change in platform from cDNA array to oligonucleotide array introduces an additive gene-specific effect in the measured log ratios. We obtained an estimate of B(g) for each gene as follows:
where and are the means of C(g,s) and O(g,s) over the 10 samples hybridized to both platforms.
A set of seven independent tumors was hybridized to oligonucleotide arrays only. The estimate for the bias was added to the oligonucleotide data to make it possible to use the classifier developed on cDNA data to be used to classify the oligonucleotide data.
The list of genes with significantly different expression (P<.001) established in the cDNA array set of 23 patients and the diagonal linear discriminant classifier based on these samples were then used to predict treatment response for the seven patients in the oligonucleotide set. The summary of the data analysis scheme is presented in Figure 2.
Fig 2.
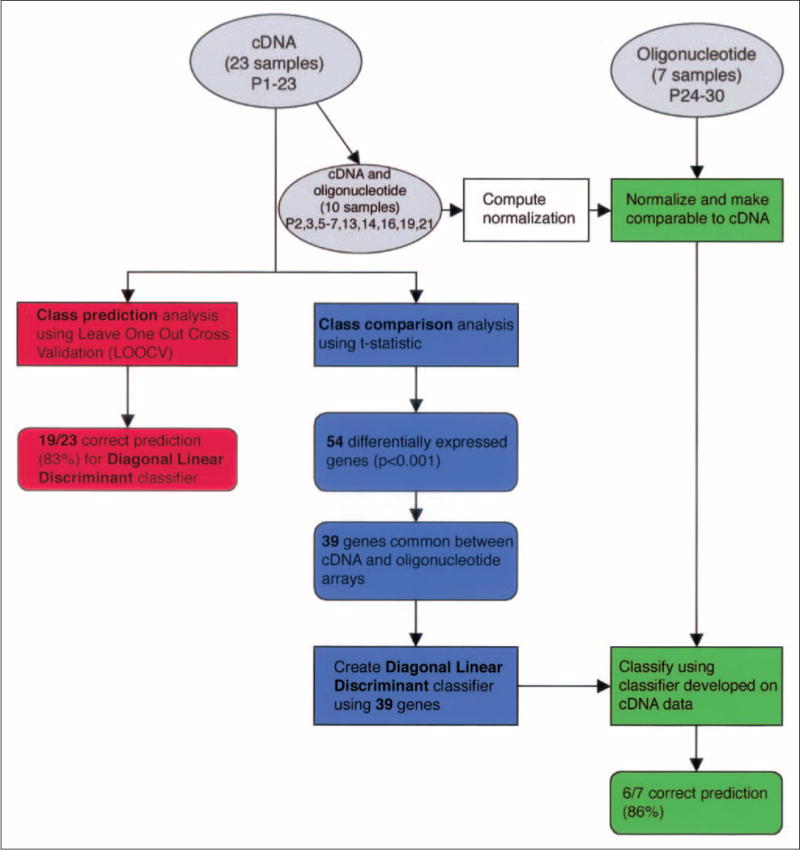
Flow of statistical analyses for cDNA and oligonucleotide data. Gray ovals represent data, rectangles represent statistical procedures, and round-edged boxes indicate results. The figure shows the three main statistical analyses performed. Class prediction (red) and class comparison (blue) for cDNA data and cross-platform normalization for the classification of oligonucleotide data (green) is shown.
RESULTS
Response Classification of Rectal Adenocarcinomas to Preoperative Chemoradiotherapy
To identify molecular signatures of responsiveness to preoperative chemoradiotherapy, we analyzed gene expression profiles from 30 rectal adenocarcinoma biopsies from participants of a randomized clinical trial (CAO/ARO/AIO-94, German Rectal Cancer Trial). The flow of sample collection, clinical diagnosis, and experimental design is depicted in Figure 1. Before biopsy sampling, initial tumor staging was performed by rectal ultrasound. The majority of patients were diagnosed with cUICC III (n = 22) carcinomas, whereas the remaining eight patients were diagnosed with cUICC II carcinomas. In all instances, duplet biopsies were ascertained and submitted to either histopathologic evaluation or expression profiling. Preoperative chemoradiotherapy, the histologic diagnosis, and surgical resection of carcinomas were standardized as part of the clinical trial. Histopathologic evaluation of the tumor biopsies revealed that all of the rectal cancers included in our analysis were adenocarcinomas. The clinical data and response classifications are listed in Table 1. Response classification was based on T level downsizing and histopathologic regression grading.36,49 With respect to T level downsizing, only patients who showed at least one T level reduction were considered responsive (patients 1 to 9 from the cDNA array set and patients 24, 25, 27, 28, and 30 from the oligonucleotide array set). Thus, 14 of the prospectively collected samples were from patients who were later classified as responders, and 16 patients showed no T level response. Regarding the regression grading, patients with grades 3 and 4 were considered responders (patients 1 to 8 and 10 to 13 from the cDNA microarray set and patients 24, 27, and 28 from the oligonucleotide array set), which left us with an equal number of responders and nonresponders.
Gene expression profiling: class comparison
Gene expression profiles of the first 23 tumor biopsies were established using cDNA arrays (9,984 features). For each biopsy, technical repeat hybridizations were performed, and the coefficient of correlation was determined to be more than 95%. This excellent correlation allowed us to average the replicates for each patient before evaluation. Using class-comparison analysis, we identified a list of 54 genes that were differentially expressed at significance levels (P < .001) between responsive and nonresponsive tumors based on T level down-sizing (Table 2). In the group of responders, 41 genes showed lower expression relative to the group of nonresponders. The list of genes includes calmin, kinectin 1, copine III, villin-like, motilin, cdc42 (binding protein A), myosin IA, cyclin T1, interleukin 12A, SMC1, platelet derived growth factor C, and a number of genes that encode proteins involved in signaling and membrane transport and proteins with varying enzymatic properties (thiolase, lipase, peptidase and protease activity). The results of a hierarchical cluster analysis of the 54 genes are presented pictorially in Figure 3, along with the gene annotation and fold change between the groups. To corroborate the significance of finding these genes in our analysis, we have also determined that the likelihood that 54 genes would be significantly (P < .001) changed by chance to be exceedingly low (P = .008).
Table 2.
List of 54 Most Significantly Changed (P < .001) Genes in the T Level Downsizing Class-Comparison Analysis of 23 Patients
| Rank | Parametric P | Geometric Mean of Ratios in Responders | Geometric Mean of Ratios in Nonresponders | Fold Difference of Geometric Means | Description | Clone | UG Cluster | Gene Symbol | Map |
|---|---|---|---|---|---|---|---|---|---|
| 1 | 4.40E-06 | 0.255 | 0.727 | 0.351 | Calmin (calponin-like, transmembrane) | IncytePD:1 464613 | Hs.406099 | CLMN | 14q32.2 |
| 2 | 4.15E-05 | 1.37 | 3.752 | 0.365 | FK506 binding protein 1B, 12.6 kDa | IncytePD:1 288118 | Hs.77643 | FKBP1B | 2p24.1 |
| 3 | 4.88E-05 | 0.6 | 1.224 | 0.49 | Kinectin 1 (kinesin receptor) | IncytePD:3 736760 | KTN1 | ||
| 4 | 5.54E-05 | 0.853 | 1.911 | 0.446 | Copine III | IncytePD:3 444952 | Hs.14158 | CPNE3 | 8q21.13 |
| 5 | 6.55E-05 | 9.965 | 4.943 | 2.016 | LIV-1 protein, estrogen regulated | IncytePD:1 402273 | Hs.79136 | LIV-1 | 18q12.1 |
| 6 | .0001277 | 0.264 | 0.832 | 0.317 | Glutamic-pyruvate transaminase (alanine aminotransferase) | IncytePD:1 630709 | Hs.103502 | GPT | 8q24.3 |
| 7 | .0001571 | 0.219 | 0.531 | 0.412 | Incyte EST | IncytePD:1 607471 | |||
| 8 | .0001722 | 0.657 | 1.193 | 0.551 | Filamin B, beta (actin binding protein 278) | IncytePD:1 871362 | Hs.81008 | FLNB | 3p14.3 |
| 9 | .0001874 | 0.182 | 0.467 | 0.39 | Villin-like | IncytePD:2 804190 | Hs.103665 | VILL | 3p21.3 |
| 10 | .0001972 | 1.654 | 1.007 | 1.643 | Membrane-bound transcription factor protease, site 2 | IncytePD:1 302425 | Hs.350970 | MBTPS2 | Xp22.1-p22.2 |
| 11 | .000202 | 0.467 | 1.256 | 0.372 | Homeobox D9 | IncytePD:2 956581 | Hs.236646 | HOXD9 | 2q31.1 |
| 12 | .0002228 | 0.792 | 1.565 | 0.506 | CDC42 binding protein kinase alpha (DMPK-like) Homosapiens cDNA | IncytePD:1 602261 | Hs.18586 | CDC42BPA | 1q42.11 |
| 13 | .000286 | 0.389 | 0.698 | 0.557 | FLJ30016 fis, clone 3NB692000429 | IncytePD:1 570161 | Hs.14931 | 10 | |
| 14 | .0002972 | 0.413 | 0.847 | 0.488 | Monoglyceride lipase | IncytePD:2 174920 | Hs.6721 | MGLL | 3q21.3 |
| 15 | .0003119 | 1.357 | 0.847 | 1.602 | ESTs, glutamate-cysteine ligase, modifer subunit acetyl-coenzyme A | IncytePD:1 432207 | Hs.315562 | GCLM | 1 |
| 16 | .0003197 | 0.504 | 0.805 | 0.626 | Acyltransferase 1 (peroxisomal 3- oxoacyl-coenzyme A thiolase) | IncytePD:1 926543 | Hs.166160 | ACAA1 | 3p23-p22 |
| 17 | .0003223 | 0.443 | 0.749 | 0.591 | Regulator of G-protein signalling 19 Interacting protein 1 | IncytePD:1 626914 | Hs.6454 | RGS19IP1 | 19p13.1 |
| 18 | .0003379 | 0.58 | 1.043 | 0.556 | p21/Cdc42/Rac1-activated kinase 1 (STE20 homolog, yeast) | IncytePD:2 632434 | Hs.64056 | PAK1 | 11q13-q14 |
| 19 | .0003527 | 0.527 | 0.829 | 0.636 | Motilin | IncytePD:2 37225 | Hs.2813 | MLN | 6p21.3 |
| 20 | .0003884 | 0.594 | 1.112 | 0.534 | Inositol 1,3,4- triphosphate 5/6 kinase | IncytePD:1 967095 | Hs.6453 | ITPK1 | 14q31 |
| 21 | .0003889 | 1.728 | 0.813 | 2.125 | ESTs | IncytePD:4 106720 | Hs.12876 | 6 | |
| 22 | .0004007 | 1.89 | 1.034 | 1.828 | Hypothetical protein DKFZp762O076 | IncytePD:1 967206 | Hs.21621 | DKFZp762 O076 | 8q21.3 |
| 23 | .0004026 | 0.067 | 0.155 | 0.432 | Myosin IA | IncytePD:1 502005 | Hs.5394 | MYO1A | 12q13-q15 |
| 24 | .0004298 | 0.915 | 1.876 | 0.488 | S164 protein | IncytePD:2 047730 | Hs.180789 | S164 | 14q24.3 |
| 25 | .0004488 | 0.968 | 1.813 | 0.534 | Protein phosphatase 1, regulatory subunit 10 | IncytePD:2 314555 | Hs.106019 | PPP1R10 | 6p21.3 |
| 26 | .0004611 | 1.282 | 2.452 | 0.523 | KIAA0138 gene product | IncytePD:1 731569 | Hs.159384 | KIAA0138 | 19p13.3 |
| 27 | .0004701 | 0.396 | 0.149 | 2.658 | Guanylate cyclase 1, soluble, beta 3 | IncytePD:1 417408 | Hs.77890 | GUCY1B3 | 4q31.3-q33 |
| 28 | .0004709 | 0.242 | 0.773 | 0.313 | Mucin 5, subtype B, tracheobronchial | IncytePD:1 737280 | Hs.102482 | MUC5B | 11p15 |
| 29 | .0004967 | 0.383 | 0.713 | 0.537 | E74-like factor 1 (ets domain transcription factor) | IncytePD:1 312824 | Hs.154365 | ELF1 | 13q13 |
| 30 | .0005427 | 0.532 | 0.826 | 0.644 | Metal-regulatory transcription factor 1 | IncytePD:2 467743 | Hs.211581 | MTF1 | 1p33 |
| 31 | .0005701 | 0.045 | 0.235 | 0.191 | Small nuclear protein PRAC | IncytePD:2 231168 | Hs.116467 | PRAC | 17q21 |
| 32 | .0005733 | 0.619 | 1.161 | 0.533 | Cyclin T1 | IncytePD:2 928577 | Hs.279906 | CCNT1 | 12pter-qter |
| 33 | .0005792 | 0.936 | 1.38 | 0.678 | Hypothetical protein FLJ12949 | IncytePD:1 393595 | Hs.184519 | FLJ12949 | 19p13.2 |
| 34 | .0005934 | 0.489 | 0.913 | 0.536 | ESTs, moderately similar to TRY2_HUMAN trypsin II precursor (anionic trypsinogen) [H.sapiens] | IncytePD:1 222442 | Hs.66915 | 22 | |
| 35 | .0006109 | 1.144 | 2.176 | 0.526 | Homosapiens, clone IMAGE:4797596, mRNA | IncytePD:4 75497 | Hs.355279 | 7 | |
| 36 | .0006261 | 1.029 | 0.625 | 1.646 | Eukaryotic translation initiation factor 5A2 | IncytePD:7 86494 | Hs.104660 | EIF5A2 | 3q26.2 |
| 37 | .0006281 | 0.969 | 0.514 | 1.885 | Interleukin 12A (natural killer cell stimulatory factor 1, cytotoxic lymphocyte maturation factor 1, p35) | IncytePD:2 760318 | Hs.673 | IL12A | 3p12-q13.2 |
| 38 | .0006662 | 0.818 | 1.501 | 0.545 | ESTs | IncytePD:1 398814 | Hs.355960 | 12 | |
| 39 | .0006832 | 1.043 | 0.651 | 1.602 | Hypothetical protein MGC26706 | IncytePD:2 706048 | Hs.65406 | MGC26706 | Xp22.31 |
| 40 | .0006906 | 2.603 | 1.544 | 1.686 | Incyte EST | IncytePD:2 922438 | |||
| 41 | .0007004 | 2.038 | 5.535 | 0.368 | Homosapiens, clone IMAGE:5587702, mRNA | IncytePD:1 964852 | Hs.427683 | 10 | |
| 42 | .0007029 | 0.899 | 1.473 | 0.61 | WAS protein family, member 2 | IncytePD:1 448116 | Hs.288908 | WASF2 | 1p36.11-p34.3 |
| 43 | .0007109 | 0.986 | 2.189 | 0.45 | Adaptor-related protein complex 3, delta 1 subunit | IncytePD:1 301192 | Hs.75056 | AP3D1 | 19p13.3 |
| 44 | .0007183 | 0.101 | 0.237 | 0.426 | Protein expressed in thyroid | IncytePD:1 807085 | Hs.7486 | YF13H12 | 19q13.2 |
| 45 | .0007203 | 0.315 | 1.319 | 0.239 | Sodium channel, nonvoltage-gated 1, beta (Liddle syndrome) | IncytePD:2 121687 | Hs.37129 | SCNN1B | 16p12.2-p12.1 |
| 46 | .0007569 | 0.416 | 0.817 | 0.509 | KIAA0284 protein | IncytePD:1 890138 | Hs.182536 | KIAA0284 | 14q32.33 |
| 47 | .0007649 | 1.183 | 0.636 | 1.86 | Solute carrier family 1 (glial high-affinity glutamate transporter), member 3 | IncytePD:3 074077 | Hs.75379 | SLC1A3 | 5p13 |
| 48 | .0008029 | 0.241 | 0.44 | 0.548 | Deltex homolog 2 (Drosophila) | IncytePD:1 691161 | Hs.89135 | DTX2 | 7q11.23 |
| 49 | .000803 | 1.236 | 2.234 | 0.553 | Myeloid/lymphoid or mixed-lineage leukemia (trithorax homolog, Drosophila) | IncytePD:1 692195 | Hs.199160 | MLL | 11q23 |
| 50 | .0008186 | 0.29 | 0.568 | 0.511 | Chromosome 11 open reading frame 13 | IncytePD:1 919646 | Hs.72925 | C11orf13 | 11p15.5 |
| 51 | .000825 | 1.683 | 2.548 | 0.661 | Small nuclear RNA activating complex, polypeptide 2, 45 kd SMC1 structural | IncytePD:1 445203 | Hs.78403 | SNAPC2 | 19p13.3-p13.2 |
| 52 | .0008488 | 1.114 | 1.673 | 0.666 | Maintenance of chromosomes 1-like 1 (yeast) | IncytePD:3 074894 | Hs.211602 | SMC1L1 | Xp11.22-p11.21 |
| 53 | .0009141 | 1.708 | 1.116 | 1.53 | Serine/threonine kinase 18 | IncytePD:2 732630 | Hs.172052 | STK18 | 4q27-q28 |
| 54 | .0009645 | 1.771 | 1.06 | 1.671 | Platelet-derived growth factor C | IncytePD:9 43826 | Hs.43080 | PDGFC | 4q32 |
Abbreviation: UG, unigene.
Fig 3.
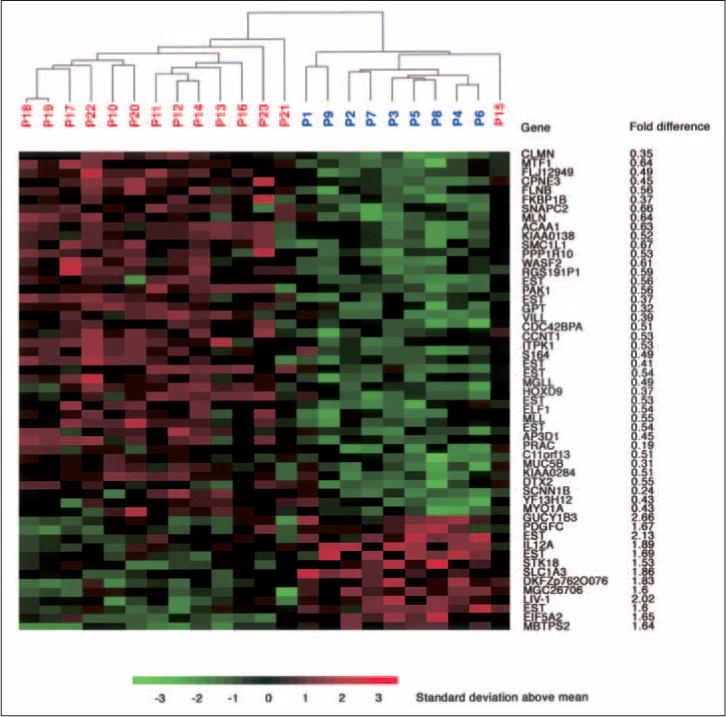
Hierarchical cluster analysis of 23 patients based on the 54 most significantly changed genes (P < .001) when using T level downsizing. Red indicates increased expression, and green indicates decreased expression. Gene symbols and fold change between the groups are listed to the right. Values less than 1 reflect downregulation in the class of responders, whereas values more than 1 reflect upregulation. P, patient.
Using the regression grading classification, only four genes (REGL, ACVR2B, SMARCC1, and ZNF134) and one expressed sequence tag (EST) were differentially expressed (P < .001) between responders and nonresponders. Because the probability of five genes being differentially expressed by chance is high (P=.31), we concluded that there was no evidence for differential expression between the histopathologic response and nonresponse samples.
Gene expression profiling: class prediction
We then wished to evaluate the usefulness of gene expression profiling for response prediction. This was achieved by using an established LOOCV strategy. Classification results for T level downsizing were derived using a diagonal linear discriminant45 analysis. Four patients were incorrectly classified; two belonged to the nonresponse group but were classified as responders (patients 15 and 21), and two belonged to the response group but were classified as nonresponders (patients 1 and 2). Therefore, the estimate of the class prediction accuracy using LOOCV results in 83% correct assignment as to either responders or nonresponders (P=.02). This P value, which indicates a low probability of obtaining this classification result by chance, was calculated using a permutation method that takes the sample size into account (see Patients and Methods). Table 3 shows the correlation between class prediction and T level downsizing. The sensitivity of the test (percentage of responders who were predicted correctly as responders) was 78%. The specificity (ie, patients who were correctly classified as nonresponders to preoperative chemoradiotherapy) was 86%. The positive predictive value (percentage of patients classified as responders who were true responders) was 78%, and the negative predictive value (percentage of patients classified as nonresponders who were true nonresponders) was 86%. Because only five genes were differentially expressed when using the histopathologic regression grading classification, no further LOOCV was attempted.
Table 3.
Prediction Accuracy Using Microarrays
| Array and Patient No. | Response Class Label | No. of Genes in Classifier | Diagonal Linear Discriminant Correct? |
|---|---|---|---|
| cDNA* | |||
| 1 | R | 89 | No |
| 2 | R | 48 | No |
| 3 | R | 41 | Yes |
| 4 | R | 45 | Yes |
| 5 | R | 36 | Yes |
| 6 | R | 39 | Yes |
| 7 | R | 40 | Yes |
| 8 | R | 47 | Yes |
| 9 | R | 43 | Yes |
| 10 | NR | 41 | Yes |
| 11 | NR | 39 | Yes |
| 12 | NR | 35 | Yes |
| 13 | NR | 53 | Yes |
| 14 | NR | 38 | Yes |
| 15 | NR | 66 | No |
| 16 | NR | 54 | Yes |
| 17 | NR | 47 | Yes |
| 18 | NR | 40 | Yes |
| 19 | NR | 44 | Yes |
| 20 | NR | 43 | Yes |
| 21 | NR | 84 | No |
| 22 | NR | 46 | Yes |
| 23 | NR | 56 | Yes |
|
| |||
| Oligonucleotide† | |||
| 24 | R | 39 | Yes |
| 25 | R | 39 | Yes |
| 26 | NR | 39 | Yes |
| 27 | R | 39 | Yes |
| 28 | R | 39 | No |
| 29 | NR | 39 | Yes |
| 30 | R | 39 | Yes |
Abbreviations: R, responders; NR, nonresponders.
Percentage correctly classified: 83%.
Percentage correctly classified: 86%.
We then wanted to explore whether gene expression profiling for response prediction was independent of the microarray platform used. Therefore, we hybridized a newly obtained set of seven tumors to oligonucleotide arrays. Thirty-nine of the 54 genes identified as statistically significant using the cDNA arrays had corresponding features on the oligonucleotide arrays. Thus, our diagonal linear discriminant classifier was trained using the expression of these 39 genes from the 23 tumors hybridized to cDNA arrays. This cDNA classifier was able to correctly predict the response of six out of seven patients (86%; Table 3) and, thus, attests to the robustness of microarray profiling and to the biologic relevance of the genes identified here. The flow of the different statistical tools used for class comparison, class prediction, and cross-platform assessment is summarized in Figure 2.
DISCUSSION
A recently published report on the results of a randomized phase III clinical trial (CAO/ARO/AIO-94, German Rectal Cancer Trial) provided convincing evidence that preoperative chemoradiotherapy of rectal adenocarcinomas reduces local recurrence (6% after 5 years) when compared with postoperative (13% after 5 years) multimodality treatment.37 Given these results, neoadjuvant therapy has now been adapted as the therapy of choice by the participating clinics. However, not all tumors respond uniformly, and despite promising results, a priori resistance to chemoradiotherapy poses a thorny problem because patients with nonresponsive tumors could either be spared from possible side effects of cytotoxic treatment and radiation or be subjected to alternative treatment modalities.50,51 Therefore, developing tools for response prediction has become exceedingly important. Thus, we collected, prospectively, diagnostic biopsies from 30 patients from the German Rectal Cancer Trial with locally advanced rectal adenocarcinomas.
We acknowledge that there is a trade-off between sample size and the accrual of tumor specimens under strictly standardized diagnostic and therapeutic procedures. For the pilot study here, our patients were limited to those who were recruited to the German Rectal Cancer Trial and who were treated at only one of the participating clinical centers (because sample collection, surgery, and neoadjuvant treatment are identical, and post-therapy follow-up is significantly simplified). Our sample size is taken into account when calculating the P value for the classification accuracy. Although we have begun to test the robustness of our approach by evaluating the performance of the classifier on a different array platform, the ultimate test of the robustness and clinical applicability would require multicenter sample accrual and processing. Therefore, we have initiated such a study.
Using T level downsizing, the results of our gene expression analyses resulted in a classifier with high accuracy (83%), with only four of 23 patients incorrectly classified when using LOOCV. A similar accuracy (86%) was achieved with the independent set of seven patients, despite the difference in microarray platform; thus, utilization of gene expression profiling by microarray analysis seems robust enough to be independent of the particular platform used. Our inability to achieve higher accuracy could be due to several reasons, including tumor heterogeneity or the possibility that contamination of these particular biopsies with either normal rectal epithelium or adenomatous or stromal tissue could have partially obscured the detection of gene expression profiles more specific to rectal tumor cells. The latter does not seem likely, however, because we have established on frozen sections that the tumor cell content in the biopsies was greater than 90%. Incorrect tumor staging based on pretherapeutic rectal ultrasound could also result in incorrect classification of T level response. Finally, genes contributing to tumor response and, thus, useful for classification might not be represented on the arrays used in our study, or responsiveness of these tumors depends on post-translational modifications, which can obviously not be detected by gene expression analysis on nucleotide arrays.
The 54 genes that had expression levels that were most significantly changed (P < .001) represent members of several cellular pathways and map to multiple different chromosomes. Of particular interest are genes that encode proteins involved in DNA damage repair pathways, such as SMC1, which is involved in the S-phase checkpoint mediated by ATM.52,53 A number of genes were involved in microtubule organization. For instance, calmin has homology to calponin and dystrophin.54 Cdc42BPA is a member of the Rho GTPase subfamily and triggers microtubule reorganization and cytoskeletal remodeling through GSK-3 and APC, which are two proteins involved in Wnt signaling.55,56 Filamin B is an integrator of cell mechanics and signaling and acts in the Rho signaling apparatus,57 villin proteins are involved in actin metabolism,58 and kinectin 1 is a binding partner of kinesin and belongs to a class of molecular motors involved in mitoses, axoplasmic transport, and secretion.59 The preponderance of genes involved in microtubule organization cannot be explained by relative abundance of members of such gene families alone (http://nciarray.nci.nih.gov/).
Using the histopathologic regression grading, we only identified five genes that were differentially expressed (P<.001) between the two groups of responders and nonresponders. Because the probability of this number of genes being differentially expressed by chance was high (P = .31), we abstained from further statistical analyses. A possible explanation could be our definition of response because we defined grade 3 and 4 patients as responders according to previously published studies.22 However, it might be more reasonable to divide the groups into complete responders (regression grade 4) and nonresponders or partial responders (grades 0 to 3). This was not possible in our study because of the unequal distribution of biopsies (only three patients were assigned response grade 4).
Several key proteins involved in the repair of radiation-induced DNA damage and enzymes involved in thymidine metabolism have been analyzed in the past regarding their potential to predict tumor response in individual patients.4,5 For instance, the expression levels of TS are usually inversely correlated with response to adjuvant FU treatment. However, the potential of TS expression levels to predict response to preoperative combined-modality therapy remains less conclusive. One possible explanation could be that many more studies were conducted regarding response prediction to postoperative chemotherapy than to preoperative therapy. Second, one could surmise that radiation, rather than chemotherapy, constitutes the main treatment component of preoperative chemoradiotherapy. A number of groups established correlations of expression levels of the tumor suppressor genes p53, p21, and p27 as well as bcl2, Ki-67, MSH2, survivin, TS, and PCNA with therapy response.11–26 However, conflicting conclusions were reached as to the predictive power of any one of these genes, some of which were included on our arrays. These discrepancies can be a result of different study designs, different pretherapeutic staging classifications, nonstandardized treatments, different definitions of response, and different methodologies for determination of gene expression levels. The expression levels of these genes were not significantly different (P > .1) in groups of responders or nonresponders in our study.
In this study, we demonstrate that analysis of even a limited subset of patients from the randomized German Rectal Cancer Trial37 by gene expression profiling may contribute to the clinical stratification of responders and nonresponders. We have validated the robustness of our approach using different array platforms; however, we feel that, from a clinical perspective, our results should be confirmed with larger patient cohorts.
Acknowledgments
We thank Buddy Chen and Joseph Cheng for IT support and Carmen Allegra, MD, and Claus Rödel, MD, for critical comments. Rolf Sauer, MD, was the principal investigator of the German Rectal Cancer Trial.
Footnotes
M.G. received a stipend from the German Academic Exchange Service.
Authors’ Disclosures of Potential Conflicts of Interest
The authors indicated no potential conflicts of interest.
References
- 1.Nelson H, Sargent DJ. Refining multimodal therapy for rectal cancer. N Engl J Med. 2001;345:690–692. doi: 10.1056/NEJM200108303450910. [DOI] [PubMed] [Google Scholar]
- 2.Minsky BD. Adjuvant therapy for rectal cancer: The transatlantic view. Colorectal Dis. 2003;5:416–422. doi: 10.1046/j.1463-1318.2003.00504.x. [DOI] [PubMed] [Google Scholar]
- 3.Sauer R. Adjuvant and neoadjuvant radiotherapy and concurrent radiochemotherapy for rectal cancer. Pathol Oncol Res. 2002;8:7–17. doi: 10.1007/BF03033695. [DOI] [PubMed] [Google Scholar]
- 4.Pasche B, Mulcahy M, Benson AB., 3rd Molecular markers in prognosis of colorectal cancer and prediction of response to treatment. Best Pract Res Clin Gastroenterol. 2002;16:331–345. doi: 10.1053/bega.2002.0289. [DOI] [PubMed] [Google Scholar]
- 5.Adlard JW, Richman SD, Seymour MT, et al. Prediction of the response of colorectal cancer to systemic therapy. Lancet Oncol. 2002;3:75–82. doi: 10.1016/s1470-2045(02)00648-4. [DOI] [PubMed] [Google Scholar]
- 6.Popat S, Matakidou A, Houlston RS. Thymidylate synthase expression and prognosis in colorectal cancer: A systematic review and meta-analysis. J Clin Oncol. 2004;22:529–536. doi: 10.1200/JCO.2004.05.064. [DOI] [PubMed] [Google Scholar]
- 7.Allegra CJ, Paik S, Colangelo LH, et al. Prognostic value of thymidylate synthase, Ki-67, and p53 in patients with Dukes’ B and C colon cancer: A National Cancer Institute-National Surgical Adjuvant Breast and Bowel Project collaborative study. J Clin Oncol. 2003;21:241–250. doi: 10.1200/JCO.2003.05.044. [DOI] [PubMed] [Google Scholar]
- 8.Aschele C, Debernardis D, Casazza S, et al. Immunohistochemical quantitation of thymidylate synthase expression in colorectal cancer metastases predicts for clinical outcome to fluorouracil-based chemotherapy. J Clin Oncol. 1999;17:1760–1770. doi: 10.1200/JCO.1999.17.6.1760. [DOI] [PubMed] [Google Scholar]
- 9.Johnston PG, Lenz HJ, Leichman CG, et al. Thymidylate synthase gene and protein expression correlate and are associated with response to 5-fluorouracil in human colorectal and gastric tumors. Cancer Res. 1995;55:1407–1412. [PubMed] [Google Scholar]
- 10.Salonga D, Danenberg KD, Johnson M, et al. Colorectal tumors responding to 5-fluorouracil have low gene expression levels of dihydropyrimidine dehydrogenase, thymidylate synthase, and thymidine phosphorylase. Clin Cancer Res. 2000;6:1322–1327. [PubMed] [Google Scholar]
- 11.Okonkwo A, Musunuri S, Talamonti M, et al. Molecular markers and prediction of response to chemoradiation in rectal cancer. Oncol Rep. 2001;8:497–500. [PubMed] [Google Scholar]
- 12.Saw RP, Morgan M, Koorey D, et al. p53, deleted in colorectal cancer gene, and thymidylate synthase as predictors of histopathologic response and survival in low, locally advanced rectal cancer treated with preoperative adjuvant therapy. Dis Colon Rectum. 2003;46:192–202. doi: 10.1007/s10350-004-6524-2. [DOI] [PubMed] [Google Scholar]
- 13.Spitz FR, Giacco GG, Hess K, et al. p53 immunohistochemical staining predicts residual disease after chemoradiation in patients with high-risk rectal cancer. Clin Cancer Res. 1997;3:1685–1690. [PubMed] [Google Scholar]
- 14.Rodel F, Hoffmann J, Grabenbauer GG, et al. High survivin expression is associated with reduced apoptosis in rectal cancer and may predict disease-free survival after preoperative radiochemotherapy and surgical resection. Strahlenther Onkol. 2002;178:426–435. doi: 10.1007/s00066-002-1003-y. [DOI] [PubMed] [Google Scholar]
- 15.Luna-Perez P, Arriola EL, Cuadra Y, et al. p53 protein overexpression and response to induction chemoradiation therapy in patients with locally advanced rectal adenocarcinoma. Ann Surg Oncol. 1998;5:203–208. doi: 10.1007/BF02303772. [DOI] [PubMed] [Google Scholar]
- 16.Elsaleh H, Robbins P, Joseph D, et al. Can p53 alterations be used to predict tumour response to pre-operative chemo-radiotherapy in locally advanced rectal cancer? Radiother Oncol. 2000;56:239–244. doi: 10.1016/s0167-8140(00)00184-5. [DOI] [PubMed] [Google Scholar]
- 17.Scott N, Hale A, Deakin M, et al. A histopathological assessment of the response of rectal adenocarcinoma to combination chemoradiotherapy: Relationship to apoptotic activity, p53 and bcl-2 expression. Eur J Surg Oncol. 1998;24:169–173. doi: 10.1016/s0748-7983(98)92861-x. [DOI] [PubMed] [Google Scholar]
- 18.Esposito G, Pucciarelli S, Alaggio R, et al. P27kip1 expression is associated with tumor response to preoperative chemoradiotherapy in rectal cancer. Ann Surg Oncol. 2001;8:311–318. doi: 10.1007/s10434-001-0311-2. [DOI] [PubMed] [Google Scholar]
- 19.Gunther K, Dimmler A, Rodel F, et al. P27 does not predict histopathological response to radiochemotherapy in rectal cancer. J Surg Res. 2003;113:179–188. doi: 10.1016/s0022-4804(03)00049-0. [DOI] [PubMed] [Google Scholar]
- 20.Rau B, Sturm I, Lage H, et al. Dynamic expression profile of p21WAF1/CIP1 and Ki-67 predicts survival in rectal carcinoma treated with preoperative radiochemotherapy. J Clin Oncol. 2003;21:3391–3401. doi: 10.1200/JCO.2003.07.077. [DOI] [PubMed] [Google Scholar]
- 21.Tannapfel A, Nusslein S, Fietkau R, et al. Apoptosis, proliferation, bax, bcl-2 and p53 status prior to and after preoperative radiochemotherapy for locally advanced rectal cancer. Int J Radiat Oncol Biol Phys. 1998;41:585–591. doi: 10.1016/s0360-3016(98)00076-5. [DOI] [PubMed] [Google Scholar]
- 22.Rodel C, Grabenbauer GG, Papadopoulos T, et al. Apoptosis as a cellular predictor for histopathologic response to neoadjuvant radiochemotherapy in patients with rectal cancer. Int J Radiat Oncol Biol Phys. 2002;52:294–303. doi: 10.1016/s0360-3016(01)02643-8. [DOI] [PubMed] [Google Scholar]
- 23.Kim NK, Park JK, Lee KY, et al. p53, BCL-2, and Ki-67 expression according to tumor response after concurrent chemoradiotherapy for advanced rectal cancer. Ann Surg Oncol. 2001;8:418–424. doi: 10.1007/s10434-001-0418-5. [DOI] [PubMed] [Google Scholar]
- 24.Willett CG, Warland G, Cheek R, et al. Proliferating cell nuclear antigen and mitotic activity in rectal cancer: Predictor of response to preoperative irradiation. J Clin Oncol. 1994;12:679–682. doi: 10.1200/JCO.1994.12.4.679. [DOI] [PubMed] [Google Scholar]
- 25.Willett CG, Hagan M, Daley W, et al. Changes in tumor proliferation of rectal cancer induced by preoperative 5-fluorouracil and irradiation. Dis Colon Rectum. 1998;41:62–67. doi: 10.1007/BF02236897. [DOI] [PubMed] [Google Scholar]
- 26.Qiu H, Sirivongs P, Rothenberger M, et al. Molecular prognostic factors in rectal cancer treated by radiation and surgery. Dis Colon Rectum. 2000;43:451–459. doi: 10.1007/BF02237186. [DOI] [PubMed] [Google Scholar]
- 27.Staunton JE, Slonim DK, Coller HA, et al. Chemosensitivity prediction by transcriptional profiling. Proc Natl Acad Sci U S A. 2001;98:10787–10792. doi: 10.1073/pnas.191368598. [DOI] [PMC free article] [PubMed] [Google Scholar]
- 28.Scherf U, Ross DT, Waltham M, et al. A gene expression database for the molecular pharmacology of cancer. Nat Genet. 2000;24:236–244. doi: 10.1038/73439. [DOI] [PubMed] [Google Scholar]
- 29.Zembutsu H, Ohnishi Y, Tsunoda T, et al. Genome-wide cDNA microarray screening to correlate gene expression profiles with sensitivity of 85 human cancer xenografts to anticancer drugs. Cancer Res. 2002;62:518–527. [PubMed] [Google Scholar]
- 30.Mariadason JM, Arango D, Shi Q, et al. Gene expression profiling-based prediction of response of colon carcinoma cells to 5-fluorouracil and camptothecin. Cancer Res. 2003;63:8791–8812. [PubMed] [Google Scholar]
- 31.Chang JC, Wooten EC, Tsimelzon A, et al. Gene expression profiling for the prediction of therapeutic response to docetaxel in patients with breast cancer. Lancet. 2003;362:362–369. doi: 10.1016/S0140-6736(03)14023-8. [DOI] [PubMed] [Google Scholar]
- 32.Clarke PA, George ML, Easdale S, et al. Molecular pharmacology of cancer therapy in human colorectal cancer by gene expression profiling. Cancer Res. 2003;63:6855–6863. [PubMed] [Google Scholar]
- 33.Wang Y, Jatkoe T, Zhang Y, et al. Gene expression profiles and molecular markers to predict recurrence of Dukes’ B colon cancer. J Clin Oncol. 2004;22:1564–1571. doi: 10.1200/JCO.2004.08.186. [DOI] [PubMed] [Google Scholar]
- 34.Sauer R, Fietkau R, Wittekind C, et al. Adjuvant versus neoadjuvant radiochemotherapy for locally advanced rectal cancer: A progress report of a phase-III randomized trial (protocol CAO/ARO/AIO-94) Strahlenther Onkol. 2001;177:173–181. doi: 10.1007/pl00002396. [DOI] [PubMed] [Google Scholar]
- 35.Dworak O, Keilholz L, Hoffmann A. Pathological features of rectal cancer after preoperative radiochemotherapy. Int J Colorectal Dis. 1997;12:19–23. doi: 10.1007/s003840050072. [DOI] [PubMed] [Google Scholar]
- 36.Gavioli M, Bagni A, Piccagli I, et al. Usefulness of endorectal ultrasound after preoperative radiotherapy in rectal cancer: Comparison between sonographic and histopathologic changes. Dis Colon Rectum. 2000;43:1075–1083. doi: 10.1007/BF02236553. [DOI] [PubMed] [Google Scholar]
- 37.Sauer R, Becker H, Hohenberger W, et al. Preoperative versus postoperative chemoradiotherapy for locally advance rectal cancer. N Engl J Med. 2004;351:1731–1740. doi: 10.1056/NEJMoa040694. [DOI] [PubMed] [Google Scholar]
- 38.Liersch T, Langer C, Jakob C, et al. Preoperative diagnostic procedures in locally advanced rectal carcinoma (> or =T3 or N+): What does endoluminal ultrasound achieve at staging and restaging (after neoadjuvant radiochemotherapy) in contrast to computed tomography? Chirurg. 2003;74:224–234. doi: 10.1007/s00104-002-0609-z. [DOI] [PubMed] [Google Scholar]
- 39.Adams DR, Blatchford GJ, Lin KM, et al. Use of preoperative ultrasound staging for treatment of rectal cancer. Dis Colon Rectum. 1999;42:159–166. doi: 10.1007/BF02237121. [DOI] [PubMed] [Google Scholar]
- 40.Glaser F, Schlag P, Herfarth C. Endorectal ultrasonography for the assessment of invasion of rectal tumours and lymph node involvement. Br J Surg. 1990;77:883–887. doi: 10.1002/bjs.1800770813. [DOI] [PubMed] [Google Scholar]
- 41.Heald RJ, Ryall RD. Recurrence and survival after total mesorectal excision for rectal cancer. Lancet. 1986;1:1479–1482. doi: 10.1016/s0140-6736(86)91510-2. [DOI] [PubMed] [Google Scholar]
- 42.Sobin LH, Wittekind C. UICC: TNM Classification of Malignant Tumors. 5. New York, NY: John Wiley & Sons; 1997. [Google Scholar]
- 43.Simon R, Peng A. BRB ArrayTools. Bethesda, MD: National Cancer Institute; 2003. [Google Scholar]
- 44.Wright GW, Simon RM. A random variance model for detection of differential gene expression in small microarray experiments. Bioinformatics. 2003;19:2448–2455. doi: 10.1093/bioinformatics/btg345. [DOI] [PubMed] [Google Scholar]
- 45.Dudoit S, Fridlyand J, Speed TP. Comparison of discrimination methods for the classification of tumors using gene expression data. J Am Stat Assoc. 2002:77–87. [Google Scholar]
- 46.Ntzani EE, Ioannidis JP. Predictive ability of DNA microarrays for cancer outcomes and correlates: An empirical assessment. Lancet. 2003;362:1439–1444. doi: 10.1016/S0140-6736(03)14686-7. [DOI] [PubMed] [Google Scholar]
- 47.Simon R, Radmacher MD, Dobbin K, et al. Pitfalls in the use of DNA microarray data for diagnostic and prognostic classification. J Natl Cancer Inst. 2003;95:14–18. doi: 10.1093/jnci/95.1.14. [DOI] [PubMed] [Google Scholar]
- 48.Radmacher MD, McShane LM, Simon R. A paradigm for class prediction using gene expression profiles. J Comput Biol. 2002;9:505–511. doi: 10.1089/106652702760138592. [DOI] [PubMed] [Google Scholar]
- 49.Theodoropoulos G, Wise WE, Padmanabhan A, et al. T-level downstaging and complete pathologic response after preoperative chemoradiation for advanced rectal cancer result in decreased recurrence and improved disease-free survival. Dis Colon Rectum. 2002;45:895–903. doi: 10.1007/s10350-004-6325-7. [DOI] [PubMed] [Google Scholar]
- 50.Gerard JP, Chapet O, Nemoz C, et al. Preoperative concurrent chemoradiotherapy in locally advanced rectal cancer with high-dose radiation and oxaliplatin-containing regimen: The Lyon R0-04 phase II trial. J Clin Oncol. 2003;21:1119–1124. doi: 10.1200/JCO.2003.10.045. [DOI] [PubMed] [Google Scholar]
- 51.Rodel C, Grabenbauer GG, Papadopoulos T, et al. Phase I/II trial of capecitabine, oxaliplatin, and radiation for rectal cancer. J Clin Oncol. 2003;21:3098–3104. doi: 10.1200/JCO.2003.02.505. [DOI] [PubMed] [Google Scholar]
- 52.Yazdi PT, Wang Y, Zhao S, et al. SMC1 is a downstream effector in the ATM/NBS1 branch of the human S-phase checkpoint. Genes Dev. 2002;16:571–582. doi: 10.1101/gad.970702. [DOI] [PMC free article] [PubMed] [Google Scholar]
- 53.Kim ST, Xu B, Kastan MB. Involvement of the cohesin protein, Smc1, in Atm-dependent and independent responses to DNA damage. Genes Dev. 2002;16:560–570. doi: 10.1101/gad.970602. [DOI] [PMC free article] [PubMed] [Google Scholar]
- 54.Ishisaki Z, Takaishi M, Furuta I, et al. Calmin, a protein with calponin homology and transmembrane domains expressed in maturing spermatogenic cells. Genomics. 2001;74:172–179. doi: 10.1006/geno.2001.6544. [DOI] [PubMed] [Google Scholar]
- 55.Etienne-Manneville S, Hall A. Cdc42 regulates GSK-3beta and adenomatous polyposis coli to control cell polarity. Nature. 2003;421:753–756. doi: 10.1038/nature01423. [DOI] [PubMed] [Google Scholar]
- 56.Harwood A, Braga VM. Cdc42 & GSK-3: Signals at the crossroads. Nat Cell Biol. 2003;5:275–277. doi: 10.1038/ncb0403-275. [DOI] [PubMed] [Google Scholar]
- 57.Stossel TP, Condeelis J, Cooley L, et al. Filamins as integrators of cell mechanics and signalling. Nat Rev Mol Cell Biol. 2001;2:138–145. doi: 10.1038/35052082. [DOI] [PubMed] [Google Scholar]
- 58.Athman R, Louvard D, Robine S. The epithelial cell cytoskeleton and intracellular trafficking: III. How is villin involved in the actin cytoskeleton dynamics in intestinal cells? Am J Physiol Gastrointest Liver Physiol. 2002;283:G496–G502. doi: 10.1152/ajpgi.00207.2002. [DOI] [PubMed] [Google Scholar]
- 59.Karcher RL, Deacon SW, Gelfand VI. Motor-cargo interactions: The key to transport specificity. Trends Cell Biol. 2002;12:21–27. doi: 10.1016/s0962-8924(01)02184-5. [DOI] [PubMed] [Google Scholar]