Abstract
Glycoprotein changes occur in not only protein abundance but also the occupancy of each glycosylation site by different glycoforms during biological or pathological processes. Recent advances in mass spectrometry instrumentation and techniques have facilitated analysis of intact glycopeptides in complex biological samples by allowing the users to generate spectra of intact glycopeptides with glycans attached to each specific glycosylation site. However, assigning these spectra, leading to identification of the glycopeptides, is challenging. Here, we report an algorithm, named GPQuest, for site-specific identification of intact glycopeptides using higher-energy collisional dissociation (HCD) fragmentation of complex samples. In this algorithm, a spectral library of glycosite-containing peptides in the sample was built by analyzing the isolated glycosite-containing peptides using HCD LC-MS/MS. Spectra of intact glycopeptides were selected by using glycan oxonium ions as signature ions for glycopeptide spectra. These oxonium-ion-containing spectra were then compared with the spectral library generated from glycosite-containing peptides, resulting in assignment of each intact glycopeptide MS/MS spectrum to a specific glycosite-containing peptide. The glycan occupying each glycosite was determined by matching the mass difference between the precursor ion of intact glycopeptide and the glycosite-containing peptide to a glycan database. Using GPQuest, we analyzed LC-MS/MS spectra of protein extracts from prostate tumor LNCaP cells. Without enrichment of glycopeptides from global tryptic peptides and at a false discovery rate of 1%, 1008 glycan-containing MS/MS spectra were assigned to 769 unique intact N-linked glycopeptides, representing 344 N-linked glycosites with 57 different N-glycans. Spectral library matching using GPQuest assigns the HCD LC-MS/MS generated spectra of intact glycopeptides in an automated and high-throughput manner. Additionally, spectral library matching gives the user the possibility of identifying novel or modified glycans on specific glycosites that might be missing from the predetermined glycan databases.
Graphical abstract
Glycosylation is one of the most common protein modifications spanning more that 50% of the proteome. Glycosylation mediates many of the cell functions including interaction of the cells with the extra cellular matrix and other cells, growth and proliferation, cell division, and bacterial and viral infection. Therefore, its role in diseases such as cancer, cardiovascular diseases, and infectious diseases has been observed and confirmed in numerous studies.1–7 Glycosylation can happen in two different forms: N-glycosylation which is the attachment of glycan chains to N–X–T or N–X–S motifs on proteins, where X can be any amino acid except proline, and O-glycosylation which is the attachment of O-glycan core structures to S or T residues on the polypeptides.1,2
Unlike proteins, structures of glycans are not explicitly coded by the genome. In fact, protein glycosylation is determined by proteins involved in glycan biosynthesis pathways whose activities are affected by protein abundance and cell type-specific events. In addition, glycosylation at a specific glycosylation site of a glycoprotein is also regulated by other factors such as substrate glycoprotein abundance, protein folding, cell type, and its development and metabolic state. These factors result in what is called the microheterogeneity of glycosylation, where the occupancy of identical protein glycosylation sites (glycosites) by different glycan structures varies.4,8,2 The microheterogeneity of glycosylation mediates the function and properties of the glycoproteins. For example, increased sialylation of glycans on IgG affects its antiinflammatory properties.9 In addition, numerous studies have shown that during the progression of diseases, both glycans and glycoproteins can go through changes in their structures and abundance, suggesting that in fact changes in glycans or glycoproteins are not independent of each other.4,10,6,11 Therefore, various pathological conditions induce changes in the microheterogeneity of glycoproteins, structures of glycans, and occupancy of each glycosite by different glycans. Since these glycan attachments mediate the function of the glycoprotein, knowing the changes in microheterogeneity of glycosylation at each glycosite of a glycoprotein is essential to understanding their roles. In addition, this topic is of particular interest in developing antibodies against glycoproteins and in the field of vaccine development.12
Mass spectrometry analysis is routinely used for characterization of glycans and peptides in recombinant proteins and complex biological samples.13–15 Various fragmentation techniques have been investigated for analysis of glycopeptides. These techniques, mainly operated on the basis of vibrational or electronic excitation energies, yield unique fragmentation patterns.16 For example, collision-induced dissociation (CID) results in fragmentation of the attached glycan leaving the peptide backbone intact, while electron transfer dissociation (ETD) breaks the peptide backbone leaving the intact glycans attached to the amino acids, thus revealing the glycosylation site.17–19 Therefore, multiple tandem approaches are usually required to fully characterize the structure of intact glycopeptides.18 Higher-energy collisional dissociation (HCD) is another fragmentation method that results in fractionation of both glycans and peptides of glycopeptides.20 Eliminating the need for multiple tandem fragmentation approaches, HCD fragmentation provides extensive information regarding the peptide backbone of each intact glycopeptide, including b and y ions of peptide as well as the mass of glycan attached to the glycopeptide.16,21 However, assignments of tandem mass spectra to intact glycopeptides, including characterization of specific glycosites and their occupying glycans, is a challenging but critical step to determine the microheterogeneity of the glycosylation at each glycosite.16,22,21,23–28
In this study, we present a novel algorithm named GPQuest for automatic identification of intact glycopeptides from HCD spectra of complex biological samples based on spectral library matching. This algorithm uses the spectral library built from proteomics analysis of glycosite-containing peptides from the complex biological sample using HCD. GPQuest takes advantage of the fact that tandem mass spectra of intact glycopeptides contain oxonium ions and the fragment ions generated through HCD fragmentation of intact glycopeptides resemble the pattern of the same ions in the MS/MS spectra of their deglycosylated counterparts. Therefore, the MS/MS spectra of HCD-fragmented intact glycopeptides are selected using oxonium ions and matched against the generated spectral library to identify the glycosite-containing peptides and the glycosites. After identification of the peptide portion of the intact glycopeptide, the exact precursor mass is used to identify the glycan portion by matching with a glycan database. In this study, we analyzed protein lysates from LNCaP cells and identified 769 unique intact glycopeptides. Besides the glycopeptide-matching MS/MS spectra, we identified other MS/MS spectra that matched to glycosites in the spectral library, while their corresponding glycan masses were not included in the glycan database. Further investigation of the unknown glycans led to assignment of glycans that were modified by an additional moiety with a mass of 17.018 Da. This modification was particularly shown for high-mannose structures. Identifying the peptide portion of the intact glycopeptide first, the GPQuest algorithm allows for identification of possibly novel glycans as well as modified glycans attached to the peptides, which could be of great value particularly in recognizing the pathologically induced changes of glycosylation.
METHODS
Materials and Reagents
LNCaP cell line was obtained from ATCC. Hydrazide beads were purchased from Bio-Rad laboratories (Hercules, CA). Peptide-N-glycosidase F (PNGase F) was from New England Biolabs (Ipswich, MA). Sequencing-grade trypsin was purchased from Promega (Madison, WI). C18 desalting cartridges were purchased from Waters (Milford, MA). All other reagents were purchased from Sigma-Aldrich (St. Louis, MO) unless otherwise specified.
LNCaP Sample Preparation and Mass Spectrometry Analysis
LNCaP cells were lysed, and the extracted proteins were alkylated by treating with iodoacetamide. The sample was digested using trypsin at 37 °C overnight. Tryptic peptides were labeled with iTRAQ reagents according to the manufacturer instructions and then desalted and purified using C18 columns. Ninety percent of the sample was enriched for glycosite-containing peptides using the SPEG method. Briefly, the samples were treated with a 10 mM sodium periodate solution and conjugated to hydrazide beads at room temperature in the dark on a shaker. Nonspecific binding was removed by washing the hydrazide beads. The glycosite-containing peptides were detached from the immobilized Nglycans with PNGase F treatment and collected for mass spectral analysis. The remaining 10% of the tryptic peptide mixture was dried in a speedVac, resuspended in 0.4% acetic acid, and fractionated for mass spectral analysis. The global tryptic peptides were fractionated using basic reverse phase liquid chromatography (bRPLC). The collected 96 fractions were combined into 24 fractions. The glycosite-containing peptides that were isolated from the cells using the SPEG technique were directly analyzed by LC-MS/MS without fractionation. A 1 µg aliquot of each sample was separated through a C18 column on a Dionex Ultimate 3000 RSLC nano system (Thermo Scientific) and analyzed on a Q Exactive mass spectrometer (Thermo Scientific). Data-dependent HCD fragmentation was performed on the 15 most abundant ions using an isolation window of 4 m/z. Using charge state screening, unassigned, singly, eight, and more than eight protonated ions were rejected. In addition, an exclusion 25 s window was applied to avoid multiple selections of the same ions.
Building the Experimental Spectral Library (ESL) for Glycosite-Containing Peptides
The mass spectrometry results of the SPEG-enriched glycosite-containing peptides were analyzed using SEQUEST in the Proteome Discoverer software with the following parameters: fixed Cys modification, dynamic PNGase-F facilitated conversion of Asn to Asp, and dynamic oxidation of Met in addition to a maximum of two miscleavages. The top peptide match for each spectrum was selected. For each peptide, list of singly, doubly. and triply charged b and y fragment ions were generated. The MS/MS spectra matched to each peptide were searched for the presence of these ions. The experimental spectral library, which contained the list of target glycosite-containing peptides and their present fragment ions, was built based on the results of this search. Any peptide with less than four observed fragment ions was removed from the target database and the experimental spectral library.
Preprocessing
The generated raw files containing the acquired mass spectra were converted to mzXML files using the msconvert utility in the Trans-Proteomic Pipeline software. The “centroid all scans” option was selected. The mzXML file corresponding to each of the tryptic global peptide runs was opened in MATLAB. The MS/MS spectra of the glycopeptides were distinguished from peptide MS/MS based on the presence of oxonium ions. These ions belong to glycan free monosaccharides or disaccharides that were fragmented during the tandem mass spectrometry analysis. In this step, the MS/MS spectra including at least two of the oxonium ions with the masses of 138 (internal fragment of HexNAc), 145 (Hex–H2O), 163 (Hex), 168 (HexNAc–2H2O), 186 (HexNAc–H2O), 204 (HexNAc), 325 (Hex2), 366 (HexHexNAc), 274 (Neu5Ac–H2O), or 292 (Neu5Ac) were isolated as oxoniumion-containing spectra. For the spectra with more than 100 peaks, oxonium ions were searched in the top 10% of the mass spectral peaks within a 10 ppm window.
Matching the Spectra of HCD-Fragmented Glycopeptides with the ESL
Each oxonium-ion-containing MS/MS spectrum was compared with the compiled experimental spectral library (ESL). For each target peptide in the ESL, the percentage of the b and y ions that were observed in the MS/MS spectrum was calculated. In addition, a list of candidate intact peptide ions was generated for each ESL peptide, and the MS/MS spectrum was searched for the presence of these ions. A total of nine intact peptide ions was considered including singly, doubly, and triply charged intact peptide and intact peptide + HexNAc and singly charged intact peptide + HexNAc0,2 cross-ring cleavage ion, intact peptide + FucHex- NAc, and intact peptide + HexNAc2. The peptide matches were first filtered based on the number of their observed intact peptide ions. The number of required ions for each peptide depends on the length of the peptide and is shown in Table 1. The results were further refined by applying an FDR of 1%. A 50 ppm window was used for matching the b, y, and intact peptide ions.
Table 1.
Minimum Number of Required Intact Peptide Ions and Intact Peptide Ions with Partial Glycans for Each Glycosite-Containing Peptide Based on Its Lengtha
| peptide length | minimum number of required intact peptide ions |
|---|---|
| 5 < peptide length < 11 | 3 |
| 10 < peptide length < 16 | 2 |
| 15 < peptide length < 21 | 1 |
| 20 < peptide length | 0 |
The number of observed intact peptide ions decreases for longer peptides. Therefore, a length-dependent threshold on the number of required intact peptide ions is used to refine the match results.
Assignment of Glycans Attached to Glycosite-Containing Peptides at Each Glycosite
To identify the monoisotopic peak for each dissociated ion and correct the mass shift, the MS spectra were averaged over a window of 15 spectra centered at the precursor MS. The first peak in the averaged isotopic cluster corresponding to the precursor mass was picked as the monoisotopic peak. The glycan composition was then deduced by first calculating its mass from the monoisotopic mass and the peptide mass and then running an exact match search against the glycan database with a mass tolerance of 10 ppm.
RESULTS
Building the Spectral Library for Glycosite-Containing Peptides
The application of the GPQuest algorithm requires an experimental spectral library (ESL) of glycosite-containing peptides as a basis to identify the peptide portion of the intact glycopeptide in each MS/MS spectrum. The ESL can be generated from the glycosite-containing peptides isolated from the sample. The ESL contains the experimentally observed b and y ions for each of these peptides, which are the most dominant ions in the HCD spectra compared to other ion types. To generate the ESL, the glycosite-containing peptides were first isolated from the sample using the solid-phase extraction of N-linked glycosite-containing peptides (SPEG) technique.15,29 The mass spectral results of the SPEG-enriched glycosite-containing peptides were searched using SEQUEST in the Proteome Discoverer (PD) software to identify 2213 N-linked glycosite-containing peptides in the sample, and the PD output was used to compile the list of peptides in the ESL (Supplementary Information Table 1). The list of b and y fragment ions, including doubly and triply charged ions, was generated for the ESL peptides. The spectral library was built by identifying all the experimentally observed b and y ions for each identified peptide in the sample.
Matching the Spectra of HCD-Fragmented Glycopeptides with the ESL
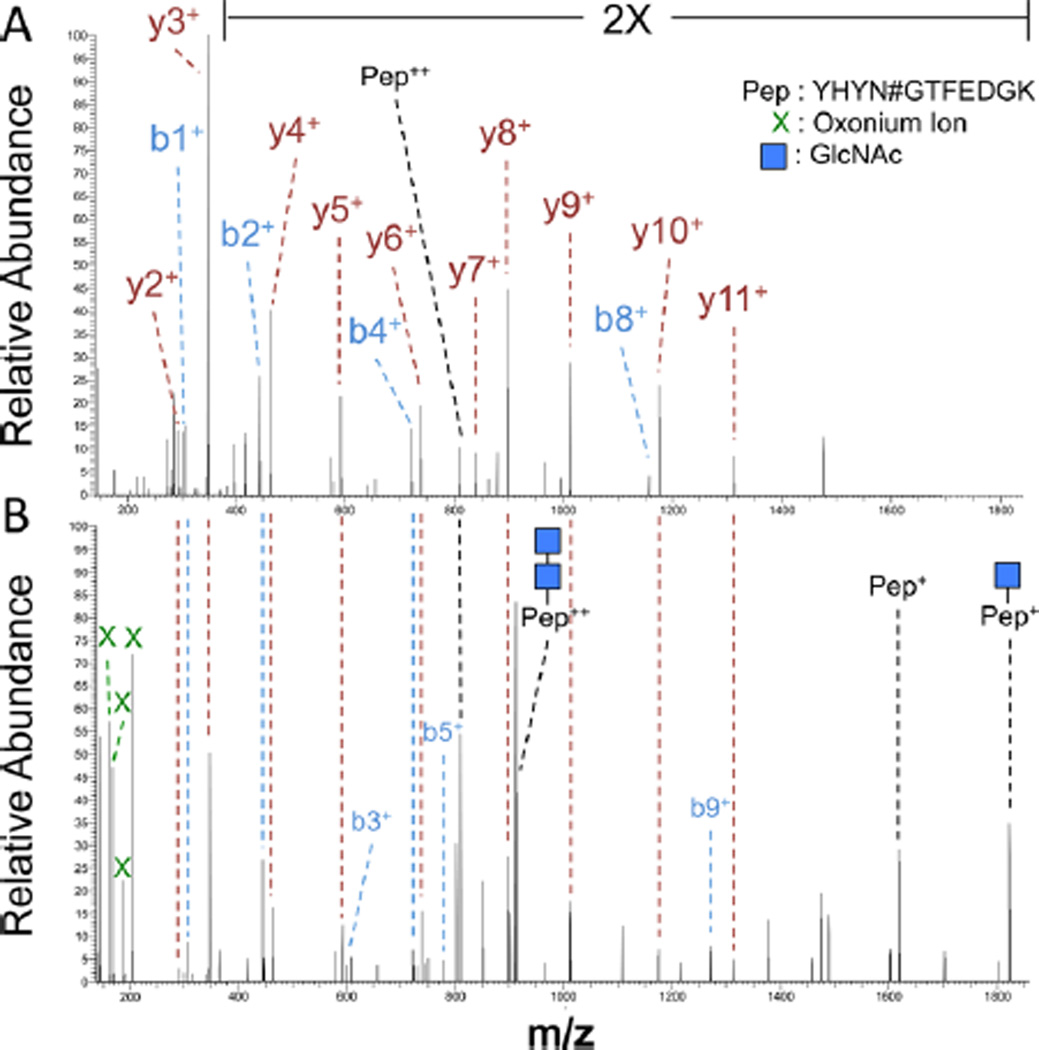
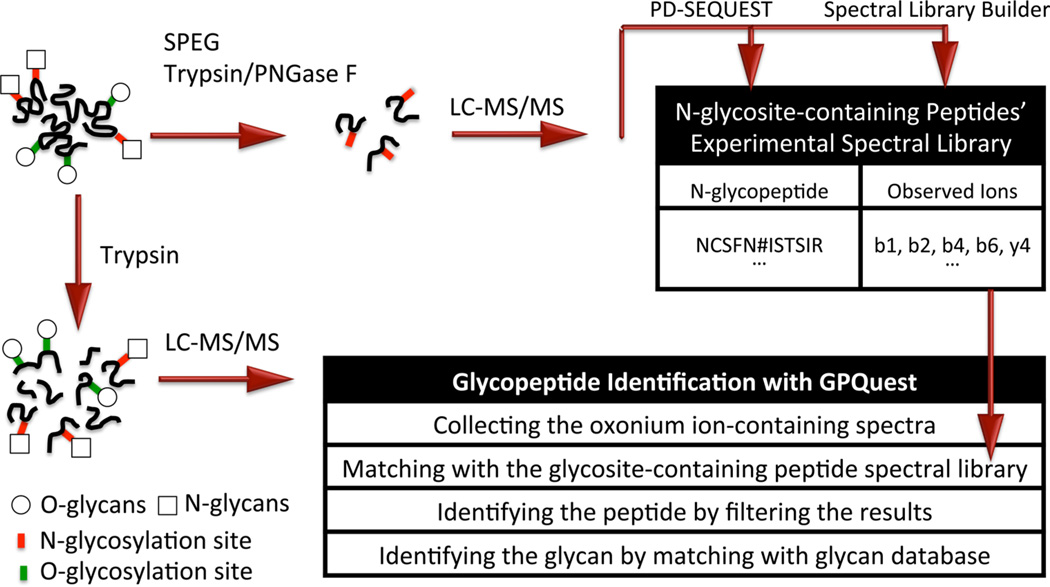
Understanding the pattern of HCD fragmentations of glycopeptides is crucial in identifying optimal algorithms for matching of the spectra to glycopeptides. Based on observation of HCD fragmented glycopeptide MS/MS spectra, the most abundant ions are classified into four main groups of (1) oxonium ions, (2) peptide b and y ions, (3) intact peptide attached to partial glycan ions, and (4) peptide b and y ions attached to partial glycan ions. In the majority of the MS/MS spectra corresponding to glycopeptides, a minimum of two oxonium ions are observed among the highest mass spectral peaks. We used this characteristic to select glycopeptide MS/MS spectra based on the presence of at least two signature oxonium ions in the highest 10% of the peaks. The second group of ions generated by HCD fragmentation of glycopeptides is the peptide b and y ions. These ions, which lie in the mass range between the first and the third group, are not as abundant as oxonium ions. However, they have a similar pattern to the fragmentation pattern of their deglycosylated glycosite-containing peptide counterparts. Figure 1A shows the MS/MS spectra of the deglycosylated “YHYN#GTFEDGK” peptide, while the MS/MS spectrum corresponding to the glycosylated “YHYN#GTFEDGK” is depicted in Figure 1B. Comparing the two spectra showed that although the overall signal intensity of b and y ions was lower in the fragmented glycopeptide, the patterns of these fragment ions were similar between the spectra of fragmented intact glycopeptide and the deglycosylated glycosite-containing peptide that had been released from glycans using the SPEG technique. In the second step of the algorithm, we took advantage of this repeated pattern to identify the peptide portion of the intact glycopeptide for each MS/MS spectrum by evaluating its matching with the ESL. The overlap between each MS/MS spectrum of intact glycopeptide and each peptide entry in the ESL was estimated by calculating the percentage of the experimental b and y ions that the two share. The results were later refined by removing the matches whose overlap with the ESL did not reach a certain threshold. This threshold was determined by the desired false discovery rate (FDR). The third group of glycopeptide MS/MS ions of interest, i.e., the intact peptides with partial glycan structures, were again among the highest peaks in the mass spectra. The ions of intact peptides and intact peptides attached to one or two HexNAc residues repeatedly were reported among the highest peaks.20,16 Therefore, the presence of peptide ions with or without partial glycan attachments was used as an additional criterion to identify the peptide portion of the glycopeptides. The fourth group of ion, i.e., peptide b and y ions attached to partial glycans, can be used to further assign the remaining peaks to the glycopeptide ions. It should be noted that the presence of peptide b and y fragment ions as well as intact peptides with partial glycan ions depends on the length of the peptide, meaning that for longer peptides b and y ions of peptide backbone are more dominantly observed, whereas for shorter peptides intact peptide ions are more prevalent. Therefore, a combination of all these ions is necessary to ensure the accuracy of the matching process. To account for the difference in peptide length, a peptide length-dependent threshold on the minimum number of present intact peptide ions was used to further refine the matches. The threshold was prespecified for each peptide based on its length as shown in Table 1. At the end, by subtracting the mass of the identified peptide portion from the corrected precursor mass, we calculated the mass of the glycan portion of the glycopeptides. Figure 2 depicts the schematic workflow of the spectral library matching approach used in the GPQuest algorithm.
Figure 1.
Comparison of the MS/MS spectra of HCD-fragmented glycosylated peptides with and without PNGase F treatment. (A) MS/ MS spectrum of the deglycosylated glycosite-containing peptide “YHYN#GTFEDGK” is dominated by b and y fragment ions. (B) MS/MS spectrum of a sample glycosylated peptide can be distinguished from the nonglycosylated peptides based on the presence of numerous oxonium ions marked by a cross. The intact peptide ions “YHYN#GTFEDGK” with partial glycan attachments are usually, and particularly for shorter peptides, the second most dominant set of ions in the MS/MS spectrum of a glycosylated peptide. The b and y fragment ions lie between the two aforementioned sets of ions and follow the pattern of the PNGase F-treated peptide.
Figure 2.
Schematic workflow of the spectral library matching approach in the GPQuest algorithm. The glycosite-containing peptides were isolated using the SPEG technique and analyzed with HCD LC-MS/MS analysis. The MS/MS spectra were assigned to glycosite-containing peptides by proteomics tools, such as PD-SEQUEST, and were used to build the corresponding sample-specific ESL by searching the spectra for b and y ions of each identified peptide. The ESL was then compared with the mass spectra of intact glycopeptides in the sample to identify the peptide portion of the intact glycopeptide corresponding to each oxonium-ion-containing MS/MS spectrum. The glycan portion was identified by matching its corresponding mass to the glycan database.
Estimation of the False Discovery Rate Using Decoy Strategy
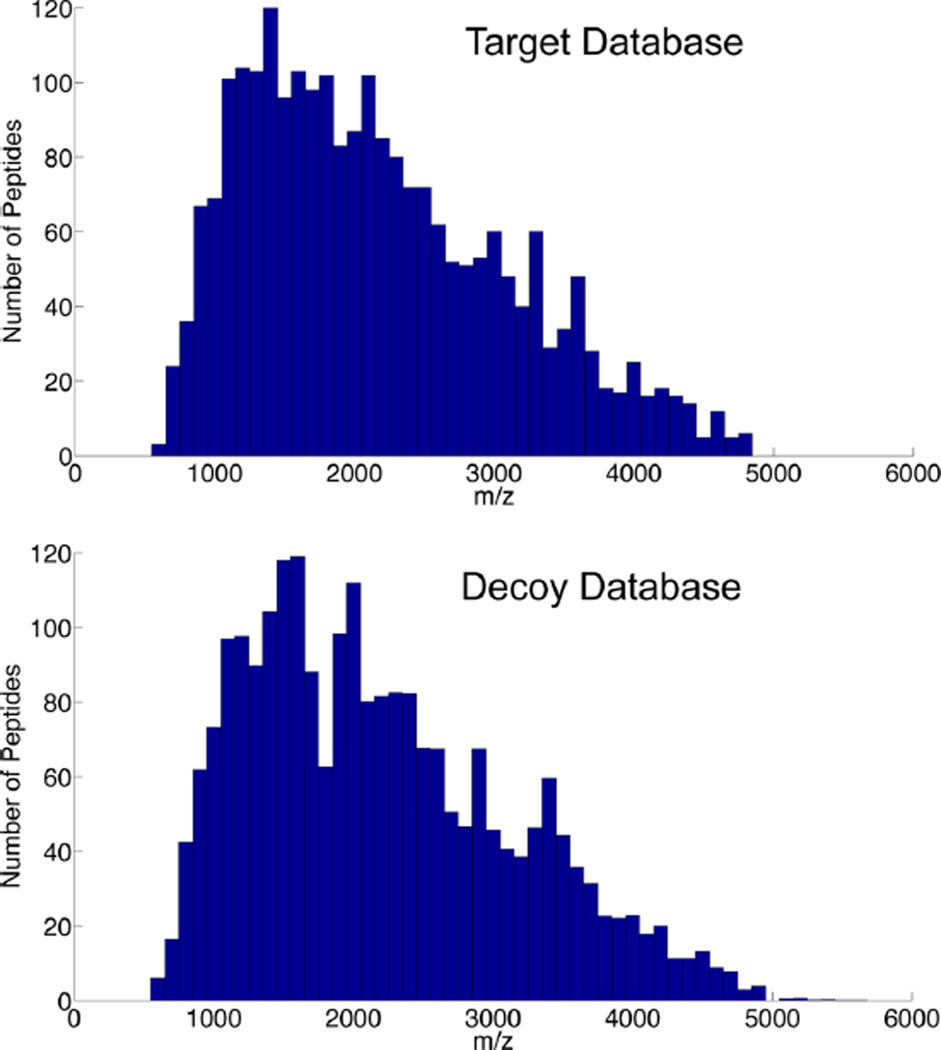
False discovery rate (FDR) is a crucial parameter in defining the specificity of the identification. The FDR can be calculated through either diversifying the spectra against the database of interest or diversifying the peptide database by adding decoy peptides to it. Creating a reverse database is the most common method to generate a decoy database because the reverse database resembles the target peptides in terms of number of peptides, peptide length, and precursor molecular weight. However, the theoretical MS/MS spectra of the reverse database do not match the target database. Hence, matches to the reverse database resemble the random matches in the target database.30 The GPQuest, matching the ESL to the observed tandem spectra, uses not only the b and y ions but also the intact peptide ions with or without attached partial monosaccharides to narrow down the peptide-spectral matches (PSM). The theoretical MS/MS of the reverse database contains identical intact peptide ions to those of the target database, thus elevating the number of random and false matches. In this study, to generate the decoy database, we combined the amino acids from all SPEG-identified glycosite-containing peptides, shuffled them, and broke them into decoy peptide sequences with the same length as the target database. Figure 3 shows the mass distribution of the target database and an average of 10 randomly generated decoy databases created by this strategy and depicts the similarity between these databases.
Figure 3.
Comparison of the distribution of mass/charge (m/z) ratio between the target and decoy databases. The decoy database was generated by shuffling the amino acids of the peptides in the target database and dividing them into peptides with the same lengths as the target database. The mass/charge ratio distribution of the decoy database resembles that of the target database, which is important for evaluating the FDR of the algorithm according to the number of false matches to the decoy database.
Assignment of Glycans Attached to Glycosite-Containing Peptides at Each Glycosite
Correct assessment of the precursor mass is of great significance while assigning the glycan portion of the glycopeptide structure corresponding to each MS/MS spectrum. The abundance of glycopeptides is considerably lower than that of the peptides in a complex sample, and the isotopic distribution of glycopeptides is different from that of peptides without glycans attached. This results in deviations in the isotopic pattern of glycopeptides such as obscuring the monoisotopic peak and subsequently increasing the possibility of inaccurate or wrong assignment of monoisotopic peaks of glycopeptides. Therefore, the precursor ion mass provided in the mzXML file might be as much as a few daltons off. Using a shifted precursor mass will result in either match failure or matching to a wrong glycopeptide structure. For example, the mass difference between two fucose residues and one N-acetylneuraminic acid (Neu5Ac) residue is equal to 1.02 Da. Therefore, an error in the detection of the right mass of monoisotopic peak in the glycopeptide ion cluster could result in assigning the wrong glycan structure to the MS/MS spectrum.
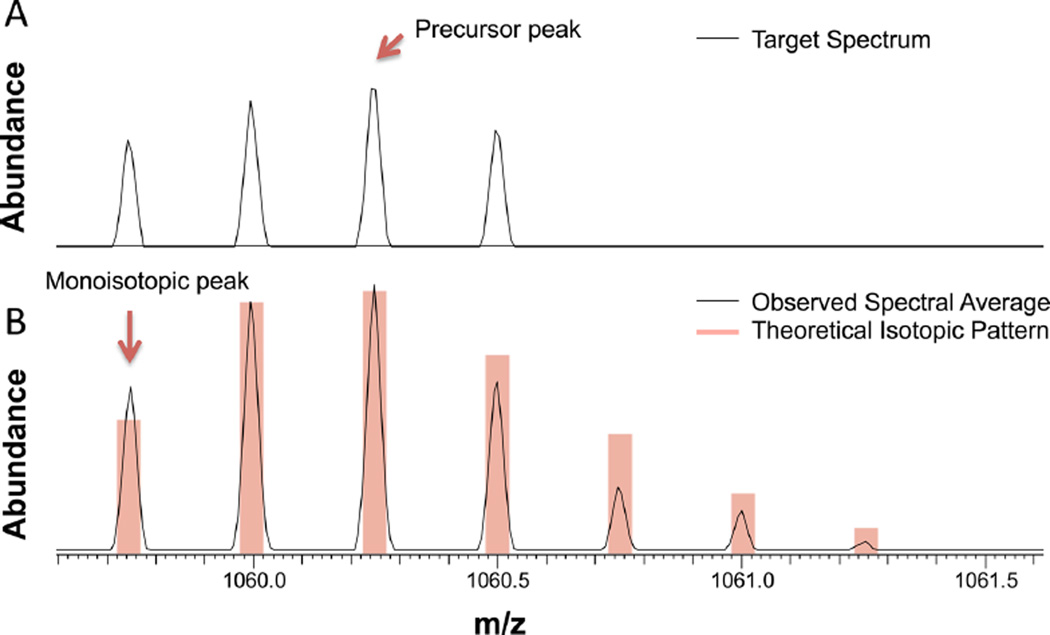
To determine the accurate mass of the monoisotopic peak of a glycopeptide, we calculated the average spectrum of consecutive MS spectra in the vicinity of the glycopeptide of interest over the elution time. The averaging improved the cluster isotopic pattern and the identification of the monoisotopic peak mass, which consequently improved the assignment of the glycopeptide spectrum. Figure 4A shows a glycopeptide isotopic cluster observed in a single MS1 spectrum and the precursor mass reported by the instrument software in the mzXML file. GPQuest identified the correct monoisotopic peak after averaging the spectra over a ~1 min elution time window (Figure 4B).
Figure 4.
Detection of the glycopeptide monoisotopic peak. (A) Isotopic pattern of a glycopeptide peak (TN#ITLVCKPGDLESAPVLR, Man9). The reported precursor mass is 2 Da off the monoisotopic peak. (B) Precursor mass correction by averaging a window of MS spectra over the glycopeptide elution time greatly improves the isotopic distribution of the cluster by comparison with the theoretical pattern, thus improving the detection of monoisotopic mass. The precursor peak and the monoisotopic peak are marked by a red arrow.
After assignment of precursor mass and the peptide portion of the intact glycopeptide and glycosite, the exact mass of the glycan portion was determined by subtracting the peptide mass from the glycopeptide mass. To determine the glycan structure on each glycosite, the calculated glycan mass was compared with a glycan database and the glycan composition was determined at a mass tolerance of 10 ppm. The glycan database was composed by compiling several human serum or plasma Nglycan libraries31,32 with N-glycans identified from various human samples analyzed in our lab.33,34 All glycans with equal number of Hex, HexNAc, Fuc, and NeuAc monosaccharide residues in their compositions were grouped together and represented as a single entry, leading to 208 unique N-glycan compositions in the database (Supporting Information Table 2).
Glycoproteomics Analysis of the LNCaP Cells Using GPQuest
To identify glycopeptides from a complex sample, 24 fractions of LNCaP tryptic peptides and SPEG-enriched glycosite-containing peptides were analyzed, and glycopeptides were identified using the GPQuest spectral library matching algorithm. The generated ESL for the LNCaP samples, which was built based on the mass spectrometric analysis of SPEG-enriched glycosite-containing peptides, contained 2213 target peptides (Supporting Information Table 1). Of the total number of 985 509 spectra in all 24 fractions, 7243 contained at least two oxonium ions and were isolated as tandem spectra corresponding to glycopeptides.
With no filtering on the percentage of observed b and y ions, a total of 137 227 PSMs were attained, where each matched MS/MS scan was matched to an average of 23.9 PSMs. Refining the results based on a threshold on the minimum percentage of overlap between the ESL and the spectra to achieve a reasonable FDR, as expected, decreased the number of PSMs.
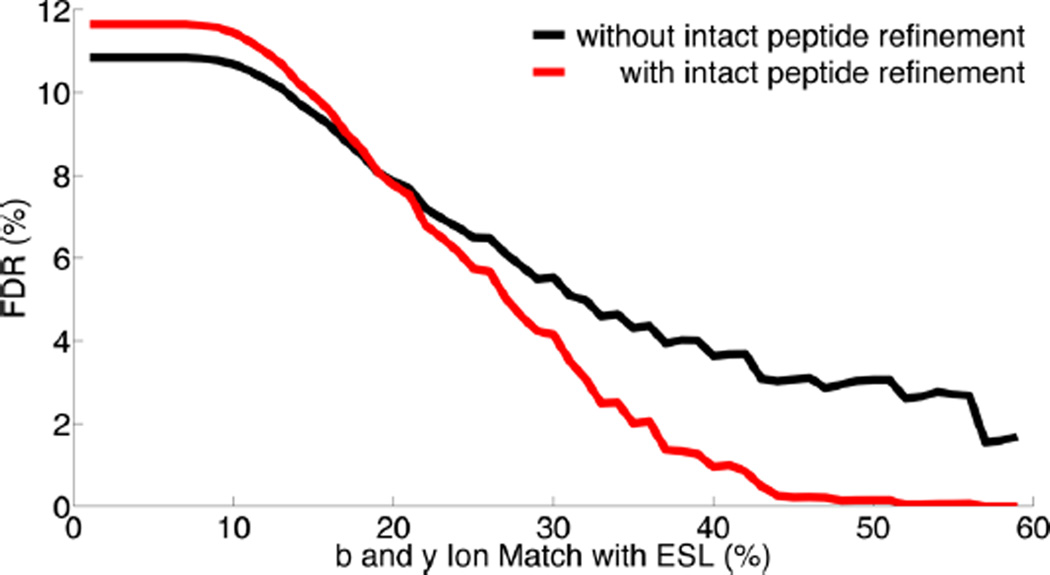
For estimation of the FDR, the decoy database was built as described and merged with the target database resulting in a total of 4426 peptides in the peptide database. The FDR was calculated based on the percentage of PSMs matched to the decoy database. A curve was calculated by changing the threshold on the percentage of b and y ion overlap with ESL and calculating and plotting the FDR as a function of this threshold. The optimal threshold for refining the results was determined by the desired FDR on this curve. Figure 5 shows the FDR as a function of this threshold in red and black, where the red curve corresponds to the GPQuest algorithm and the black curve corresponds to similar analysis, with the only difference that the match refinement step based on the number of observed intact peptide ions was omitted. From this figure, we estimated that a threshold of 40% results in an FDR of approximately 1%. In addition, this figure demonstrated how the use of intact peptide ions for filtering the results improved the FDR. Using a 1% FDR cut down the number of PSMs to 4213 and the average number of PSMs per matched MS/MS scan to 1.6.
Figure 5.
Estimation of FDR for glycoproteomics analysis of the LNCaP samples. The FDR was calculated as a function of the percentage of b and y ions in the MS/MS spectra matching the ESL library in the LNCaP cell analysis. The red curve, showing the FDR analysis for the GPQuest algorithm, shows that an FDR of 1% is achieved by setting this threshold at 40%. The FDR curve in black shows the results of FDR calculation omitting the use of intact peptide ions for refining the results. Comparing the two curves shows that taking the intact peptide ions into account improves the FDR and, subsequently, the specificity of the algorithm.
Applying the aforementioned filters in this study, 344 unique glycosite-containing peptides were matched to 57 N-glycan compositions, and 769 unique intact N-glycopeptides were identified from LNCaP cells using the GPQuest algorithm (Supporting Information Table 3).
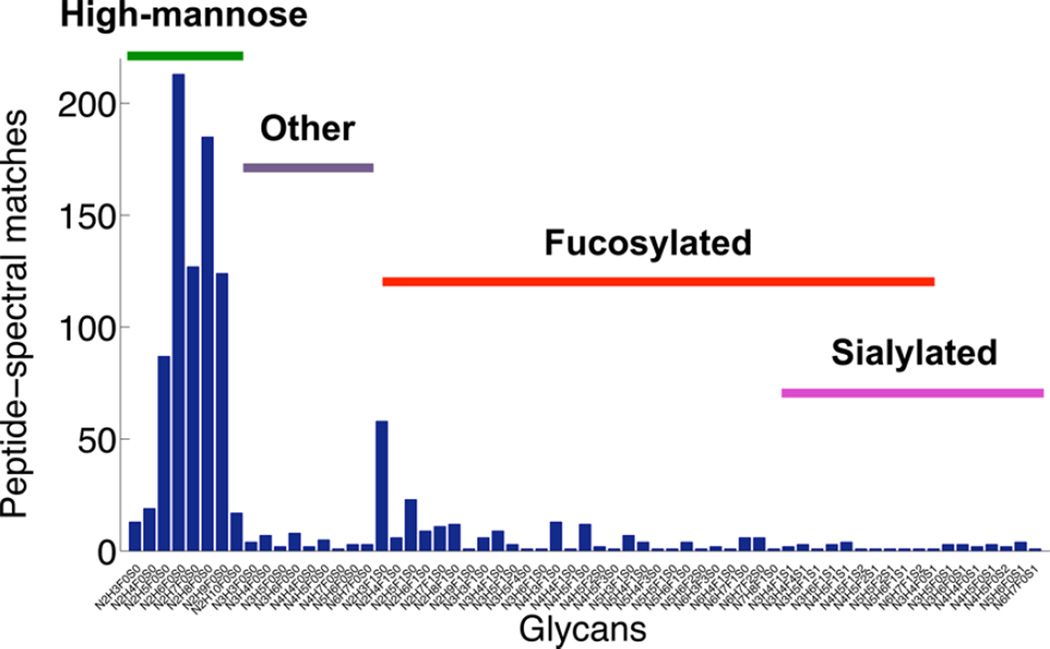
In addition to performing global analysis, using this tool, we can look at the heterogeneity of any glycosite of interest or the glycosylation heterogeneity profile of a sample. Figure 6 shows the distribution of different N-glycan compositions in the LNCaP sample, where each bar shows the number of PSMs that matched to a specific N-linked glycan in the sample. According to the glycan profile of LNCaP cells, they contained high-mannose, fucosylated only, sialylated only, fucosylated and sialylated, and other glycans without fucose and sialic acid in hybrid or complex structures; however, the high-mannose structures were more prevalent. The lower abundance of sialylated glycans could be attributed to instability of sialic acid residues and their loss during sample preparation.35,36,34
Figure 6.
Glycan profile of the LNCaP cells. The number of PSMs pertaining to each glycan is accumulated over all the glycosites. The LNCaP cells contain high-mannose, fucosylated, and sialylated glycans among other N-glycan structures. The high-mannose structures are the most abundant ones identified in the sample, followed by fucosylated glycans. Sialylated glycans are the least abundant structures. Additionally, nonfucosylated, nonsialylated hybrid, and complex N-glycans, marked as others on this figure, were observed in LNCaP cells.
Analysis of Unmatched Glycan Masses in LNCaP Samples
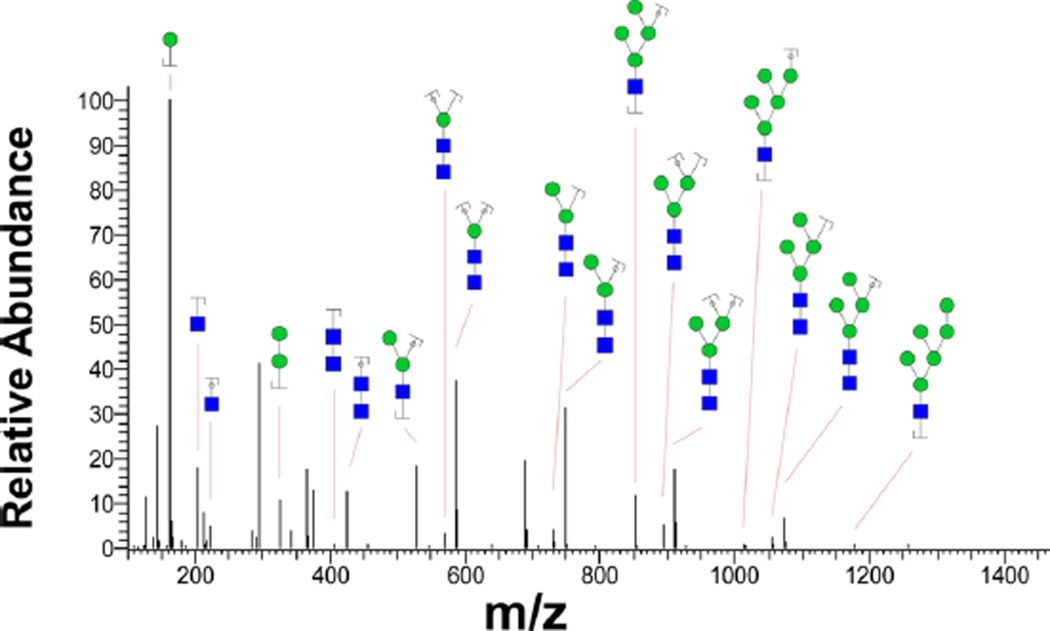
Spectral library matching assigns the peptide portion of the intact glycopeptide to the oxonium-ion-containing MS/ MS spectra, while the decoy strategy ensures the accuracy of the peptide match. The glycan portion is determined by calculating the glycan mass and matching it to the glycan database. Therefore, if the corresponding glycan structure is missing from the glycan database (Supporting Information Table 2), the glycan portion of the glycopeptide remains unspecified. This attribute could potentially lead into discovery of novel glycans or glycan modification. In this analysis, we observed examples of LNCaP glycopeptide MS/MS spectra where the peptide portion of the glycopeptides was assigned to glycosite-containing peptides in the ESL, while the calculated glycan masses were missing from the glycan database. As an example, a minimum of 20 spectra in the glycoproteomics analysis of LNCaP cells resulted in a glycan [M + H]+ mass in a 10 ppm window around 1414.512 Da matching to 15 different glycosites; however, the glycan database match did not result in identification of the glycan portion of the intact glycopeptide. In addition, searching the UniCarbKB37 database for this glycan using the Glycomod tool38 retrieved no matches. To further analyze the unassigned glycan structure, we reinvestigated the MS/MS spectra of LNCaP glycans that had been isolated from the sample and analyzed by HCD LC-MS/MS. Figure 7 depicts the MS/MS spectrum of the glycan corresponding to [M + 2H]2+ mass of 707.76 Da, equivalent to [M + H]+ mass of 1414.512 Da generated through ESI LC-MS/MS analysis of isolated LNCaP glycans on a Q Exactive instrument. The assignment of fragment ions, generated by the Glycoworkbench software,39 to numerous fragmented high-mannose ions suggested that the corresponding unknown glycan was a modified high-mannose structure. In fact, the mass of this glycan is within 10 ppm of a Man6 glycan modified by a moiety with molecular weight of 17.018. This observation, i.e., addition of moiety with a mass of 17.018 Da to a glycan, was observed for Man5, Man7, Man8, and Man9 as well. While an estimated of 700 PSMs matched unmodified high-mannose structures collectively, about 50 PSMs appeared to match modified high-mannose glycans suggesting that around 7% of these structures were modified by an additional 17.018 Da moiety.
Figure 7.
Assignment of modified glycans. MS/MS spectrum of an uncharacterized glycan peak at [M + H]+ of 1414.512 is assigned to glycan fragment ions. Presence of several oxonium ions in the spectrum of the unknown structure ensures that it belongs to a glycan. Also, assignment of numerous peaks to fragments of Man5 and Man6 glycans suggests that the unknown glycan might be a modified high-mannose structure. Even though the MS/MS spectrum of this glycan is not sufficient to accurately determine the structure, the mass of this structure equals that of Man6 modified by a moiety with a mass of 17.018 Da.
DISCUSSION AND CONCLUSION
Assignment of intact glycopeptides to MS/MS spectra of simple and complex biological samples is a challenging task, and several studies have attempted to tackle this challenge. Segu et al. showed that HCD fragmentation of intact glycopeptides resulted in distinct peptide + GlcNAc ions.16 Based on this observation, Mayampurath et al. developed GlypID 2.0, a tool for assignment of glycopeptide to fragmented glycopeptides.22 Nwosu et al. used a combination of accurate precursor mass and the CID-generated fragment ions in MS/MS spectra for assignment of the intact glycopeptides.25 Singh et al. took the HCD product ion-triggered ETD of glycopeptide ions and analyzed the ETD fragmented MS/MS spectra using common proteomics tools by introducing the known glycans in the sample as variable modifications.23 Parker et al. used proteomics and glycomics techniques to first build databases of possible glycans and glycopeptides in the sample and identified the intact glycopeptides by matching their accurate precursor mass to their concatenated glycopeptide database.24 He et al. developed a software tool called GlycoMaster DB for assignment of glycopeptides to HCD/ETD or HCD spectra.26 These algorithms for glycopeptide assignments assign the tandem spectra based on accurate mass of the precursor ion to potential glycopeptides, which rely on the prior identification of both peptides and glycans in the databases.
Spectral matching of HCD fragmented intact glycopeptides to a tandem mass spectral library of glycosite-containing peptides in a complex sample can be used to reliably identify the peptide portion of these glycopeptides, yielding a false discovery rate on the order of 1%. Knowing the peptide portion, the mass of the glycan portion can be calculated by subtracting the peptide mass from the mass of the precursor ion. Therefore, the glycan structure can be characterized by comparing the glycan mass with the glycan database. Due to various factors, the search for glycan structure might not result in a match. Examples include novelty of the glycan, uncharacterized or sample preparation-induced glycan modifications, or errors associated with calculation of the glycan mass. By highlighting these spectra, spectral library matching provides the user with a chance to further investigate those spectra, where despite reliable peptide identification, the glycan structure remains ambiguous. Using this strategy, our data showed the possibility of a novel modification on glycans with a mass of 17.018 Da. Consideration of this modification could lead to identification of more glycans and intact glycopeptides in biological samples. Similar approaches can be used to identify more uncharacterized glycan modifications.
Supplementary Material
Acknowledgments
We thank Dr. Shisheng Sun for great discussions and help with sample preparation. This work was supported in part by the National Institutes of Health under grants and contracts of National Cancer Institute, Clinical Proteomics Tumor Analysis Consortium (U24CA160036), the Early Detection Research Network (EDRN, U01CA152813 and U24CA115102), and R01CA112314; National Heart Lung Blood Institute, Program of Excellence in Glycosciences (P01HL107153), NHLBI Proteomic Center (N01-HV-00240).
Footnotes
ASSOCIATED CONTENT
Supporting Information
Supporting information tables contain the experimental spectral library composed for LNCaP cells, the glycan database used in this study, and the intact glycopeptides identified in LNCaP. The Supporting Information is available free of charge on the ACS Publications website at DOI: 10.1021/acs.analchem. 5b00024.
The authors declare no competing financial interest.
REFERENCES
- 1.Hart GW, Copeland RJ. Cell. 2010;143:672–676. doi: 10.1016/j.cell.2010.11.008. [DOI] [PMC free article] [PubMed] [Google Scholar]
- 2.Varki A, Cummings AJ, Esko JD, Freeze HH, Stanley P, Bertozzi CR, Hart GW, Etzler ME. In: Essentials of Glycobiology. Vjearki A, Cummings RD, Esko JD, Freeze HH, Stanley P, Bertozzi CR, Hart GW, Etzler ME, editors. Woodbury, NY: Cold Spring Harbor Laboratory Press; 2009. [PubMed] [Google Scholar]
- 3.Varki A. Trends. Mol. Med. 2008;14:351–360. doi: 10.1016/j.molmed.2008.06.002. [DOI] [PMC free article] [PubMed] [Google Scholar]
- 4.Durand G, Seta N. Clin. Chem. 2000;46:795–805. [PubMed] [Google Scholar]
- 5.Zhao Y-Y, Takahashi M, Gu J-G, Miyoshi E, Matsumoto A, Kitazume S, Taniguchi N. Cancer Sci. 2008;99:1304–1310. doi: 10.1111/j.1349-7006.2008.00839.x. [DOI] [PMC free article] [PubMed] [Google Scholar]
- 6.Ohtsubo K, Marth JD. Cell. 2006;126:855–867. doi: 10.1016/j.cell.2006.08.019. [DOI] [PubMed] [Google Scholar]
- 7.Schachter H, Freeze HH. Biochim. Biophys. Acta. 2009;1792:925–930. doi: 10.1016/j.bbadis.2008.11.002. [DOI] [PMC free article] [PubMed] [Google Scholar]
- 8.Et B, Acta B. Biochim. Biophys. Acta. 1963;78:379–381. doi: 10.1016/0006-3002(63)91652-4. [DOI] [PubMed] [Google Scholar]
- 9.Kaneko Y, Nimmerjahn F, Ravetch JV. Science. 2006;313:670–673. doi: 10.1126/science.1129594. [DOI] [PubMed] [Google Scholar]
- 10.Turner GA. Clin. Chim. Acta. 1992;208:149–171. doi: 10.1016/0009-8981(92)90073-y. [DOI] [PubMed] [Google Scholar]
- 11.Vogt G, Chapgier A, Yang K, Chuzhanova N, Feinberg J, Fieschi C, Boisson-Dupuis S, Alcais A, Filipe-Santos O, Bustamante J, de Beaucoudrey L, Al-Mohsen I, Al-Hajjar S, Al-Ghonaium A, Adimi P, Mirsaeidi M, Khalilzadeh S, Rosenzweig S, de la Calle Martin O, Bauer TR, Puck JM, Ochs HD, Furthner D, Engelhorn C, Belohradsky B, Mansouri D, Holland SM, Schreiber RD, Abel L, Cooper DN, Soudais C, Casanova J-L. Nat. Genet. 2005;37:692–700. doi: 10.1038/ng1581. [DOI] [PubMed] [Google Scholar]
- 12.Go EP, Chang Q, Liao HX, Sutherland LL, Alam SM, Haynes BF, Desaire H. J. Proteome Res. 2009;8:4231–4242. doi: 10.1021/pr9002728. [DOI] [PMC free article] [PubMed] [Google Scholar]
- 13.Harvey DJ. Expert Rev. Proteomics. 2005;2:87–101. doi: 10.1586/14789450.2.1.87. [DOI] [PubMed] [Google Scholar]
- 14.Zaia J. Chem. Biol. 2008;15:881–892. doi: 10.1016/j.chembiol.2008.07.016. [DOI] [PMC free article] [PubMed] [Google Scholar]
- 15.Zhang H, Li X-J, Martin DB, Aebersold R. Nat. Biotechnol. 2003;21:60–66. doi: 10.1038/nbt827. [DOI] [PubMed] [Google Scholar]
- 16.Segu Z, Mechref Y. Rapid Commun. Mass Spectrom. 2010;24:1217–1225. doi: 10.1002/rcm.4485. [DOI] [PubMed] [Google Scholar]
- 17.Wuhrer M, Catalina MI, Deelder AM, Hokke CH. J. Chromatogr. B: Anal. Technol. Biomed. Life Sci. 2007;849:115–128. doi: 10.1016/j.jchromb.2006.09.041. [DOI] [PubMed] [Google Scholar]
- 18.Mechref Y. Curr. Protoc. Protein Sci. 2012 doi: 10.1002/0471140864.ps1211s68. [DOI] [PMC free article] [PubMed] [Google Scholar]
- 19.Chandler KB, Pompach P, Goldman R, Edwards N. J. Proteome Res. 2013;12:3652–3666. doi: 10.1021/pr400196s. [DOI] [PMC free article] [PubMed] [Google Scholar]
- 20.Yang W, Shah P, Toghi Eshghi S, Yang S, Sun S, Ao M, Rubin A, Jackson JB, Zhang H. Anal. Chem. 2014;86:6959–6967. doi: 10.1021/ac500876p. [DOI] [PMC free article] [PubMed] [Google Scholar]
- 21.Hart-Smith G, Raftery MJ. J. Am. Soc. Mass Spectrom. 2012;23:124–140. doi: 10.1007/s13361-011-0273-y. [DOI] [PubMed] [Google Scholar]
- 22.Mayampurath AM, Wu Y, Segu ZM, Mechref Y, Tang H. Rapid Commun. Mass Spectrom. 2011;25:2007–2019. doi: 10.1002/rcm.5059. [DOI] [PubMed] [Google Scholar]
- 23.Singh C, Zampronio CG, Creese AJ, Cooper HJ. J. Proteome Res. 2012;11:4517–4525. doi: 10.1021/pr300257c. [DOI] [PubMed] [Google Scholar]
- 24.Parker BL, Thaysen-Andersen M, Solis N, Scott NE, Larsen MR, Graham ME, Packer NH, Cordwell SJ. J. Proteome Res. 2013;12:5791–5800. doi: 10.1021/pr400783j. [DOI] [PubMed] [Google Scholar]
- 25.Nwosu CC, Seipert RR, Strum JS, Hua SS, An HJ, Zivkovic AM, German BJ, Lebrilla CB. J. Proteome Res. 2011;10:2612–2624. doi: 10.1021/pr2001429. [DOI] [PMC free article] [PubMed] [Google Scholar]
- 26.He L, Xin L, Shan B, Lajoie GA, Ma B. J. Proteome Res. 2014;13:3881–3895. doi: 10.1021/pr401115y. [DOI] [PubMed] [Google Scholar]
- 27.Hua S, Nwosu CC, Strum JS, Seipert RR, An HJ, Zivkovic AM, German JB, Lebrilla CB. Anal. Bioanal. Chem. 2012;403:1291–1302. doi: 10.1007/s00216-011-5109-x. [DOI] [PubMed] [Google Scholar]
- 28.Strum JS, Nwosu CC, Hua S, Kronewitter SR, Seipert RR, Bachelor RJ, An HJ, Lebrilla CB. Anal. Chem. 2013;85:5666–5675. doi: 10.1021/ac4006556. [DOI] [PMC free article] [PubMed] [Google Scholar]
- 29.Tian Y, Zhou Y, Elliott S, Aebersold R, Zhang H. Nat. Protoc. 2007;2:334–339. doi: 10.1038/nprot.2007.42. [DOI] [PMC free article] [PubMed] [Google Scholar]
- 30.Elias J, Gygi S. Nat. Methods. 2007:4. doi: 10.1038/nmeth1019. [DOI] [PubMed] [Google Scholar]
- 31.Aldredge D, An HJ, Tang N, Waddell K, Lebrilla CB. J. Proteome Res. 2012;11:1958–1968. doi: 10.1021/pr2011439. [DOI] [PMC free article] [PubMed] [Google Scholar]
- 32.Stumpo KA, Reinhold VN. J. Proteome Res. 2010;9:4823–4830. doi: 10.1021/pr100528k. [DOI] [PMC free article] [PubMed] [Google Scholar]
- 33.Yang S, Li Y, Shah P, Zhang H. Anal. Chem. 2013;85:5555–5561. doi: 10.1021/ac400761e. [DOI] [PMC free article] [PubMed] [Google Scholar]
- 34.Shah P, Yang S, Sun S, Aiyetan P, Yarema KJ, Zhang H. Anal. Chem. 2013;85:3606–3613. doi: 10.1021/ac3033867. [DOI] [PMC free article] [PubMed] [Google Scholar]
- 35.Harvey DJ. Mass Spectrom. Rev. 1999;18:349–450. doi: 10.1002/(SICI)1098-2787(1999)18:6<349::AID-MAS1>3.0.CO;2-H. [DOI] [PubMed] [Google Scholar]
- 36.Wheeler SF, Domann P, Harvey DJ. Rapid Commun. Mass Spectrom. 2009;23:303–312. doi: 10.1002/rcm.3867. [DOI] [PubMed] [Google Scholar]
- 37.Campbell MP, Peterson R, Mariethoz J, Gasteiger E, Akune Y, Aoki-Kinoshita KF, Lisacek F, Packer NH. Nucleic Acids Res. 2014;42:D215–D221. doi: 10.1093/nar/gkt1128. [DOI] [PMC free article] [PubMed] [Google Scholar]
- 38.Cooper C, Gasteiger E, Packer N. Proteomics. 2001;1:340–349. doi: 10.1002/1615-9861(200102)1:2<340::AID-PROT340>3.0.CO;2-B. [DOI] [PubMed] [Google Scholar]
- 39.Ceroni A, Maass K, Geyer H. J. Proteome Res. 2008;7:1650–1659. doi: 10.1021/pr7008252. [DOI] [PubMed] [Google Scholar]
Associated Data
This section collects any data citations, data availability statements, or supplementary materials included in this article.


