Abstract
Accurate segmentation of pulmonary nodules is a prerequisite for acceptable performance of computer-aided detection (CAD) system designed for diagnosis of lung cancer from lung CT images. Accurate segmentation helps to improve the quality of machine level features which could improve the performance of the CAD system. The well-circumscribed solid nodules can be segmented using thresholding, but segmentation becomes difficult for part-solid, non-solid, and solid nodules attached with pleura or vessels. We proposed a segmentation framework for all types of pulmonary nodules based on internal texture (solid/part-solid and non-solid) and external attachment (juxta-pleural and juxta-vascular). In the proposed framework, first pulmonary nodules are categorized into solid/part-solid and non-solid category by analyzing intensity distribution in the core of the nodule. Two separate segmentation methods are developed for solid/part-solid and non-solid nodules, respectively. After determining the category of nodule, the particular algorithm is set to remove attached pleural surface and vessels from the nodule body. The result of segmentation is evaluated in terms of four contour-based metrics and six region-based metrics for 891 pulmonary nodules from Lung Image Database Consortium and Image Database Resource Initiative (LIDC/IDRI) public database. The experimental result shows that the proposed segmentation framework is reliable for segmentation of various types of pulmonary nodules with improved accuracy compared to existing segmentation methods.
Keywords: Lung cancer, Segmentation of pulmonary nodule, Pleural surface removal, Vasculature pruning technique, Jaccard index, Modified Hausdroff distance, Lung Image Database Consortium and Image Database Resource Initiative (LIDC/IDRI)
Introduction
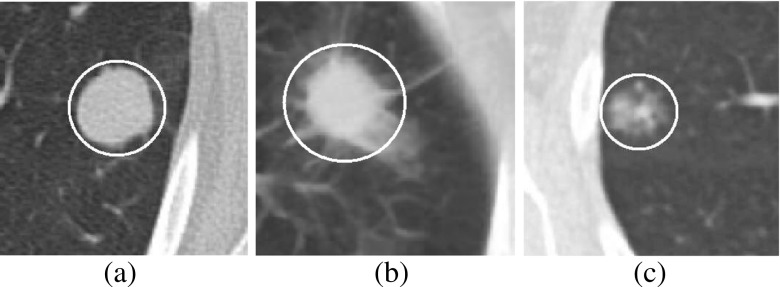
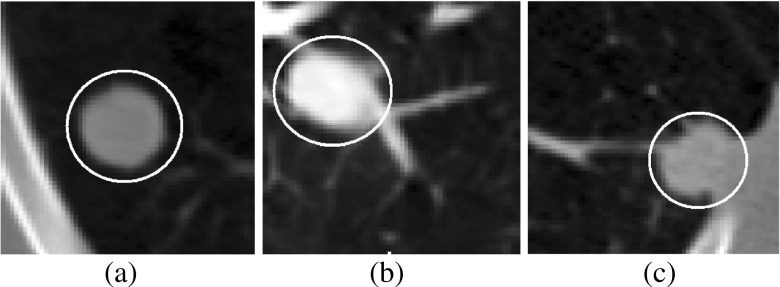
Lung cancer is the primary cause of cancer-related death in USA [21]. Pulmonary nodules are early indication of lung cancer and appear as round or oval opacity in lung CT images [11]. The internal texture of pulmonary nodules can be solid, part-solid, and non-solid as shown in Fig. 1. The solid nodules completely obscure the entire lung parenchyma within it. The non-solid nodules refer to focal nodular opacity with hazy increase in attenuation and do not obscure the underlying parenchymal structure including vessels and airways. The part-solid nodules are the combination of solid and non-solid nodules and show large variations of intensity within it. Based on external attachment, pulmonary nodules can be categorized into well-circumscribed, juxta-vascular, and juxta-pleural [12] as shown in Fig. 2.
Fig. 1.
Pulmonary nodules based on internal texture: a solid, b part-solid, and c non-solid
Fig. 2.
Pulmonary nodules based on external attachment: a well-circumscribed, b juxta-vascular, and c juxta-pleural
Segmentation of pulmonary nodules is a prerequisite step in the development of a CAD system for diagnosis of lung cancer. Segmentation of pulmonary nodules with a minimal amount of user interaction is desired for robust and efficient CAD system design. The performance of segmentation method depends on the correctness of removal of pleural surface and blood vessels attached with it. Most of the reported works focus on segmentation of solid nodules [5–7, 12, 14, 17, 19]. Few methods are reported on segmentation of non-solid nodules [24, 25], and only one method is reported on segmentation of solid, part-solid, and non-solid nodules [13]. Hensckle et al. [8] reported that part-solid and non-solid nodules have high risk of malignancy compared to solid nodules. Many technical issues like design of a general segmentation framework for various types of nodules and quantitative evaluation of segmentation results are still left.
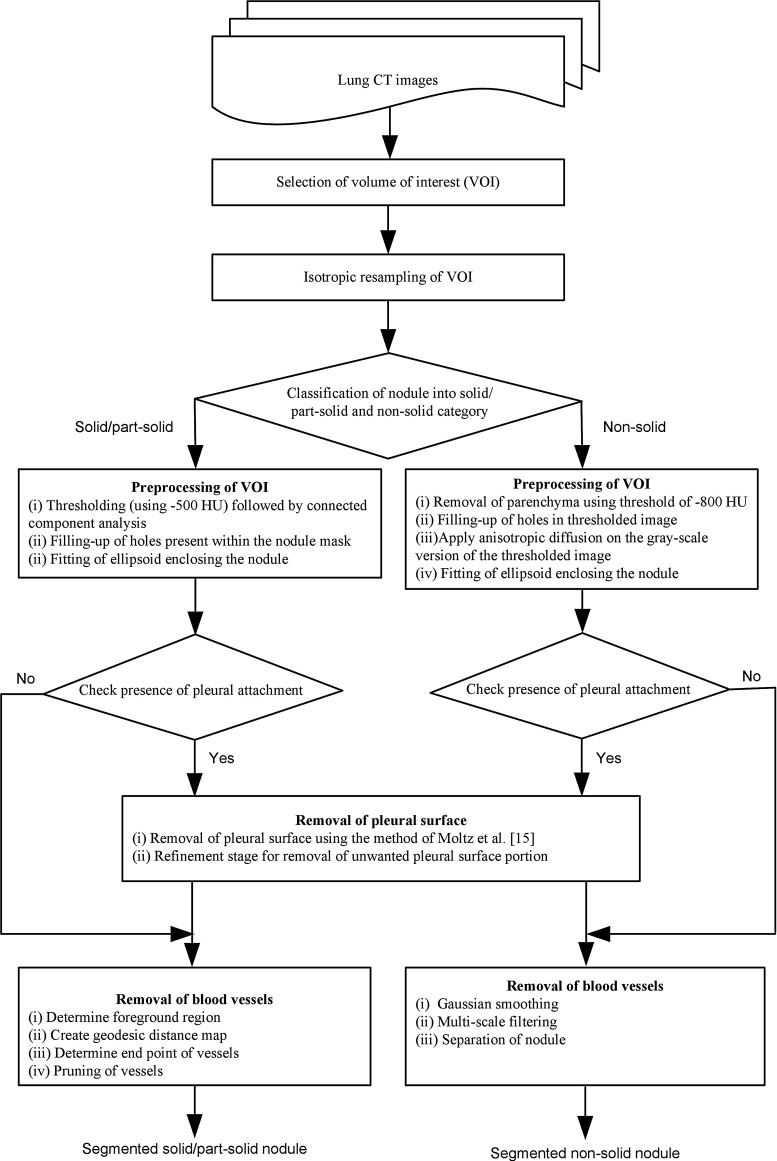
In this paper, a robust segmentation framework is proposed for solid, part-solid, and non-solid nodules. The proposed segmentation method is applicable for nodules of the wide range of size (3–30 mm). The non-solid nodules are very different from the solid nodules, based on shape, pattern, and boundary. Therefore, the segmentation algorithm developed for solid/part-solid nodules are not applicable for non-solid nodules. Hence, in the proposed framework, pulmonary nodules are classified into solid/part-solid and non-solid categories based on the analysis of intensity distribution of core of the nodule, and separate segmentation method is set for each category. The main parts of two segmentation techniques applicable for solid/part-solid and non-solid nodules are extraction of foreground region, removal of pleural attachment, and removal of vascular attachment. The idea of removal of pleural attachment is borrowed from Kuhnigk et al. [14]. A vasculature pruning technique is proposed for removal of blood vessels from solid/part-solid nodules. Selective enhancement filtering and adaptive thresholding is proposed for removal of vessels from non-solid nodule. The quantitative results of proposed segmentation method and few state-of-the-art methods are reported.
The paper arrangements are as follows: “Reported Works on Segmentation of Pulmonary Nodules” describes the reported works on segmentation of pulmonary nodules, “Materials and Methods” describes proposed segmentation framework, “Performance Metric for Evaluation of Segmentation Results” deals with various performance metric required for evaluation of segmentation result, and “Results” describes the results of segmentation result and “Discussion” focuses on discussion. In the last section, “Conclusion,” conclusion and future scope of improvement are stated.
Reported Works on Segmentation of Pulmonary Nodules
Segmentation of Solid Pulmonary Nodules
Kostis et al. [12] applied iterative morphological filtering to segment solid pulmonary nodules by removing vessel-like structure. The orientation of pleural surface is determined and a disk-shaped kernel is generated parallel to pleural surface of appropriate size such that an opening operation using this kernel can be used to remove the majority of pleural surface while excluding the nodule. The process is performed in an iterative way until pleural surface is removed. The main difficulty for the morphological method is to decide a suitable kernel size to deal with the trade-off between removing the adjacent vessel and retaining the boundary of the nodule. An iterative dilation algorithm using subsequently decreasing kernel sizes was applied to retain the boundary of the nodule. In this process of iterative morphological opening operation, the micro-lobules or spicules are lost.
Reeves et al. [19] developed a plane fitting technique for pleural surface removal. A plane is constructed through the center of the nodule and normal to direction d, where d is the direction toward the pleural surface from the center of nodule. The plane is moved toward the pleural surface and jump in increment of volume is used to detect pleural attachment within the volume of interest (VOI). As lung field has higher curvature in the region of mediastinum and diaphragm compared to chest wall, the plane fitting technique provides poor result for the nodules, deeply attached with mediastinum or diaphragm. Kuhnigh et al. [14] developed a pleural surface removal technique by means of convex hull of the lung parenchyma within the VOI. This method is based on an assumption that lung field are mostly convex. This technique works fine for the nodules attached with chest wall but produces lots of false positive for the nodules attached with mediastinum or diaphragm due to the inclusion of pleural surface. Moltz et al. [17] improved the segmentation algorithm of Kuhnigh et al. [14] using ellipsoidal approximation of nodule. The segmentation accuracy is improved by minimizing the size of the VOI, using ellipsoid containing the lung nodule. The boundary of the ellipsoidal is identified using ray casting technique. Then, pleural surface is removed using the method of Kuhnigh et al. [14]. The vascular attachments are removed using an adaptive opening operation for both the method of Kuhnigh [14] and Moltz et al. [17].
Dehmeshki et al. [5] developed an user-interactive segmentation framework using 3D region growing on the fuzzy connectivity map to segment pulmonary nodules. The steps are extraction of foreground, relocation of the seed point, creation of fuzzy connectivity map, and 3D region growing, considering second order connectivity, i.e., 26 neighborhood. An optimum seed point was determined using the distance transformation of foreground. Then, a fuzzy connectivity map was constructed, depending on the affinity between the seed point and the particular voxel. The fuzzy map was used for region growing process for the final segmentation. The results were evaluated by radiologists, who considered about 84 % of them acceptable. No quantitative performance measures were presented. Diciotti et al. [7] also developed a semi-automated segmentation technique using 3D region growing based on gray-level similarity and shape of objects. The initial segmentation results are provided to the operator to confirm each pulmonary structure picked by the algorithm as a correct detection or to discard it. The knowledge of an expert is thus introduced into the algorithm through a controlled user intervention. This segmentation method was only validated on small nodules of mean diameter 5–11 mm.
Diciotti et al. [6] developed an automated segmentation refinement of small juxta-vascular solid nodules, based on 3D local shape analysis without any user interaction. The correction procedure refines an initial nodule segmentation in order to separate possible vessels from the nodule. The method has the advantage that the correction is locally applied along vessel attachments leading to unaltered nodule boundary. This method is fully focused only on small nodules (<10 mm), and segmentation results for nodules with larger diameter (>10 mm) are not reported.
Segmentation of Non-Solid Pulmonary Nodules
Zhou et al. [25] developed a segmentation method considering a non-parametric density estimation and likelihood map based on the texture of non-solid nodule. The attached blood vessels were removed based on the eigenvalue value analysis of Hessian matrix. Their algorithm was tested on 10 non-solid nodules, and no quantitative segmentation results were reported. Tao et al. [24] developed a segmentation technique based on the determination of voxel-based probability map followed by multiscale blob enhancement filter. The technique is applied on each voxel to obtain a volumetric blobness likelihood map. The voxel-based probability map and volumetric blobness likelihood map are multiplied to obtain another probability map called shape prior refined probability map. It helps to suppress spurious responses and emphasize blob-like structures. The algorithm was tested on 20 non-solid nodule and reported average volumetric overlap is 0.68.
Segmentation of Solid, Part-Solid, and Non-Solid Pulmonary Nodules
Kubota et al. [13] developed a nodule segmentation method considering the convexity models of nodules. The segmentation algorithm is applicable for nodules of various density like solid, part-solid, and non-solid. The performance of the technique is quantitatively evaluated in terms of segmentation overlap on two data set LIDC1 and LIDC2 consisting of 23 and 82 nodules, respectively, from LIDC database [16]. Among 23 nodules in LIDC1, 22 have slice thickness of 0.66 mm. The mean and standard deviation of the volumetric overlap for LIDC1 were reported as 0.69 and 0.18, respectively. In the case of LIDC2, the mean and standard deviation of the volumetric overlap were reported as 0.59 and 0.19, respectively. TThe cause of relatively less value of the volumetric overlap in LIDC2 is higher slice thickness. In LIDC2 73 nodules out of 82 have slice thickness more than 1.25 mm. Moreover, LIDC2 contains few nodules which are extremely subtle in nature.
Materials and Methods
Database of Lung CT Images
The proposed segmentation method is evaluated on 891 nodules in Lung Image Database Consortium and Image Database Resource Initiative (LIDC/IDRI) public database [2]. In LIDC/IDRI database, 928 lesions are annotated by all four radiologists [2]. Out of 928 nodules, the boundary annotation by all four radiologists is available for 891 nodules. Hence, the proposed segmentation algorithm was evaluated on 891 nodules. The boundaries of the pulmonary nodules are annotated by all four radiologists based on consensus among the radiologists. The boundary information and various diagnostic information for all nodules for a particular subject are provided in XML file. Each CT image slice consists of a matrix size of 512×512 pixels, and the pixel size ranges from 0.5 to 0.8 mm with a 12-bit gray scale in HU. A set of four ground truth is created by filling the internal region of annotated nodule, slice by slice. In LIDC/IDRI, the nodules with texture index 1 are considered as non-solid, texture index 2 or 3 are considered as part-solid, and texture index 4 or 5 are considered as solid.
Segmentation Framework of Pulmonary Nodules
The block diagram of proposed segmentation framework is provided in Fig. 3. The operator selects a seed point by a mouse click on the pulmonary nodule in the first step. A cubic VOI of size (40 mm × 40 mm × 40 mm) is selected, enclosing the nodule. The CT images often provide anisotropic voxels. Isotropic resampling is applied on the VOI for voxel equalization. In proposed segmentation framework of pulmonary nodules, solid and part-solid are grouped in one category and non-solid in another category. In the next step, the pulmonary nodules are classified into solid/part-solid or non-solid based on the analysis of intensity distribution in the core of nodule. Finally, depending on the class level of pulmonary nodules (solid/part-solid or non-solid) corresponding algorithm is set for segmentation.
Fig. 3.
Proposed framework for segmentation of pulmonary nodules
Classification of Pulmonary Nodule into Solid/Part-Solid and Non-Solid
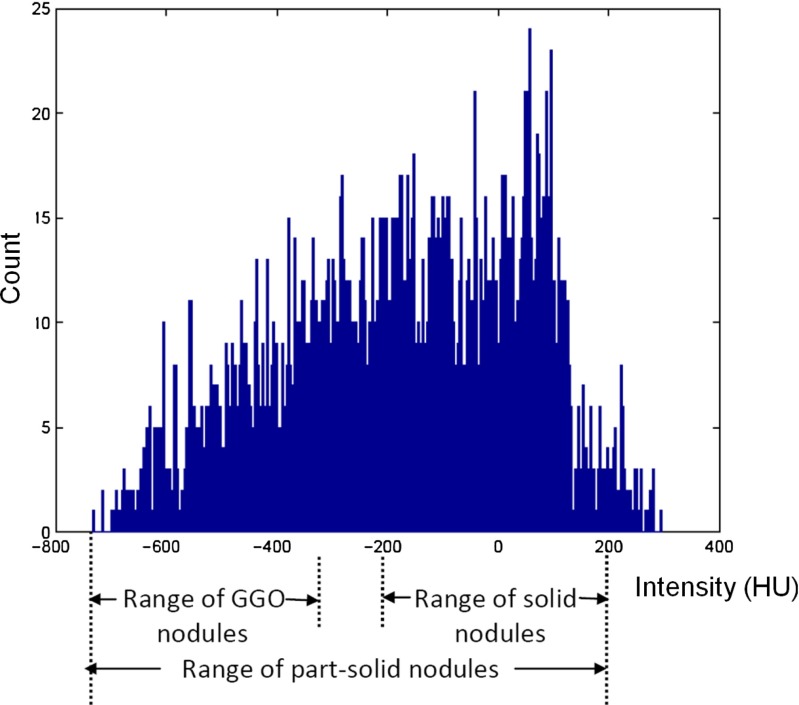
The classification of pulmonary nodules into solid/part-solid and non-solid is performed based on the texture analysis of the core of nodule. Kauczor et al. [10] reported that the density distribution of non-solid nodules lies in the range of [ −750 HU, −300 HU]. The density distribution of solid pulmonary nodules lies in the range of [ −200 HU, 200 HU] [19]. Part-solid nodules are the mixture of solid and non-solid tissue component [10]. The density distribution for a sample part-solid pulmonary nodule is given in Fig. 4. The histogram plot shows that the density distribution for sample part-solid pulmonary nodule has range from −733 HU to 295 HU. So, there is an overlap of internal attenuation of part-solid pulmonary nodules with solid and non-solid nodule. Due to the overlap of internal attenuation, intensity-based thresholding is not enough to classify pulmonary nodules into solid/part-solid and non-solid category. Hence, intensity-based features are extracted from the core of the nodule. The inscribed spherical region within the nodule is considered as the core of the nodule.
Fig. 4.
Histogram of part-solid nodule
To extract the core of nodule, VOI is thresholded at −800 HU because minimum attenuation for non-solid nodules is −750 HU [10]. The approximate boundary points of the lung nodule are identified using ray casting technique. Starting from the user given seed point, rays are traced out through all the surface voxel of a (5×5×5) cube until the rays reach either the boundary of the nodule, or the boundary of the VOI. The distance of the nearest boundary point from the seed point is denoted by d. The spherical region with center as seed point and diameter as d is considered as the core of the nodule. Several features like mean intensity, variance of intensity, entropy, skewness, kurtosis, solid part, and non-solid part are computed from the core of nodule. The solid part is the ratio of voxel count in the range [ −200 HU, 200 HU] and total number of voxel in the range of [ −750 HU, 200 HU]. The non-solid part is the ratio of voxel count in the range of [ −750 HU, −300 HU] and total number of voxel in the range of [ −750 HU, 200 HU]. The value of the area under curve (AUC) for a particular feature is obtained from receiver operator characteristics (ROC) during classification of pulmonary nodules into solid/part-solid and non-solid category for the data sets D1 and D2 [see section “Description of Training and Test Data Set” for the composition of D1 and D2]. The values of the AUC for various features are given in Table 1. The most relevant feature are identified by considering the maximum AUC. The feature, non-solid part provide the highest value of AUC. Hence, this single feature is considered for classifying the pulmonary nodules.
Table 1.
List of texture features considering AUC for data set D1 and D2. The entries are italicized to represent the highest value of AUC for each column.
| Feature no. | Feature name | AUC for D1 | AUC for D2 |
|---|---|---|---|
| 1 | Mean intensity | 0.93 | 0.86 |
| 2 | Variance of intensity | 0.94 | 0.81 |
| 3 | Entropy | 0.69 | 0.62 |
| 4 | Skewness | 0.86 | 0.79 |
| 5 | Kurtosis | 0.51 | 0.52 |
| 6 | Solid part | 0.82 | 0.75 |
| 7 | Non-solid part | 0.98 | 0.92 |
Preprocessing of VOI
A. Preprocessing of VOI containing solid/part-solid nodules
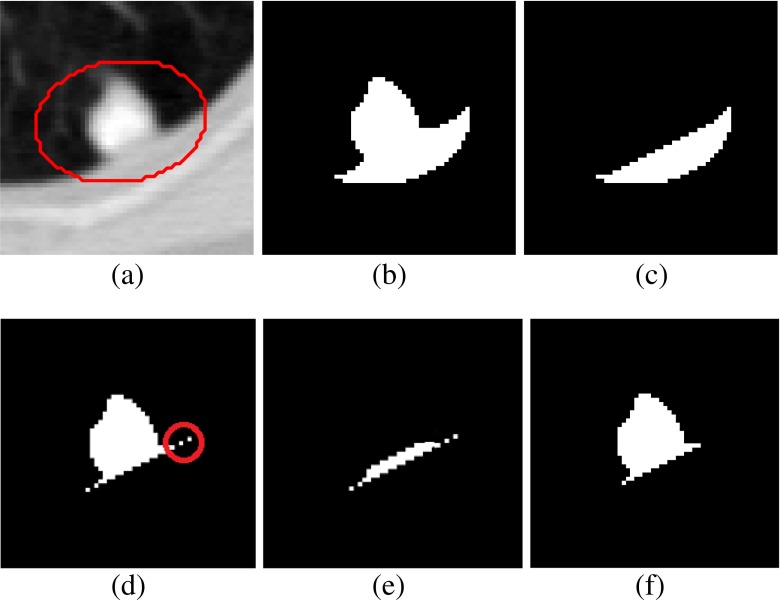
In the case of solid/part-solid nodule, VOI is thresholded at −500 HU to separate the nodule from lung parenchyma. The connected component analysis is performed to obtain the object containing nodule. Sometimes, the nodules contain holes within it. The holes present in the nodule is filled up using morphological closing operation. Then, ellipsoid is fitted enclosing the nodule using the method of Moltz et al. [17]. Moltz et al. restricted the VOI using ellipsoid fitting technique for juxta-pleural solid nodules. In the current work, the task of fitting of ellipsoid is extended to all types of nodules irrespective of attachment to reduce computation time, as well as false positive. The approximate boundary of the lung nodules is identified using ray casting technique. Starting from the user given seed point, rays are traced through all the surface voxel of a (5×5×5) cube around the seed point, until the rays reach either the boundary of the nodule or the boundary of the VOI. The points which are located on the boundary of nodule (well-circumscribed and juxta-vascular cases) are used for fitting the bounded ellipsoid around the nodules. In the case of juxta-pleural nodules, few boundary points of pleura will appear in the list of boundary points of nodule because of connectivity of nodule with pleura. Hence, the boundary points located on the boundary of pleura need to be eliminated from the list of boundary points of nodule obtained by tracking ray endpoints. The points below a certain distance from the seed points are considered for fitting the bounded ellipsoid around the nodule (Fig. 5a). The 95th percentile of the distances of all the estimated boundary points provides a good threshold for selecting the boundary points of nodule [17]. The binary mask of the nodule attached with pleural surface is shown in Fig. 5b.
Fig. 5.
Description of pleural surface removal using one juxta-pleural nodule: a One slice in the VOI containing juxta-pleural nodule bounded by ellipsoid, b binary mask of the nodule attached with pleura, c binary mask of removed pleural surface using convex-hull operation as suggested by Kuhnigh et al., d binary mask of nodule obtained after pleural surface removal using the method of Moltz et al., e part of the nodule mask along with small portion of pleura, and f binary mask of nodule after proposed refinement stage applied on (e)
B. Preprocessing of VOI containing non-solid nodules
The non-solid nodules are very different from solid/part-solid nodule based on internal texture. Hence, threshold-based approach is inadequate to separate it from the background. In the first step of preprocessing of VOI containing non-solid nodule, the lung parenchyma is removed using the threshold of −800 HU which is well below minimum attenuation for non-solid nodule (−750 HU [10]). The connected component analysis is performed to obtain the object containing nodule. In the next step, anisotropic diffusion filter is applied on the gray scale version of the thresholded image. The value of the parameters like conductance, number of iteration, and time step are 2, 10, and 0.0625, respectively [18]. The holes present in the nodule is filled. Finally, the ellipsoid is fitted enclosing the non-solid nodule using the method of Moltz et al. [17] as described in the previous paragraph.
Checking the Presence of Pleural Attachment for Solid/Part-Solid and Non-Solid Nodules
The existence of pleural attachment is determined using the method of Kuhnigk et al.[14]. The overlap of boundary voxels of the segmented object (as obtained in “Preprocessing of VOI”) with the boundary voxels of VOI more than 10 % indicates the presence of pleural attachment with pulmonary nodules [14]. Once presence of pleural attachment is identified, it is removed using the method of Moltz et al. [17] followed by proposed refinement step.
Removal of Pleural Surface for Solid/Part-Solid and Non-Solid Nodules
The procedure of removal of pleural attachment is same for solid/part-solid and non-solid nodules. The pleural surface is efficiently removed by limiting the VOI in an ellipsoid around the nodule which leads to less inclusion of pleural surface within the VOI. The pleural surface removal technique of Kuhnigh et al. [14] is applied in the ellipsoid VOI. Kuhnigh et al. considered that lung fields are mostly convex, and the juxta-pleural nodules creates a concavity in its shape. The convex hull of the lung parenchyma within the bounded ellipsoid is used to mask out the chest wall part from the VOI. The binary mask of the removed pleural surface is shown in Fig. 5c. The binary mask of the nodule after the removal of pleural surface is shown in Fig. 5d. After the removal of pleural surface using the method of Kuhnigh et al. [14], few small portion of pleural surface still remains as shown using red circle in Fig. 5e. Both of the existing methods of Kuhnigh et al. and Moltz et al. applied morphological opening to remove the blood vessels. So, the remaining portions of pleural surface were removed during morphological opening. In the proposed segmentation framework, vasculature pruning technique is applied instead of morphological opening. To remove these small parts, a refinement step is proposed near the region of attachment of nodule and pleura.
Refinement step
In the first step, the pixels adjacent to pleura are identified. To accomplish it, the morphological dilation is applied on the removed pleural surface (Fig. 5c) using a disk shape structuring element of radius 3 pixels. The intersection of the dilated pleural surface with segmented nodule obtained in the earlier step (discussed in Removal of Pleural Surface for Solid/Part-Solid and Non-Solid Nodules) will produce the image containing part of the nodule along with small portion of pleura (Fig. 5e). Then, the small isolated portions of pleural surface (area less than 5 pixels) are removed. This procedure will not erode the part of the nodule because its size is bigger than 5 pixels. As the refinement step is limited in the region adjacent to the pleura, the rest of the nodule will not be affected in any way by the refinement step. The image after refinement step is given in Fig. 5f.
Removal of Blood Vessels
A. Removal of blood vessels for solid/part-solid nodules
A vasculature pruning technique is proposed for the removal of vasculature from the region of attachment for solid/part-solid nodules. From the anatomical point of view, juxta-vascular nodules have limited portion of the nodule boundary that is attached to the vessels. Moreover, vessels attached to nodules are longer in structure than typical nodule boundary irregularities. The main objective of proposed vasculature pruning technique is to remove attached vessels from the nodule. In this technique, the vessels are tracked along its path and removed from the region of attachment. The schematic diagram for vasculature pruning is shown in Fig. 6, and details of algorithm are described below.
Fig. 6.
Schematic diagram for vasculature pruning: a juxta-vascular nodules (shaded region indicates vessel), b removal of vessel in iteration-1, c removal of vessel in iteration-2, d removal of vessel in iteration-3, and e nodule after complete removal of vessel
Algorithm for Vasculature Pruning Technique
- Step 1
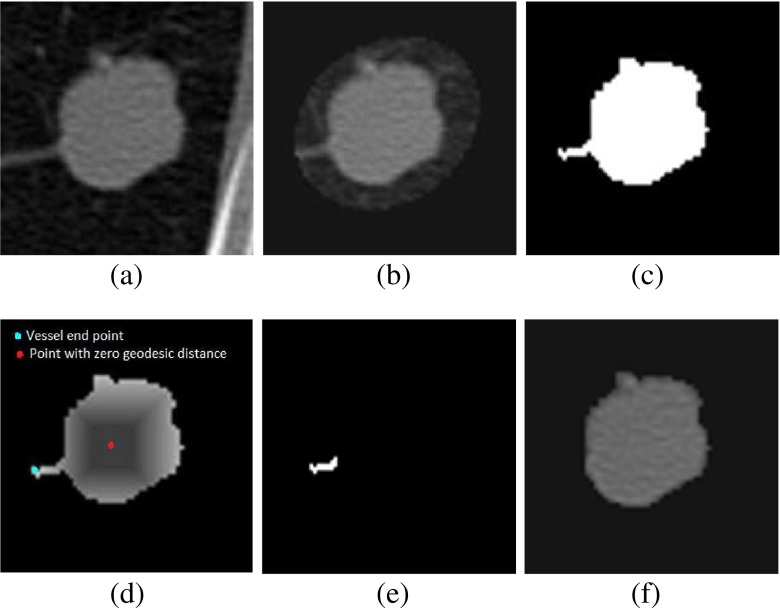
Determine foreground region In case of juxta-pleural nodules, the region obtained after removal of pleural surface is termed as foreground region (F). The foreground region (F) for well-circumscribed and juxta-vascular nodules is obtained by threshold-based segmentation [ −500 HU as threshold], followed by connected component analysis and filling up of holes present in nodule. To reduce the computational overhead, an ellipsoid is fitted, enclosing the juxta-vascular or juxta-vascular nodules using the method of Moltz et al. [17] as shown in Fig. 7b. The four ground region is shown in Fig. 7c.
- Step 2
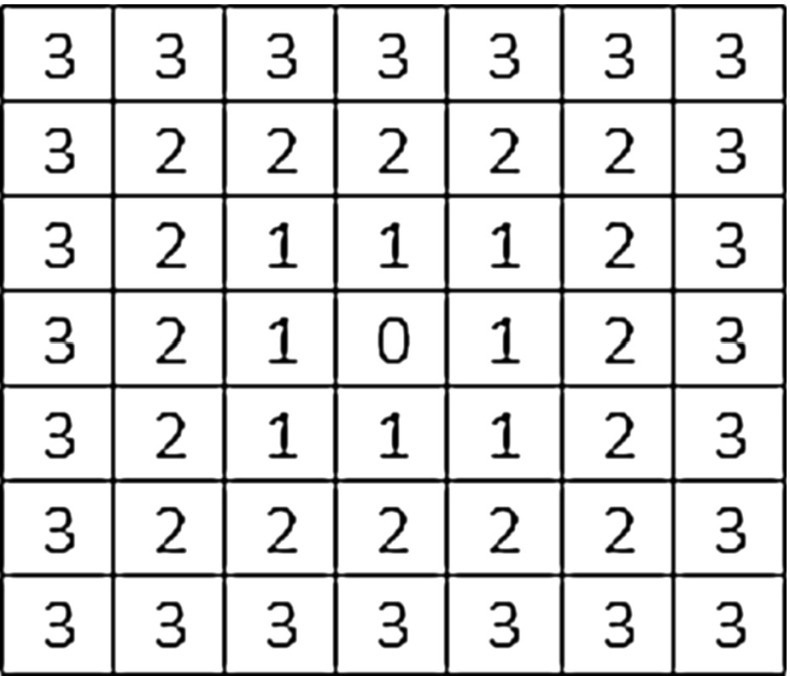
Create geodesic distance map The centroid ‘S’ of the F is determined and it will be considered as seed point for computing geodesic distance map. A 3D geodesic distance (GD) maps of F is computed considering zero geodesic distance at S and increasing geodesic distance toward the boundary of F as shown in Fig. 7d. It will help to find out the vessel end point in the VOI because geodesic distance has higher value at vessel end point compare to nodule body. The schematic diagram for computing GD in 2D is given in Fig. 8, considering center pixel as zero geodesic distance. In case of computing 3D geodesic distance, 26-neighbors of S are considered. All voxels which are 26-neighbors of S will have geodesic distance 1 voxel. Thus, geodesic distances of all voxels of the F with respect to S can be computed by incrementally growing the region from S.
- Step 3
- Determine the end point of vessel In order to trace the end point of vessel (Fig. 7d), a voxel transformation is proposed. For implementing this voxel transformation, a term voxel density (VD) is introduced. VD is computed as the ratio of number of foreground voxel in its (9×9×9) neighbor and the total number of voxel contained in the cube of size (9×9×9). In the method of voxel transformation, each voxel will be assigned with a new value as given in Eq. 1. The voxel transformed map F1 is defined by
where p represents the coordinates of a particular voxel and GD is the geodesic distance. In voxel transformed map F1, the vessel end point will have higher value compared to nodule body as GD has higher value and VD has lower value at vessel end point. The magnitude of all the surface voxels in F1 is noted. It is experimentally found that the magnitude of surface voxels more than 98th percentile of the magnitudes of all the surface voxels represents the end point of vessels.1 - Step 4
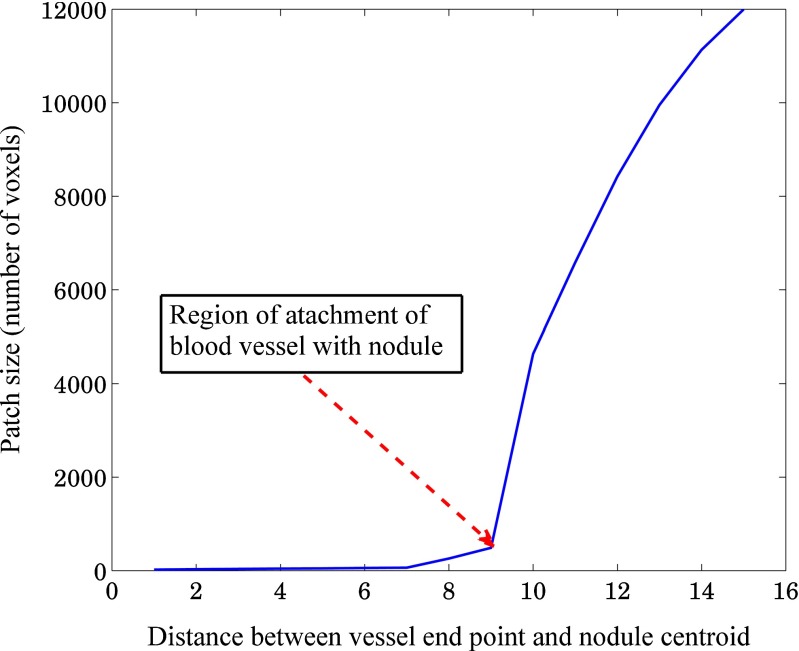
- Pruning of vessels Start from the end point of a particular vessel and traverse along the vessel until nodule-vessel junction is reached. The region of attachment is determined by analyzing the consecutive patch size (in terms of voxel count), obtained by decreasing geodesic distance of step size 1 [Fig. 9]. The location of nodule-vessel junction (Lknee) can be represented as
where i represents the number of iteration. Thus, particular vessel will be removed from the region of attachment as shown in Fig. 7e. Repeating the same procedure for all blood vessels, the segmented nodule (Fig. 7f) will be obtained. The regions having patch length greater than four times of voxel dimension (resolution along x-dimension or y-dimension or z-dimension) are considered as vessel and removed using vasculature pruning technique. This criteria is taken into account to restrict the unwanted removal of spicules present in nodule.2
Fig. 7.
Vasculature pruning technique: a juxta-vascular nodule, b nodule enclosed by dilated ellipsoid, c nodule after thresholding and connected component analysis, d geodesic distance transformation of (c), e removed vessel, and f nodule after vessel removal
Fig. 8.
Geodesic distance of pixels from the center using norm
Fig. 9.
Plot of the size of the patches belonging to a vessel path with respect to the distance from the vessel end point
B. Removal of blood vessels for non-solid nodules
The appearances of non-solid nodules on CT images are very different from the solid nodules based on its shape, pattern, and boundary. Hence, the algorithm developed for vasculature removal from solid nodule will not be applicable to non-solid nodules. Selective enhancement filtering is applied in the ellipsoid VOI for removal of vessels by enhancing the blob-like structure and suppressing the vessel like structures. It works on the property of the eigenvalues of the Hessian matrix, calculated at each voxel. The sign and ratio of eigenvalues are considered as the signature of structures [15]. Three idealized basic shapes in 3D image space are dot, line, and plane. The blob-like structure is represented by dot, blood vessels are represented by line, and air way wall is represented by plane. Let us consider, λ1, λ2, and λ3 are three eigenvalues of Hessian matrix satisfying the condition |λ1| ≥ |λ2| ≥ |λ3|. If λ1, λ2, and λ3 are almost equal in magnitude and negative in sign, then, they represent blob-like structures. If λ1 and λ2 are almost equal in magnitude and negative in sign and λ3 is very small in magnitude compared to λ1 and λ2, then vessel-like structures are represented. The high value of λ1 compared to λ2 and λ3 represents airway wall. Combining the magnitude and the likelihood components and taking into account the signs of the eigenvalues, the coefficient of blob enhancement filters in 3D image space can be represented as
| 3 |
Algorithm for Removal of Vessels Using Selective Enhancement Filtering
- Step 1
Gaussian smoothing Apply 3D Gaussian filter in the VOI, obtained after anisotropic diffusion and ellipsoid approximation of nodule. The Gaussian filter is applied in the region bounded by ellipsoid over several scales σs, where σs={1,3,5,…,15} voxels. An original CT image slice containing a non-solid nodule and its ellipsoid approximation are shown in Fig. 10a, b, respectively.
- Step 2
Multiscale filtering Compute the Hessian matrix for each voxel of different version of Gaussian filtered image and its eigenvalues λ1, λ2, and λ3 satisfying the condition |λ1| ≥ |λ2| ≥ |λ3|. Multiply voxel intensity by Zdot (obtained using Eq. 3) for particular voxel to obtain the voxel likelihood map. Multiply each voxel intensity by in the output image from the enhancement filter at each scale of σs. The final filter output for each voxel is the maximum value obtained from the output of all individual Hessian filter of different scales and shown in Fig. 10c.
- Step 3
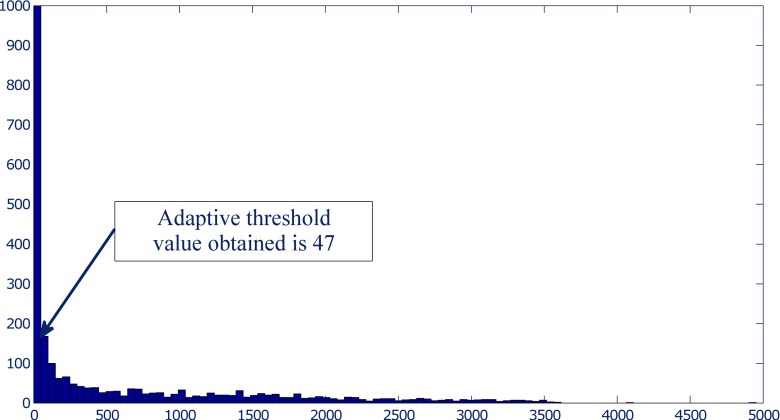
Separation of nodule: The segmented nodule (Fig. 10d) is obtained by adaptive thresholding followed by connected component analysis. The value of threshold for adaptive thresholding is determined by analyzing the histogram of selectively enhanced image. It is seen that the histogram (with 200 bins) of the selectively enhanced image has an abrupt change in the values for two adjacent bins (Fig. 11). Adjacent bins with the largest change of values are identified and their corresponding pixel intensity values are noted. The intensity values corresponding to the mid point of identified bins are averaged to obtain an the value of adaptive threshold for each non-solid nodule.
Fig. 10.

Removal of vessels from non-solid nodule using selective enhancement filtering: a non-solid nodule, b fitting of ellipsoid enclosing nodule, c result of selective enhancement filtering, and d result of thresholding and connected component analysis
Fig. 11.
Selection of an adaptive threshold based on the abrupt change in the values for two adjacent bins of histogram of selectively enhanced image
Performance Metric for Evaluation of Segmentation Results
The performance of the proposed segmentation technique and the competing techniques are quantitatively evaluated in terms of four contour-based metrics and six region-based metrics [23] by means of comparing the binary mask of segmented nodule with the reference ground truth mask. The reference ground truth mask consists of those pixels in each slice that are considered as nodule by at least two radiologists. The reference ground truth mask is constructed for each nodule for the shake of quantitative analysis of segmentation results.
Contour-Based Metrics
These metrics are based on the distance calculation between the contours of binary mask of the segmented nodule and that of the reference ground truth mask. Santos et al. [20] and Silva et al. [22] introduced mean distance and Pratt function to determine contour similarity. Hausdorff distance was used for the evaluation of different boundary detection algorithms [1, 4]. The computation of mean distance and Pratt function requires the identification of auxiliary boundary. A region L is obtained by XOR operation of two contours (A, B). The auxiliary boundary is obtained by performing skeletonization operation of L. The Kth normal on the contour of auxiliary boundary intersects the contours at (x1, y1) and (x2, y2). The Euclidean distance between (x1, y1) and (x2, y2) is denoted by di.
Mean Distance
The mean distance metric [20] is the average value of di
| 4 |
where N refers to the total number of boundary normal on the auxiliary boundary. The minimum values of mean distance is zero, and it indicates total overlap of two contours. There is no limit of the maximum values of mean distance.
Pratt Function
The Pratt function [22] is an index of similarity in the range of [0,1] and it is defined as
| 5 |
where q is a normalization parameter with a constant value of 1/9 [22]. The values of Pratt function is equal to 1 for total overlap and 0 for complete mismatch.
Hausdorff Distance
The classical Hausdorff distance is defined in terms of maximum distance difference between two contours [9]. The largest minimum distance from all points p on the contour of SA to the contour of SB is calculated as in Eq. 6. The Hausdorff distance is defined in Eq. 7.
| 6 |
| 7 |
Modified Hausdorff Distance
Hausdorff distance is a nonlinear operator, and it measures the mismatch between two objects. It is very sensitive to outlines, and small segmentation error will be reflected as large change in the measurement of Hausdorff distance. To minimize the error caused by outlines of objects, modified Hausdorff distance is proposed [9]. The distance between a point a and a finite point set B=(b1,b2,......bn) is defined as
| 8 |
The directed modified Hausdorff distance from A to B is defined as
| 9 |
where NA is the cardinality of set A. Considering hMHD(B,A) as the directed modified Hausdorff distance from B to A, the modified Hausdorff distance is defined as
| 10 |
Region-Based Metrics
The region delimited by the contours are filled in order to compute the region-based metrics. Accuracy, overlap, sensitivity, and specificity are computed using the definition of Byrd et al. [3]. Similarity angle and similarity region are computed using the formula of Santos et al. [20, 22].
Accuracy, Overlap, Sensitivity, and Specificity
Let us consider two regions, whose pixels are classified as follows:
- Ntp
- Number of true positive pixels
- Ntn
- Number of true negative pixels
- Nfp
- Number of false positive pixels
- Nfn
- Number of false negative pixels
Thus, accuracy, overlap, sensitivity, and specificity are defined as [3]
| 11 |
| 12 |
| 13 |
| 14 |
It is to be noted that we have computed accuracy, overlap, sensitivity, and specificity for 3D objects and hence pixel need to be replaced by voxel. The values of these metrics lie in the range of [0,1], where 1 represents the best similarity between two regions and 0 represents complete mismatch, respectively.
Similarity Angle
The similarity angle between is computed based on the morphological similarity between two images [20] and [22]. Each of the following vectors ( and ) are obtained by transforming an (m×n×p) binary image into a 1D array same number of pixels, and similarity angle is defined as
| 15 |
The similarity angle lies in the range of [0, π/2], where 0 corresponds total similarity and π/2 correspond to complete mismatch, respectively.
Similarity Region
Similarity region is defined as [20, 22]
| 16 |
The range of similarity region is [0,1], where 1 corresponds total similarity and 0 correspond to complete dissimilarity, respectively.
Results
Description of Training and Test Data Set
Two different data set D1, and D2 are created for two-fold cross validation from the set of 891 pulmonary nodules in LIDC/IDRI database. The two data set consists of pulmonary nodules of various internal textures and external attachments. The splitting of 891 pulmonary nodules into D1 and D2 could be helpful to avoid the bias during determination of different parameters. The composition of pulmonary nodules in D1 and D2 are provided in Tables 2 and 3.
Table 2.
Nodule composition in the data set D1
| Type of nodule | No. of nodule | Juxta-pleural | Juxta-vascular | Well-circumscribed |
|---|---|---|---|---|
| Solid | 414 | 160 | 200 | 54 |
| Part-solid | 16 | 4 | 12 | 0 |
| Non-solid | 16 | 6 | 8 | 2 |
| Total | 446 | 170 | 220 | 56 |
Table 3.
Nodule composition in the data set D2
| Type of nodule | No. of nodule | Juxta-pleural | Juxta-vascular | Well-circumscribed |
|---|---|---|---|---|
| Solid | 414 | 145 | 219 | 50 |
| Part-solid | 16 | 4 | 10 | 2 |
| Non-solid | 15 | 2 | 13 | 0 |
| Total | 445 | 151 | 242 | 52 |
Classification of Pulmonary Nodules into Solid/Part-Solid and Non-Solid
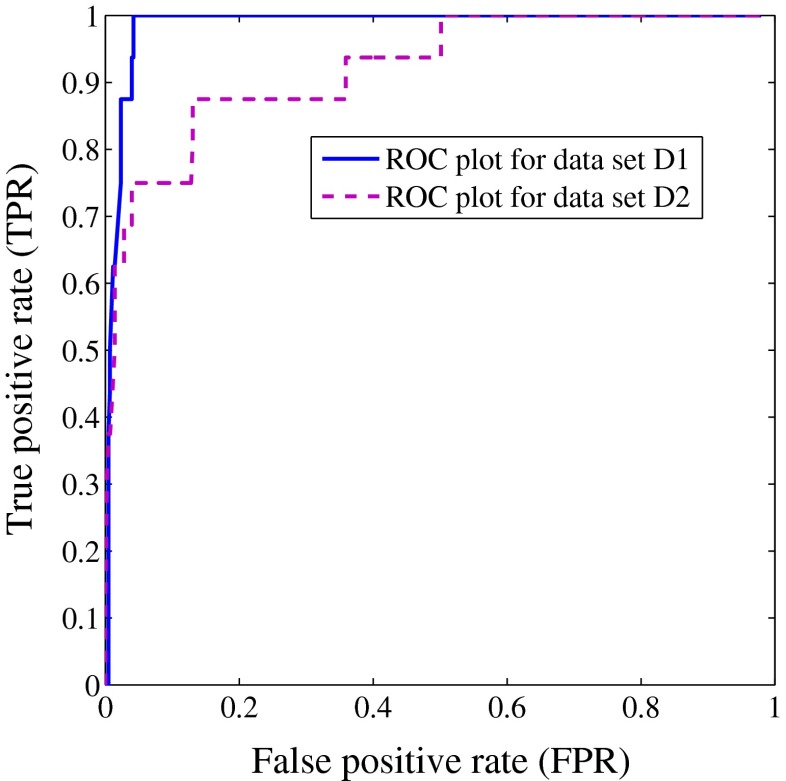
The feature, non-solid part is used for classification of pulmonary nodules into solid/part-solid and non-solid. The threshold value of non-solid part is determined using a point on the ROC curve that is nearest to the point [0,1] for data set D1 and D2 as shown in Fig. 12. The threshold value obtained for data set D1 and D2 are 0.93 and 0.97, respectively. If a nodule has non-solid part greater than the threshold, it is taken as non-solid and solid/part-solid otherwise.
Fig. 12.
The classification performance of non-solid part is shown in ROC plot for data set D1 and D2. It helps to determine the threshold value of the feature, denoted as non-solid part
The empirically determined parameters from D1 are used for evaluation of segmentation results on D2 and vice versa. In case of data set D1, during the classification of pulmonary nodules into solid/part-solid and non-solid total 11 nodules (i.e. 2.47 %) were miss-classified out of 446 nodules. Out of 11 miss-classified nodules, 5 solid and 5 part-solid nodules were miss-classified as non-solid nodules and 1 non-solid nodules were miss-classified as solid/part-solid nodule. In case of data set D2, total 15 nodules (i.e. 3.37 %) were miss-classified out of 445. Out of 15 miss-classified nodules, 6 solid and 4 part-solid nodules were miss-classified as non-solid and 5 non-solid nodules were miss-classified as solid/part-solid nodules. The miss-classified non-solid nodules are segmented using the segmentation method of solid/part-solid nodules and the miss-classified solid/part-solid nodules are segmented using the proposed segmentation method of non-solid nodules for both of data sets, to get the realistic performance of the proposed segmentation framework.
Results of Segmentation for Pulmonary Nodules
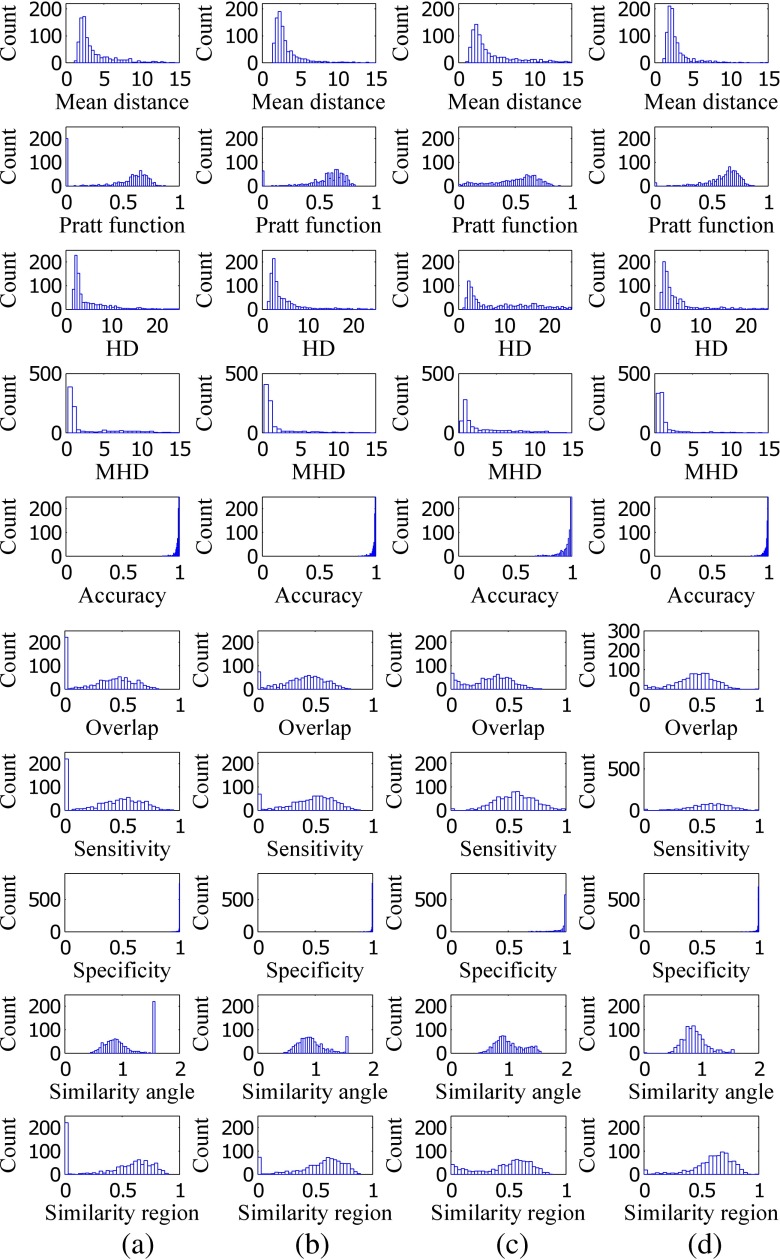
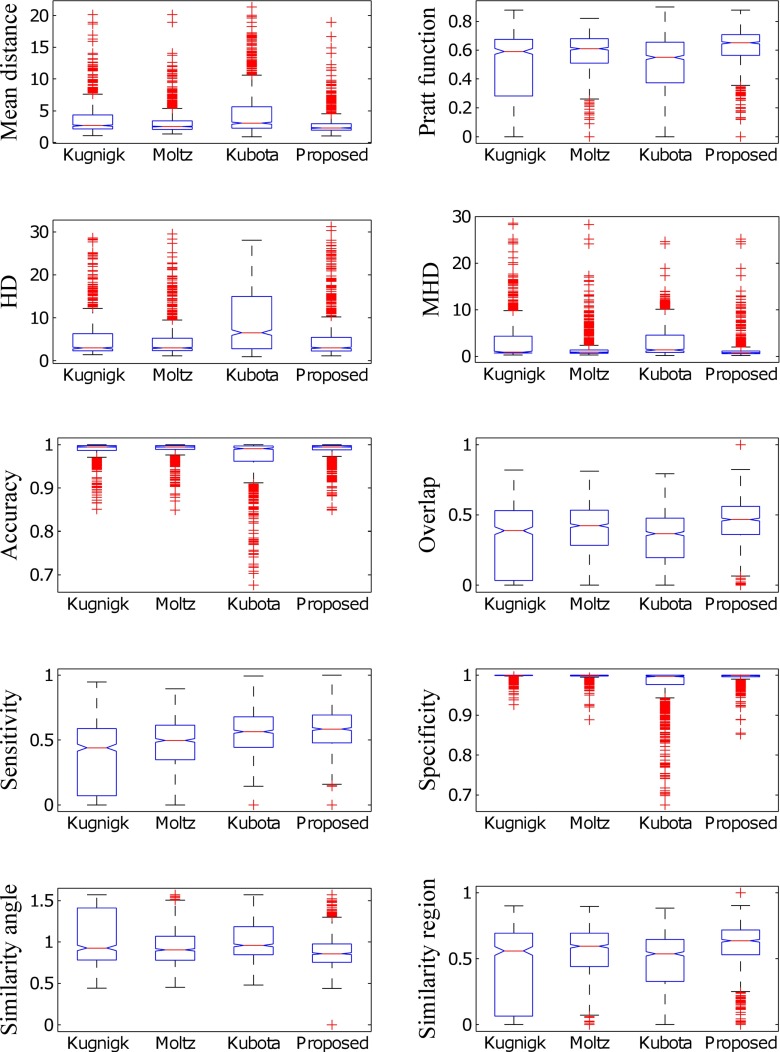
The segmentation results of 891 pulmonary nodules of LIDC/IDRI are reported. The results of segmentation of proposed method and competing methods are provided in terms of four contour-based metrics and six region-based metrics using histogram plot (Fig. 13) and box plot (Fig. 14). The histogram plot and the box plot of mean distance, Pratt function, Hausdorff distance, modified Hausdorff distance, overlap, sensitivity, and similarity angle depict that the proposed segmentation method outperforms the existing methods. The number of background voxels are much larger as compared to the foreground voxel, and the values of specificity of all the techniques lies within a small band. The value of accuracy is affected by specificity and the accuracy also lies within a small band. Hence, accuracy and specificity are unable to discriminate the proposed method and existing techniques based on their performance.
Fig. 13.
The columns a, b, c, and d represent the histogram plot of all metrics for the method of Kuhnigk et al., Moltz et al., and Kubota et al. and the proposed method
Fig. 14.
Represent box plot for all metrics considering method of Kuhnigk et al., Moltz et al., and Kubota et al. and the proposed method
The mean and standard deviation of all the metrics for the proposed method and competing methods are provided in Table 4. The segmentation method of Moltz et al. performs better compared to Kuhnigk et al. for solid/part-slid nodules by limiting the VOI using ellipsoid approximation. There is little improvement in segmentation accuracy of the proposed method for solid nodules due to the change of threshold from −400 HU (as used by Kuhnigk et al., Moltz et al.) to −500 HU. None of the segmentation method of Kuhnigk et al. or Moltz et al. is applicable for non-solid nodules because both methods use a threshold of −400 HU for separation of foreground containing nodule, which causes partial or complete removal of non-solid nodule and the effect is apparent in sensitivity and other metrics. The method of Kubota et al. performs better as compared to the method of Kuhnigk et al. and Moltz et al. for non-solid nodules, and the proposed method outperforms it.
Table 4.
Comparison of segmentation results of the proposed segmentation method with the segmentation method of Kubota et al., Kuhnigk et al., and Moltz et al. considering 891 nodules of LIDC-IDRI data set. For metrics PF, Accuracy, Overlap, Sensitivity, Specificity, SR the maximum and for metrics MD, HD, MHD, SA the minimum values are emphasized with italics.
| Comparative analysis | Kuhnigk et al. | Moltz et al. | Kubota et al. | Proposed method | |||||
|---|---|---|---|---|---|---|---|---|---|
| Nodule | Metric | Mean | SD | Mean | SD | Mean | SD | Mean | SD |
| Solid/ | MD | 3.65 | 2.55 | 3.04 | 1.83 | 4.56 | 3.60 | 2.85 | 1.84 |
| part-solid | PF | 0.48 | 0.27 | 0.58 | 0.17 | 0.50 | 0.23 | 0.62 | 0.14 |
| HD | 4.93 | 4.50 | 4.49 | 4.02 | 8.98 | 7.00 | 5.01 | 5.11 | |
| MHD | 2.90 | 4.30 | 1.62 | 2.53 | 3.05 | 3.37 | 1.46 | 2.41 | |
| Accuracy | 0.99 | 0.01 | 0.99 | 0.01 | 0.97 | 0.05 | 0.99 | 0.01 | |
| Overlap | 0.35 | 0.23 | 0.41 | 0.18 | 0.34 | 0.15 | 0.46 | 0.16 | |
| Sensitivity | 0.39 | 0.26 | 0.48 | 0.19 | 0.56 | 0.16 | 0.58 | 0.16 | |
| Specificity | 1.00 | 0.00 | 1.00 | 0.00 | 0.97 | 0.05 | 0.99 | 0.01 | |
| SA | 1.02 | 0.33 | 0.94 | 0.23 | 1.01 | 0.23 | 0.88 | 0.20 | |
| SR | 0.47 | 0.28 | 0.55 | 0.21 | 0.48 | 0.23 | 0.61 | 0.18 | |
| Non-solid | MD | 6.36 | 2.49 | 6.19 | 2.50 | 6.81 | 0.39 | 3.24 | 1.89 |
| PF | 0.05 | 0.14 | 0.07 | 0.17 | 0.36 | 0.23 | 0.56 | 0.15 | |
| HD | 9.05 | 4.22 | 8.15 | 3.17 | 13.38 | 6.44 | 4.93 | 3.35 | |
| MHD | 8.28 | 4.05 | 7.49 | 4.2 | 5.45 | 3.88 | 1.78 | 2.96 | |
| Accuracy | 0.98 | 0.00 | 0.98 | 0.02 | 0.94 | 0.06 | 0.98 | 0.02 | |
| Overlap | 0.00 | 0.02 | 0.02 | 0.06 | 0.18 | 0.15 | 0.32 | 0.12 | |
| Sensitivity | 0.01 | 0.03 | 0.03 | 0.07 | 0.40 | 0.18 | 0.44 | 0.16 | |
| Specificity | 1.00 | 0.00 | 1.00 | 0.00 | 0.95 | 0.06 | 1.00 | 0.00 | |
| SA | 1.57 | 0.00 | 1.51 | 0.13 | 1.24 | 0.21 | 1.04 | 0.16 | |
| SR | 0.02 | 0.06 | 0.04 | 0.10 | 0.27 | 0.23 | 0.47 | 0.15 | |
MD mean distance, PF Pratt function, HD Hausdorff distance, MHD modified Hausdorff distance, SA similarity angle, SM similarity measure
Discussion
Inter-personal Variations of Radiologists
There is a large amount of inter-personal variability among four radiologists in the boundary annotation of pulmonary nodule in LIDC/IDRI database (Fig. 15), and the reference ground truth of a nodule is highly effected by inter-personal variations. Inter-personal agreement (IPA) among radiologists is represented as
| 17 |
Fig. 15.

Variation of delineation of nodule margin provided by four radiologists in a particular slice for the nodule (LIDC-IDRI 348) by: a first, b second, c third, and d fourth radiologist
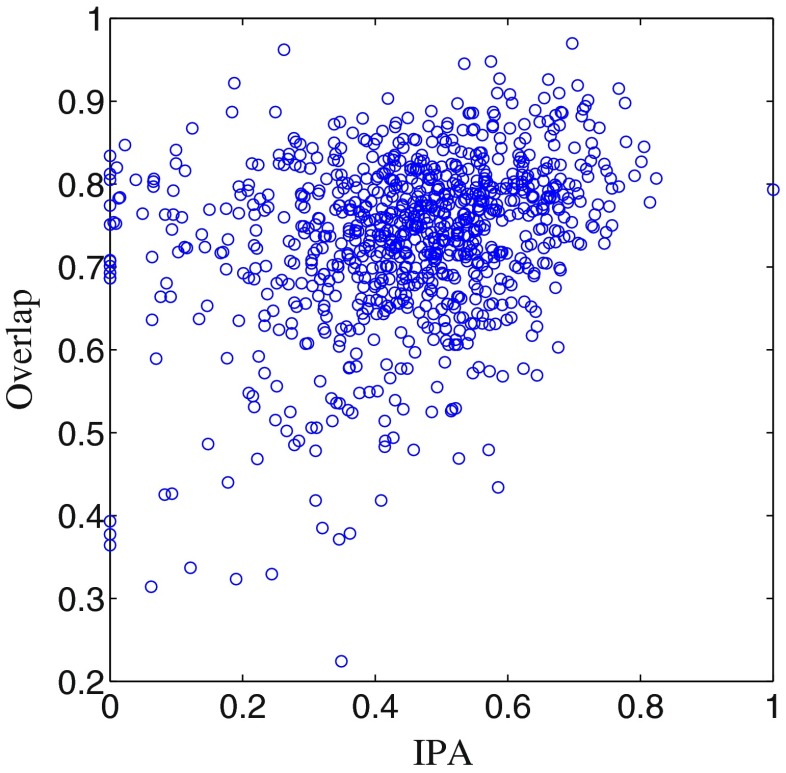
The range of IPA is [0,1], where 0 indicates disagreement and 1 indicates complete agreement among radiologists. The value of overlap is relatively low for the proposed method and the competing technique because overlap is penalized by a little mismatch between binary mask of the segmented nodule and its reference ground truth. The relation between overlap and IPA is shown in Fig. 16, and the value of correlation coefficient is 0.28.
Fig. 16.
Plot of overlap versus IPA
Independent of Hypotheses on Vessel Anatomy in Lung Field
In comparison with the morphological segmentation of Kuhnigk et al. [14], hypotheses on vessel anatomy [(i) each lung vessel is originating in the hilum region and (ii) each vessel’s radius is monotonically decreasing with increasing distance from the hilum] is not required for proposed method. If the vessel anatomy is not satisfied, then segmentation method of Kuhnigk et al. fail (Fig. 17b), whereas the method of Moltz et al. provides better result (Fig. 17c) because of limiting the VOI using ellipsoid fitting. The spicules present on the nodule surface is removed in the method of Moltz et al. in few cases (Fig. 18c). There is no assumption on vessel anatomy in the method of Kubota et al., but it provides over-segmented result (Fig. 17d). The proposed method provides acceptable result (Fig. 17e), and it is independent of hypotheses on vessel anatomy.
Fig. 17.

Example representing the failure of existing segmentation methods: a 2D slice containing solid nodule, b using the method of Kuhnigk et al., c using the method of Moltz et al., d using the method of Kubota et al., and e using proposed method. The ground truth is indicated by red contours ( ) and the segmented nodule is indicated by green contours (
 ) in the 2D slices
Fig. 18.

Example showing the loss of spiculation in existing segmentation methods: a one 2D slice containing solid nodule, b using the method of Kuhnigk et al., c using the method of Moltz et al., d using the method of Kubota et al., and e using proposed method. The ground truth is indicated by red contours ( ) and the segmented nodule is indicated by green contours (
 ) in the 2D slices
Preservation of Undulations of the Surface of Nodules
In many reported works, [5–7, 12, 14, 17, 19] , it is observed that vessels are removed from juxta-vascular nodules using morphological opening which may alter the boundary of nodules and finally lead to loss of spicules (Fig. 18b, c). The segmentation method of Kubota et al. also lead to alter the boundary of nodule in few cases (Fig. 18d). In the proposed method, the boundary of nodule is not altered and the spicules remain intact in the segmented nodule as shown in Fig. 18e.
Reproduction of Results of Segmentation
The results are consistent, reproducible, and independent of selection of seed point as long as the seed point is selected near the center of the nodule. The proposed algorithm takes 4 s (average) to segment a pulmonary nodule using 2.66-GHz Intel quad-core processor with 8-GB RAM.
Parameters
The threshold values used for separation of foreground for solid/part-solid and non-solid nodules are kept constant at −500 HU and −800 HU, respectively (“Preprocessing of VOI”), throughout the entire experiment. The threshold for determining the end point of blood vessels is obtained in an adaptive way (“Removal of Blood Vessels” (A)). The threshold applied to separate the non-solid nodule from its background is determined by histogram analysis of selectively enhanced image (“Removal of Blood Vessels” (B)).
Limitation
The proposed segmentation method completely fails for 6 pulmonary nodules out of 891. The existing methods also fail for those six cases. It is not possible to compute HD and MHD for complete failure cases. For those cases, HD and MHD is considered as the equivalent diameter of the reference ground truth of the nodule. Though the well-circumscribed nodules pass through the vasculature pruning technique, the pruning algorithm does not remove any part of the nodule.
Conclusion
A generalized segmentation framework is proposed applicable for all types of pulmonary nodules. In many research papers, attached vasculature are removed from nodules, using morphological opening after an initial rough segmentation, which may lead to alter the boundary of the nodule and loss of small spicules present on the nodule. In contrary, we proposed a vasculature pruning technique which is applied locally in the region of attachment. In this way, the originality of the nodule surface is mentioned, and this could be helpful for computing surface roughness of solid nodule more accurately.
Acknowledgments
This study was funded by Department of Electronics and Information Technology, Government of India, Grant number 1(3)2009-ME &TMD and 1(2)/2013-ME & TMD/ESDA, respectively.
References
- 1.Alberola-Lopez C, Martín-Fernández M, Ruiz-Alzola J. Comments on: A methodology for evaluation of boundary detection algorithms on medical images. IEEE Trans Med Imaging. 2004;23(5):658–660. doi: 10.1109/TMI.2004.826358. [DOI] [PubMed] [Google Scholar]
- 2.Armato III SG, McLennan G, Bidaut L, McNitt-Gray MF, Meyer CR, Reeves AP, Zhao B, Aberle DR, Henschke CI, Hoffman EA, Kazerooni EA, MacMahon H, Beek EJR, Yankelevitz D, Biancardi AM, Bland PH, Brown MS, Engelmann RM, Laderach GE, Max D, Pais RC, Qing DPY, Roberts RY, Smith AR, Starkey A, Batra P, Caligiuri P, Farooqi A, Gladish GW, Jude CM, Munden RF, Petkovska I, Quint LE, Schwartz LH, Sundaram B, Dodd LE, Fenimore C, Gur D, Petrick N, Freymann J, Kirby J, Hughes B, Casteele AV, Gupte S, Sallam M, Heath MD, Kuhn MH, Dharaiya E, Burns R, Fryd DS, Salganicoff M, Anand V, Shreter U, Vastagh S, Croft BY, Clarke LP. The lung image database consortium (LIDC) and image database resource initiative (IDRI): a completed reference database of lung nodules on CT scans. Med Phys. 2011;38(2):915–931. doi: 10.1118/1.3528204. [DOI] [PMC free article] [PubMed] [Google Scholar]
- 3.Byrd KA, Zeng J, Chouikha M. A validation model for segmentation algorithms of digital mammography images. J Appl Sci Eng Technol. 2007;1:41–50. [Google Scholar]
- 4.Chalana V, Kim Y. A methodology for evaluation of boundary detection algorithms on medical images. IEEE Trans Med Imaging. 1997;16(5):642–652. doi: 10.1109/42.640755. [DOI] [PubMed] [Google Scholar]
- 5.Dehmeshki J, Amin H, Valdivieso M, Ye X. Segmentation of pulmonary nodules in thoracic CT scans: A region growing approach. IEEE Trans Med Imaging. 2008;27(4):467–480. doi: 10.1109/TMI.2007.907555. [DOI] [PubMed] [Google Scholar]
- 6.Diciotti S, Lombardo S, Falchini M, Picozzi G, Mascalchi M. Automated segmentation refinement of small lung nodules in CT scans by local shape analysis. IEEE Trans Biomed Eng. 2011;58(12):3418–3428. doi: 10.1109/TBME.2011.2167621. [DOI] [PubMed] [Google Scholar]
- 7.Diciotti S, Picozzi G, Falchini M, Mascalchi M, Villari N, Valli G. 3-D segmentation algorithm of small lung nodules in spiral CT images. IEEE Trans Inf Technol Biomed. 2008;12(1):7–19. doi: 10.1109/TITB.2007.899504. [DOI] [PubMed] [Google Scholar]
- 8.Henschke CI, Yankelevitz DF, Mirtcheva R, McGuinness G, McCauley D, 0lli S. Miettinen: CT screening for lung cancer: Frequency and significance of part-solid and nonsolid nodules. Am J Roentgenol 2002; 178(5):1053–1057. [DOI] [PubMed]
- 9.Huttenlocher DP, Klanderman GA, Rucklidge WJ. Comparing images using the hausdorff distance. IEEE Transactions on Pattern Analysis and Machine Intelligence. 1993;15(9):850–863. doi: 10.1109/34.232073. [DOI] [Google Scholar]
- 10.Kauczor HU, Heitmann K, Heussel CP, Marwede D, Uthmann T, Thelen M. Automatic detection and quantification of ground-glass opacities on high-resolution CT using multiple neural networks: comparison with a density mask. Am J Roentgenol. 2000;175(5):1329–1334. doi: 10.2214/ajr.175.5.1751329. [DOI] [PubMed] [Google Scholar]
- 11.Ko JP, Naidich DP. Computer-aided diagnosis and the evaluation of lung disease. J Thorac Imaging. 2004;19(3):136–155. doi: 10.1097/01.rti.0000135973.65163.69. [DOI] [PubMed] [Google Scholar]
- 12.Kostis WJ, Reeves AP, Yankelevitz DF, Henschke CI. Three-dimensional segmentation and growth-rate estimation of small pulmonary nodules in helical ct images. IEEE Trans Med Imaging. 2003;22(10):1259–1274. doi: 10.1109/TMI.2003.817785. [DOI] [PubMed] [Google Scholar]
- 13.Kubota T, Jerebko AK, Dewan M, Salganicoff M, Krishnan A. Segmentation of pulmonary nodules of various densities with morphological approaches and convexity models. Med Image Anal. 2011;15(1):133–154. doi: 10.1016/j.media.2010.08.005. [DOI] [PubMed] [Google Scholar]
- 14.Kuhnigk JM, Dicken V, Bornemann L, Bakai A, Wormanns D, Krass S, Peitgen HO. Morphological segmentation and partial volume analysis for volumetry of solid pulmonary lesions in thoracic CT scans. IEEE Trans Med Imaging. 2006;25(4):417–434. doi: 10.1109/TMI.2006.871547. [DOI] [PubMed] [Google Scholar]
- 15.Li Z, Ma L, Jin X, Zheng Z. A new feature-preserving mesh-smoothing algorithm. Vis Comput. 2009;25(2):139–148. doi: 10.1007/s00371-008-0210-7. [DOI] [Google Scholar]
- 16.McNitt-Gray MF, Armato III SG, Meyer CR, Reeves AP, McLennan G, Pais RC, Freymann J, Brown MS, Engelmann RM, Bland PH, Laderach GE, Piker C, Guo J, Towfic Z, Qing PYD, Yankelevitz DF, Aberle DR, Beek EJR, MacMahon H, Kazerooni EA, Croft BY, Clarke LP. The lung image database consortium LIDC data collection process for nodule detection and annotation. Acad Radiol. 2007;14(12):1464–1474. doi: 10.1016/j.acra.2007.07.021. [DOI] [PMC free article] [PubMed] [Google Scholar]
- 17.Moltz JH, Kuhnigk JM, Bornemann L, Peitgen H. Segmentation of juxtapleural lung nodules in ct scan based on ellipsoid approximation. First International Workshop on Pulmonary Image Processing, 2008.
- 18.Perona P, Malik J. Scale-space and edge detection using anisotropic diffusion. IEEE Transactions on Pattern Analysis and Machine Intelligence. 1989;12(7):629–639. doi: 10.1109/34.56205. [DOI] [Google Scholar]
- 19.Reeves AP, Chan AB, Yankelevitz DF, Henschke CI, Kressler B, Kostis WJ. On measuring the change in size of pulmonary nodules. IEEE Trans Med Imaging. 2006;25(4):435–450. doi: 10.1109/TMI.2006.871548. [DOI] [PubMed] [Google Scholar]
- 20.Santos BS, Ferreira C, Silva JS, Silva A, Teixeira L. Quantitative evaluation of a pulmonary contour segmentation algorithm in x-ray computed tomography images 1. Acad Radiol. 2004;11(8):868–878. doi: 10.1016/j.acra.2004.05.004. [DOI] [PubMed] [Google Scholar]
- 21.Siegel R, Naishadham D, Jemal A. Cancer statistics, 2013. CA Cancer J Clin. 2013;63(1):11–30. doi: 10.3322/caac.21166. [DOI] [PubMed] [Google Scholar]
- 22.Silva A, Silva JS, Santos BS, Ferreira C. Fast pulmonary contour extraction in x-ray CT images: a methodology and quality assessment. Medical Imaging 2001, 2001, pp 216–224.
- 23.Silva JS, Santos JB, Roxo D, Martins P, Castela E, Martins R. Algorithm versus physicians variability evaluation in the cardiac chambers extraction. IEEE Trans Inf Technol Biomed. 2012;16(5):835–841. doi: 10.1109/TITB.2012.2201949. [DOI] [PubMed] [Google Scholar]
- 24.Tao Y, Lu L, Dewan M, Chen AY, Corso J, Xuan J, Salganicoff M, Krishnan A. Multi-level ground glass nodule detection and segmentation in ct lung images. Medical Image Computing and Computer-Assisted Intervention–MICCAI 2009, pp 715–723. Springer; 2009. [DOI] [PubMed]
- 25.Zhou J, Chang S, Metaxas DN, Zhao B, Ginsberg MS, Schwartz LH. An automatic method for ground glass opacity nodule detection and segmentation from CT studies. Engineering in Medicine and Biology Society, EMBS’06, pp 3062–3065; 2006. [DOI] [PubMed]


