Abstract
Multimodality medical image fusion plays a vital role in diagnosis, treatment planning, and follow-up studies of various diseases. It provides a composite image containing critical information of source images required for better localization and definition of different organs and lesions. In the state-of-the-art image fusion methods based on nonsubsampled shearlet transform (NSST) and pulse-coupled neural network (PCNN), authors have used normalized coefficient value to motivate the PCNN-processing both low-frequency (LF) and high-frequency (HF) sub-bands. This makes the fused image blurred and decreases its contrast. The main objective of this work is to design an image fusion method that gives the fused image with better contrast, more detail information, and suitable for clinical use. We propose a novel image fusion method utilizing feature-motivated adaptive PCNN in NSST domain for fusion of anatomical images. The basic PCNN model is simplified, and adaptive-linking strength is used. Different features are used to motivate the PCNN-processing LF and HF sub-bands. The proposed method is extended for fusion of functional image with an anatomical image in improved nonlinear intensity hue and saturation (INIHS) color model. Extensive fusion experiments have been performed on CT-MRI and SPECT-MRI datasets. Visual and quantitative analysis of experimental results proved that the proposed method provides satisfactory fusion outcome compared to other image fusion methods.
Keywords: Image fusion, NSST, PCNN, Improved nonlinear intensity hue saturation color model, CT-MRI fusion, SPECT-MRI fusion
Introduction
Multimodality medical image fusion provides a composite image containing all the crucial information present in the source images. It is widely used in diagnosis, treatment planning, and follow-up studies of various diseases. It helps in precise localization and delineation of lesions. For the diagnosis and treatment planning of certain diseases, information provided by more than one imaging modality would be required as each medical imaging modality is having its own strengths and limitations. Anatomical imaging modalities like X-ray computed tomography (CT), magnetic resonance imaging (MRI), and ultrasound imaging provide morphologic details of the human body. Whereas, functional imaging modalities like single photon emission computed tomography (SPECT) and positron emission computed tomography (PET) provide metabolic information without anatomical context. By the fusion of functional image with an anatomical image, it is possible to provide anatomical correlation to the functional information. This is used in oncology for tumor segmentation and localization for radiation therapy treatment planning [1]. Fusion of CT with MRI images is used in brachytherapy treatment planning [2].
Medical image fusion has been widely explored, and many schemes have been proposed by researchers. Depending on the technique used, these can be classified into the following categories: methods based on dimensionality reduction technique such as principle component analysis (PCA), morphological operators-based methods, fuzzy logic-based methods, neural network (NN)-based methods, and multi-scale decomposition transform-based methods or transform domain methods [3]. Multi-scale top hat transform-based image fusion algorithm is proposed in [4]. These morphological operator-based algorithms are sensitive to structuring element used to extract image features, and there is possibility of introduction of artifacts into the fused image. The performance of fuzzy logic-based algorithms [5] is dependent on the selection of membership functions, and the membership functions have to be varied depending on the modalities to be fused. In case of NN-based algorithm [6], images are segmented or divided into blocks of fixed sizes, and then they are fused. These methods are sensitive to segmentation algorithm or the block size [7, 8]. Functional and anatomical image fusion based on PCA and intensity hue saturation (IHS) color model has been proposed in [9]. This method suffered from spectral distortion because of the nonlinear IHS color model. PET-MRI fusion based on color tables has been tested in [10], and this method presents the functional information in different color palette. PET-CT fusion based on features in spatial domain is reported in [11]. This method is easy to implement. However, color palettes of source functional image and fused image are different in this case. Among the aforementioned techniques, transform domain image fusion methods are more feasible for medical image fusion. Because it is possible to extract image features of different resolutions and directions into different sub-bands using transform and combine these sub-bands in accordance with their characteristics. In transform domain image fusion methods, the major influencing factors are selection of multi-scale decomposition (MSD) transform and the coefficient fusion schemes. The MSD transforms like discrete wavelet transform (DWT), curvelet transform (CVT), and contourlet transform (CNT) do not provide better image fusion performance as they are shift variant transforms. Due to subsampling operation in the construction of these transforms, some information would be lost, and blocking artifacts would be introduced in the fused image. Again, due to up-sampling in their reconstruction, the error incurred would be enlarged. Hence, shift-invariance property of MSD resulting from elimination of down-samplers and up-samplers are very much essential for image fusion. One of the shift invariant MSD transforms is nonsubsampled contourlet transform (NSCT). It is able to represent the smoothness along the edges or contours properly. However, its high computational complexity impedes its use for medical image fusion. Nonsubsampled shearlet transform (NSST) [12, 13] is a shift invariant MSD transform that has high directional sensitivity and having less computational complexity compared to NSCT. These features of NSST are suitable for medical image fusion application. After fixing the MSD transform for directional decomposition of source images, the next step is to design the fusion rules for combining the coefficients of different sub-bands.
Fusion rules based on different strategies have been tested by researchers. These could be classified into fusion rules based on saliency measures, neural networks, and fuzzy logic. Entropy of square of the coefficients and sum of modified Laplacian has been used in NSCT domain [14]. Energy and regional feature-based fusion rules have been adapted in NSCT domain [15]. Regional energy and contrast feature-based fusion rules in NSST domain have been utilized in [16]. Directional vector norm and band-limited contrast-based fusion rules in NSST domain have been proposed in [17]. Non-classical RF model-based fusion rules in NSST domain have been tested in [18]. Fusion outcome of all these methods suffered from poor contrast and loss of information related to one of the source images. A special type of neural network inspired by the cat’s visual cortex called pulse-coupled neural network (PCNN) [19] has been applied for image fusion. The temporal synchronous pulse output of PCNN contains valuable information for many image-processing applications. The PCNN used in multi-resolution transform domain is promising for medical image fusion application. In the past years, researchers have used PCNN-based fused rules in transform domain. The basic PCNN model is utilized in NSCT domain [20]. Modified spatial frequency-motivated PCNN has been adapted in NSCT domain [21]. PCNN with adaptive-linking strength based on spatial frequency has been used in NSST domain [22]. Unit-linking PCNN with contrast-based linking strength has been used in [23]. The modified models of PCNN such as dual-channel PCNN [24, 25], intersecting cortical model (ICM) [26], and spiking cortical model (SCM) [27, 28] have been used for image fusion. However, in these state-of-the-art methods, external stimulus to PCNN for approximate and detail sub-bands is normalized coefficient value. PCNN-based fusion rules for both types of sub-bands have been modeled in the same way. In fact, the information present in approximate and detail sub-bands is different. The normalized coefficient value used to motivate PCNN in LF sub-band fusion leads to blur and loss of details in the fused image. In the present work, this point is taken into consideration, and a suitable feature is used to motivate the PCNN-processing LF sub-band. Values of other parameters of the PCNN are chosen based on the task to be performed by them in the network to get optimum performance.
Rest of the paper is organized as follows. PCNN neuron model used in the proposed method is discussed in section “Simplified Adaptive PCNN Model”. The proposed anatomical image fusion method is described in section “Proposed Anatomical Image Fusion Method”. Extension of this method to functional and anatomical image fusion is described in section “Functional and Anatomical Image Fusion”. The “Results and Discussions” section is divided into three subsections for clarity: “Methods Used for Comparison”, “CT-MRI Image Fusion Results”, and “SPECT-MRI Image Fusion Results”. Finally, conclusions are drawn in the “Conclusions” section.
Simplified Adaptive PCNN Model
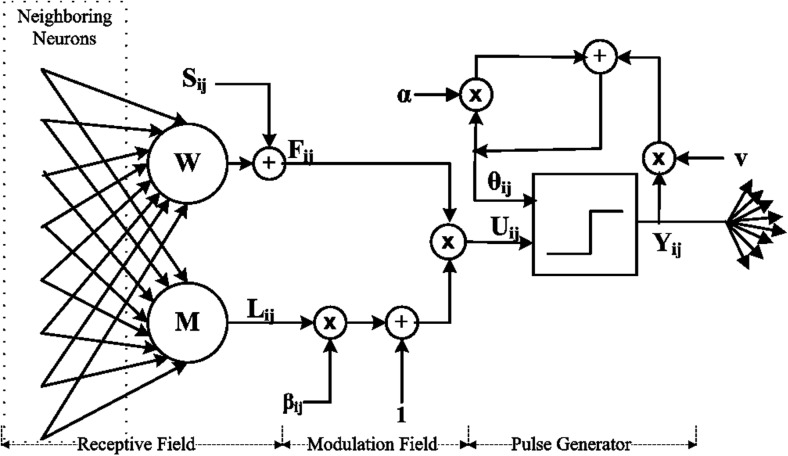
PCNN is a laterally connected two-dimensional network of pulse-coupled neurons that have one to one correspondence with pixels of the image. The basic model of PCNN has more number of parameters and its detailed description is available in [27]. It is practically difficult to set the optimum value for each parameter. Hence, in the present work, PCNN is simplified in such a way to reduce the number of parameters to be adjusted. On other hand, all the unique capabilities of the PCNN are retained in this simplified model. Structure of the simplified adaptive PCNN neuron model adapted in the present work is depicted in Fig. 1. This consists of three fields: receptive field, modulation filed, and pulse generator. The receptive field comprises of two input parts: feeding input and linking input. Feeding input Fij[n] given by Eq. (1) is the channel through which external stimulus Sij and the output from neighboring neurons Yijkl[n] fed to the center neuron. Linking input Lij[n] given by Eq. (2) is another channel through which neighboring neurons coupled to the center neuron.
| 1 |
| 2 |
Fig. 1.
Neuron structure of simplified adaptive PCNN model
Where, W and M are the synaptic weight matrices.
In the modulation field, the feeding and linking inputs are modulated in the second order fashion to obtain the total internal activity Uij[n] of the neuron as described in Eq. (3).
| 3 |
βijis the linking strength of the ijth neuron of the network.
In pulse generator part, internal activity Uij[n] of the neuron is compared with its internal threshold θij[n], and the pulse will be generated at the instances when the internal activity crosses the threshold value.
| 4 |
Threshold value is updated each iteration according to Eq. (5).
| 5 |
Where α is threshold decay constant, and v is threshold magnifying constant.
The time matrix which holds the first firing instance of each neuron in the PCNN is described in Eq. (6). This holds important information, and it is used as output of PCNN in the present work.
| 6 |
PCNN parameters are set to the following values:
-
I.Synaptic weight matrices (W and M): The synaptic weight matrix couples the neighboring neurons to the center neuron. Generally, neighboring neurons close to the center neuron must be coupled with more weight than neighboring neurons far away. Hence, it is reasonable to make the synaptic weight matrices to be dependent on the Euclidian distance from the center neuron. As the synaptic weight matrices W and M in the feeding input Fij[n] given in Eq. (1), and linking input Lij[n] given in Eq. (2), respectively, serve the same purpose, they are set to the same value given in Eq. (7).
7 -
II.
Linking strength (β): Linking strength β modulates the linking input and feeding input to form total internal activity as given in Eq. (3). In order to get high internal activity from regions having remarkable features than the low activity regions, it is intuitive to use variable linking strength instead of using constant linking strength for all neurons in PCNN. Sum of directional gradients (SDG) feature at each location is used as the linking strength of the neuron present in the corresponding location.
The sum of directional gradients of a function I(x, y) is defined as:8 9 10 11 12 -
III.
Threshold decay and magnifying constants: Threshold θij[n] of each neuron is updated by Eq. (5) every iteration of PCNN. The two parameters, threshold decay (α) and magnifying (v) constants, control the pulsing frequency of neurons. If the neuron has not pulsed, then threshold is reduced by a factor of α each iteration to reach to the internal activity so that neuron may get fired. To get moderate pulsing frequency, α is made equal to 0.75. Once the neuron fired, then threshold would be increased by an amount v. Hence, v is set to 20 a large value in order to avoid firing of neurons more number of times during PCNN processing.
-
IV.
Number of iterations: Number of iterations of PCNN is chosen adaptively. PCNN is iterated until all the neurons fired once. The ordinal value of the iteration in which the lost neuron fired gives the total number of iterations.
Proposed Anatomical Image Fusion Method
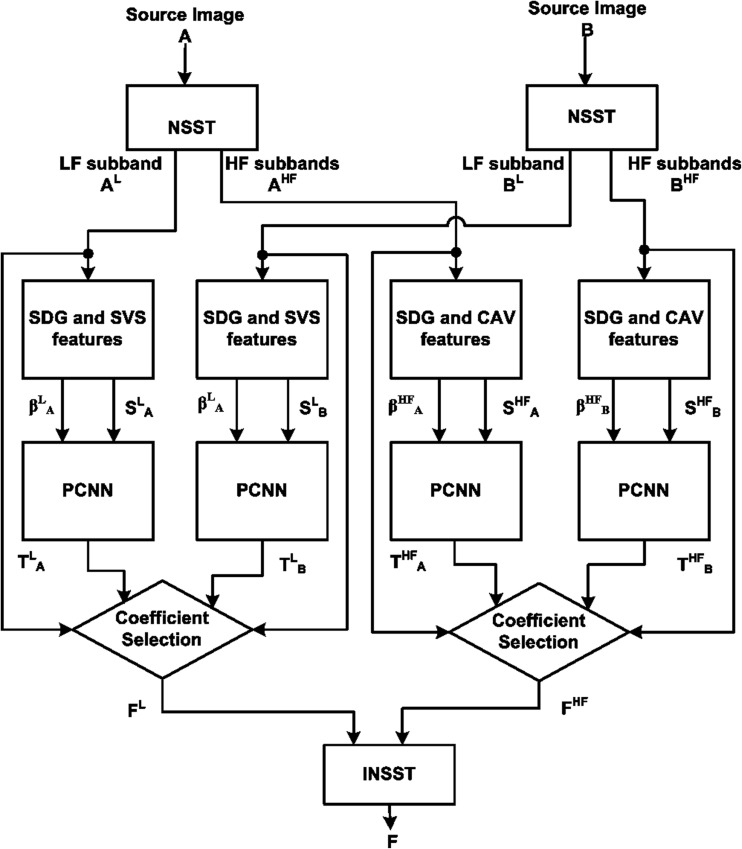
Although PCNN can be used to fuse the image pixels directly in spatial domain, usage of PCNN in multi-scale decomposition transform (MSDT) domain gives better results, because MSDT visualizes image feature of different orientations and different resolutions. Among existing MSDTs, nonsubsampled shearlet transform (NSST) has important characteristics of shift invariance and high directional sensitivity at lower computational complexity. In the present work, image fusion is performed in NSST domain. More details of NSST are available in [12, 29]. The proposed image fusion frame work is depicted in Fig. 2. The two source images A and B are represented in approximate/low-frequency (LF) sub-bands and directional/high-frequency (HF) sub-bands of various scales using NSST. The LF sub-bands AL and BL of source images A and B are combined to obtain fused LF sub-band FL using PCNN-based fusion algorithm in which sum of variation in squares (SVS) feature described in Eq. (14) is fed as external stimulus (SLX, X=A or B) to the PCNN. The HF sub-bands AHF and BHF of the source images A and B, respectively, are combined using PCNN-based fusion algorithm in which coefficient absolute value (CAV) is fed as external stimulus (SHFX, X=A or B) to the PCNN. PCNN-based fused algorithm is described in the following subsection. Inverse NSST of fused sub-bands gives the fused image (F).
Fig. 2.
Schematic of proposed anatomical image fusion method
PCNN-Based Fusion Algorithm
-
I.
Initialize the PCNN: Feeding input F, linking input L, output Y, and time matrix T of PCNN shown in Fig. 1 initialized to zero. Threshold θ is initialised to one to avoid void iterations.
-
II.
Compute the linking strength β: At each coefficient of the sub-band, calculate the sum of directional gradients (SDG) feature using Eq. (8) and give it to PCNN as its linking strength β.
-
III.
Feed the PCNN: External stimulus S to the PCNN is made different for LF and HF sub-band fusion in view of type of information present in these sub-bands. LF sub-band is a smooth version of the image and it contains most of the signal energy. Hence, the sum of the variation in squares of the coefficients (SVS) is fed as external stimulus to PCNN-processing LF sub-band. SVS feature is calculated by using Eqs. (13) and (14).
Let C(u, v) be LF sub-band coefficient at location (u, v). The variation in the square of the coefficients in 3 × 3 neighborhood is defined as (13).13 HF sub-bands hold the detail information present in the image. Hence, coefficient absolute value (CAV) is fed as external stimulus to PCNN-processing HF sub-bands.
-
IV.
Obtain the time matrix T: Iterate each PCNN using Eqs. (1–5) until all neurons fire. Save the time matrices of PCNN-processing LF sub-bands AL and BL of source images A and B as TLA and TLB, respectively. Similarly, time matrices of PCNN-processing HF sub-band of rth scale and dth direction Ar,d and Br,d of source images A and B as Tr,dA and Tr,dB, respectively.
-
V.Derive the fused sub-bands: At each location of the sub-band, the source image coefficient which has fired earlier is selected. Fused LF sub-band FL is obtained by the Eq. (16).
16 Fused HF sub-band of rth scale and dth direction is obtained by the Eq. (17).17
Functional and Anatomical Image Fusion
Functional image is a low-resolution pseudocolor image in which color of the image holds the most vital information such as metabolic activity or blood flow etc., depending on the organ being imaged. However, anatomical image is a high-resolution grayscale image that gives the structural information. Fused functional and anatomical should have the same color as that of the functional image and all the details of anatomical image. One of the promising approaches to achieve this is fusion in de-correlated color model. So far, nonlinear IHS (NIHS) color model [30] and lαβ [31] color models have been used for medical image fusion application. NIHS color model introduces new colors in the fused image, but it is able to preserve the anatomical details with good contrast. lαβ color model has better de-correlation of chromatic and achromatic information, thereby, it does not incur any spectral distortion or change in color information. However, it does not provide good contrast for spatial details. To get better spectral and spatial characteristics, improved nonlinear IHS color model (INIHS) [32] is adapted in the present work for the first time for medical image fusion application. INIHS color model does not incur color gamut problem after fusion with an anatomical image. In INIHS color model, all the desired intensity changes can be achieved with the contrast being well maintained by adjusting the saturation to be within the maximum attainable range.
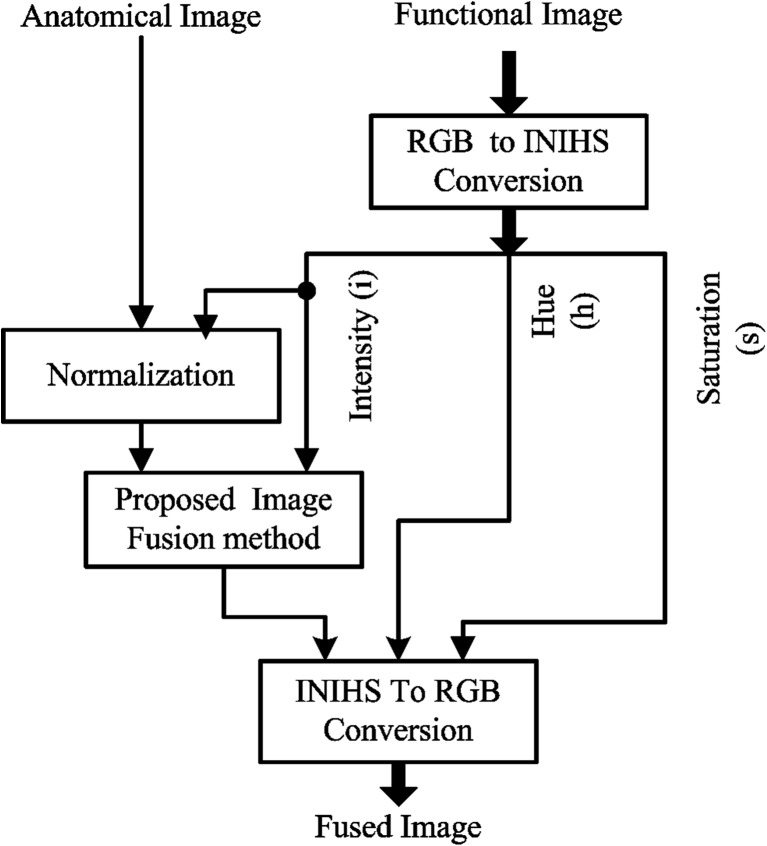
The proposed functional and anatomical image fusion technique is depicted in Fig. 3. The functional image which is in RGB color model is converted to INIHS color model. Thereby, we get intensity component (i), hue component (h), and saturation component (s). Before fusion of the intensity component with anatomical image, it is very important to normalize the intensity range of anatomical image (A) with that of the intensity component (i) of functional image. If A is an anatomical image, then normalized anatomical image Anew is given by Eq. (19).
| 18 |
| 19 |
Fig. 3.
Schematic of proposed functional and anatomical image fusion frame work
This new anatomical image Anew is fused with intensity component by the proposed anatomical image fusion method to obtain inew containing all the details of anatomical image. The inew, the original hue (h), and saturation (s) components converted to RGB color model give the fused image (F). Detail procedure of converting RGB color model to INIHS color model and INIHS color model to RGB color model is available in [32].
Results and Discussions
All simulations are done in Matlab7.1 on PC with Intel core2 Duo 3 GHz. In the proposed method, a number of NSST decomposition levels are set to 3 with 4, 8, and 8 directions from coarse to fine scale. The shearing filter width is set to 8, 16, and 16. The “pyr” filter is used as pyramidal filter. All the PCNN parameters are set as discussed in section 2. Extensive experiments have been conducted on 9 sets of CT-MRI images and 5 sets of SPECT-MRI neurological images of different pathologies to test the performance of the proposed method and its extension to functional-anatomical image fusion. All these pre-processed and registered datasets have been collected from http://www.med.harvard.edu/aanlib/home.html. Both quantitative and qualitative analysis has been done on experimental results. This section discusses the methods used for comparison, performance indexes used for quantitative evaluation, CT-MRI image fusion results, and SPECT-MRI image fusion results.
Methods Used for Comparison
The proposed method denoted as M6 is compared with the following five latest methods. NSST-based method with non-classic receptive field-based fusion rule [18] denoted as M1. Improved intersecting cortical model-based fusion rule adapted in NSST domain [26] denoted as M2. Energy and contrast-based fusion rules utilized in NSST domain [16] denoted as M3. An improved dual-channel PCNN-based fusion rule adapted in NSCT domain [25] denoted as M4. The spatial frequency-linked PCNN in NSST domain [22] denoted as M5. The parameter setting of these methods is done as per the details given by the corresponding references.
In order to prove the effectiveness of the improved nonlinear IHS (INIHS) color model, the proposed image fusion method for functional and anatomical images, is compared with the following NIHS color model-based methods. A simple NIHS color model-based method in which intensity component of functional image is replaced with anatomical image [30] denoted as m1. Image fusion method of references [16, 22, 25, 26] in NIHS color model domain denoted as m2, m3, m4, and m5, respectively. The proposed functional-anatomical image fusion method is denoted as m6.
Performance Indexes
-
I.
Mutual information based index (MI): Mutual information between fused image and the two source images is calculated and then added [14].
-
II.
Spatial frequency (SF): Spatial frequency [14] of fused image asses its activity level.
-
III.
Standard deviation (STD): Standard deviation of fused image measures its clarity.
-
IV.
Edge information-based quality index (Qab/f) [33]: Xydias and Petrovic proposed an image fusion quality index that quantifies the amount edge information transferred from source images to the fused image [33]. In case of anatomical image fusion (CT-MRI image fusion), Qab/f is calculated between fused image and the two anatomical images. In case of functional-anatomical image fusion, it is calculated for each spectral band of the functional image separately and then averaged.
-
V.
Q, Qw, and Qe: Gemma Piella et al. [34] proposed three image fusion quality indexes based on universal image quality index [35]. These quality indexes quantify the similarity without structural distortion between the fused and the original images. These have a dynamic range of 0 to 1.
-
VI.Bias: Bias quantifies the spectral distortion in case of functional and anatomical image fusion. Bias is the absolute difference in the means of functional image and fused image in all spectral bands relative to the mean of the functional image. The less value of bias implies less spectral distortion and better fusion quality.
, and are the mean values of kth spectral band of functional image and fused image, respectively.
-
VII.
Filtered correlation coefficient (FCC) [36]: This quality index quantifies the anatomic detail information in functional and anatomical fused image. Fused and anatomical images are high pass filtered using laplacian filter mask. Correlation coefficient between each filtered fused image spectral band and filtered anatomical image is calculated, and then averaged to get filtered correlation coefficient (FCC) or high correlation coefficient [36]. Range of FCC is 0 to 1.
CT-MRI Image Fusion Experimental Results
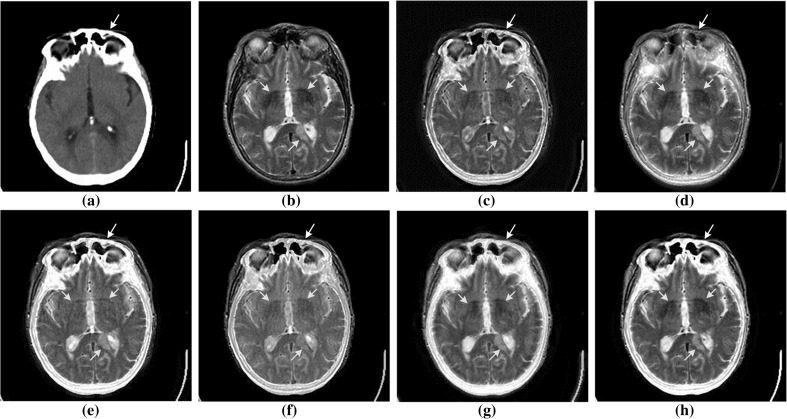
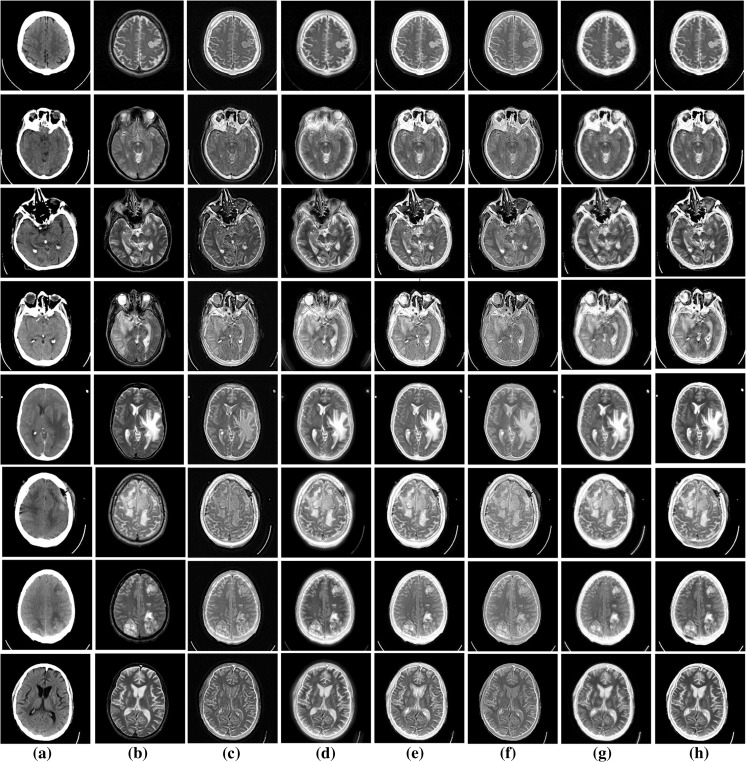
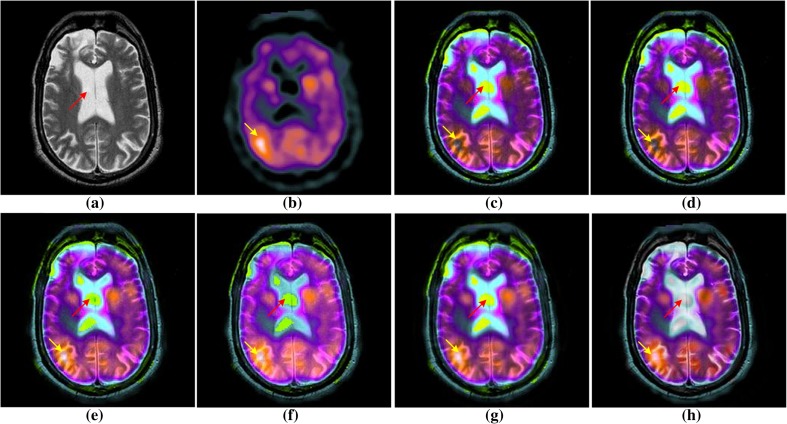
Image fusion methods are tested on nine CT-MRI image pairs of different cases. Case 1 is an acute stroke case is shown in Fig. 4. Patient of this case had difficulty in reading. Cases 2 to 9 are shown in Fig. 5. Case 2 is an acute stroke case presenting as speech arrest. The MRI image of this case reveals infract having ribbon like geometry. Case 3 is hypertensive encephalopathy. Case 4 is a multiple embolic infractions case. Case 5 is a fatal stroke case in which enlarged right pupil can be seen. Case 6 is a metastatic bronchogenic carcinoma, and the MRI image of this case reveals a large mass with surrounding edema in left temporal region. Cases 7, 8, and 9 are meningioma, sarcoma, and cerebral toxoplasmosis cases, respectively. All these nine image pairs are of size 256 × 256 and are in 256 grayscale format.
Fig. 4.
CT and MRI image fusion results of case 1: a CT image, b MRI image. Fused image by c M1 [18], d M2 [26], e M3 [16], f M4 [25], g M5 [22], and h the proposed method M6
Fig. 5.
CT and MRI image fusion results of cases 2 to 9: a CT images, b MRI images. Fused images by c M1 [18], d M2 [26], e M3 [16], f M4 [25], g M5 [22], and h the proposed method M6
Visual Evaluation of CT-MRI Fusion Results
Visual evaluation of CT-MRI fusion results is performed with respect to the following aspects. Ability of fused image to retain hard tissue information present in the CT image and soft tissue information present in the MRI image with the same contrast as that of the source images. Structural distortion introduced into the fused image is tested. Ability of fused image to present the pathology of the source images clearly without any distortion is observed. The usefulness of fused image for clinical applications is evaluated. Fused images of acute stroke case that is case 1 by all the six methods including proposed method is presented in Fig. 4. The visual inspection of fused images reveals the following facts. Fused image by M1 shown in Fig. 4c retained the details of CT and MRI images. However, contrast is poor and few structures are darkened. Fused image by M2 shown in Fig. 4d is able to hold all the details of MRI image, but hard tissues present in CT image are lost. Fused image by M3 shown in Fig. 4e retained the CT image details clearly, but it has not maintained the desired contrast for soft tissues of MRI image. Fused image by M4 shown in Fig. 4f has the details of CT and MRI image. However, both details are blurred. Even though, fused image by M5 shown in Fig. 4g maintains good contrast for soft and hard tissues of MRI and CT; there are discrepancies in few tissues or structures compared to the original images. Fused image by the proposed method M6 shown in Fig. 4h presented all the details of MRI and CT images clearly without any type distortions. The pathology which is infarct in this case is presented clearly in the fused image by M6. Similar performance is perceived for the remaining 8 cases (cases 2 to 9) shown in Fig. 5.
Quantitative Evaluation of CT-MRI Image Fusion Results
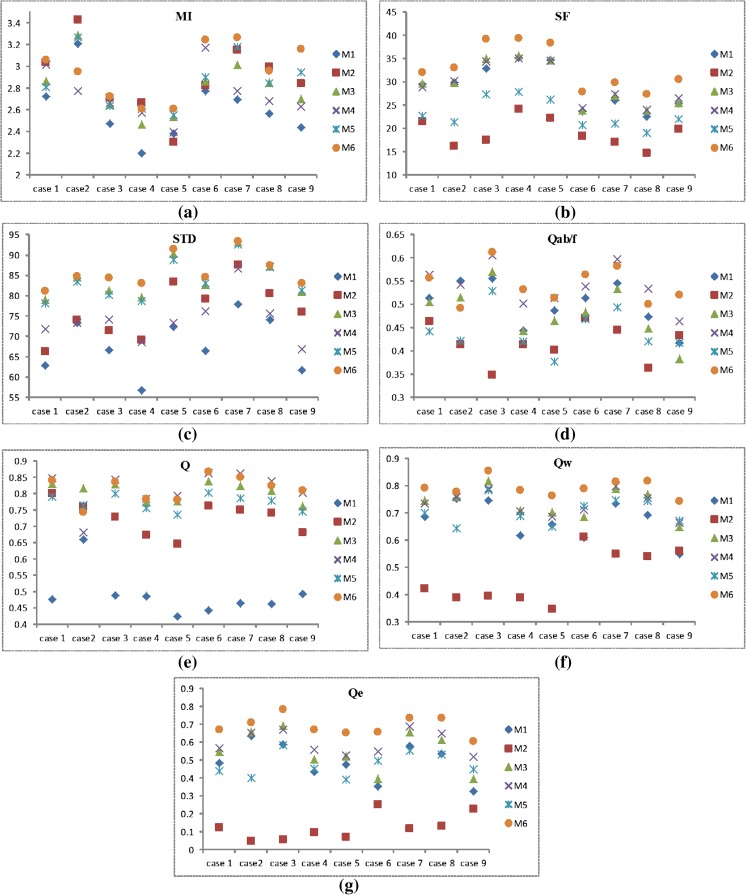
Quantitative comparison of image fusion methods for all 9 cases of CT-MRI images is reported in Fig. 6. The mutual information based quality index (MI) [14] indicates the amount of information contained in the fused image about the source images. The larger the value of MI indicates better fusion quality. Comparison with respect to MI is depicted in Fig. 6a. For most of the cases, proposed method M6 exhibited better performance compared to all other methods with respect to MI. The method M1 showed poor performance with respect to MI. Spatial frequency (SF) index specifies the overall activity of fused image. The proposed method M6 showed superior performance with respect to SF by giving the highest value of SF for all cases compared to other methods as evident from Fig. 6b. M2 showed poor performance in terms of SF.
Fig. 6.
Quantitative evaluation of CT-MRI image fusion results with respect to a mutual information-based index (MI), b spatial frequency (SF), c standard deviation (STD), and d edge information-based index (Qab/f) [33]. UIQI-based indexes [34] e Q, f Qw, and g Qe
The standard deviation (STD) index reveals the clarity of the fused image and the comparison with respect to STD is reported in Fig. 6c. The maximum value of STD is achieved by M6 for all the cases. This implies that the over clarity of fused images by the proposed method is better compared to that of other methods. The edge information-based quality index Qab/f represents the amount of edge details carried from source images to the fused image. It has a dynamic range of 0 to 1. The value 0 indicates the complete loss of edge information. The comparison with respect to Qab/f [33] is shown in Fig. 6d. For most of the cases, proposed method achieved the maximum value compared to other method. This implies that the fused images by proposed have maximum edge information compared to that of other methods. Comparison with respect to UIQI-based indexes Q, Qw, and Qe [34] is shown in Fig. 6e–g, respectively. All these three indexes have dynamic range of 0 to 1. As quality indexes reach 1, fusion quality would be the best. The index Q reveals the amount of salient information transferred from source images without structural distortion in the fused image. Method M4 and M6 showed better performance with respect to this index. The quality index Qw measures the amount salient information by giving more weightage to the perceptually important regions in the image. The quality index Qe gives importance to edge information. The proposed method M6 showed superior performance by achieving the maximum value of Qw and Qe for all cases compared to other methods. The average value of each quality index calculated by considering 9 CT-MRI cases is shown in Table 1. The best value of each quality index is highlighted. From this analysis, it is evident that the proposed method M6 gives superior performance compared to other methods.
Table 1.
Quantitative comparison of CT-MRI image fusion results by different image fusion methods
| Quality index | M1 | M2 | M3 | M4 | M5 | M6 |
|---|---|---|---|---|---|---|
| MI | 2.605 | 2.883 | 2.804 | 2.743 | 2.861 | 2.955 |
| SF | 28.862 | 19.052 | 29.469 | 29.480 | 23.156 | 33.091 |
| STD | 68.000 | 76.402 | 84.335 | 74.037 | 83.680 | 85.907 |
| Qab/f | 0.500 | 0.417 | 0.483 | 0.540 | 0.443 | 0.542 |
| Q | 0.488 | 0.727 | 0.808 | 0.813 | 0.774 | 0.816 |
| Qw | 0.672 | 0.468 | 0.737 | 0.734 | 0.706 | 0.793 |
| Qe | 0.490 | 0.124 | 0.554 | 0.598 | 0.477 | 0.692 |
The best value of respective quality index is in bold entry
SPECT-MRI Image Fusion Results
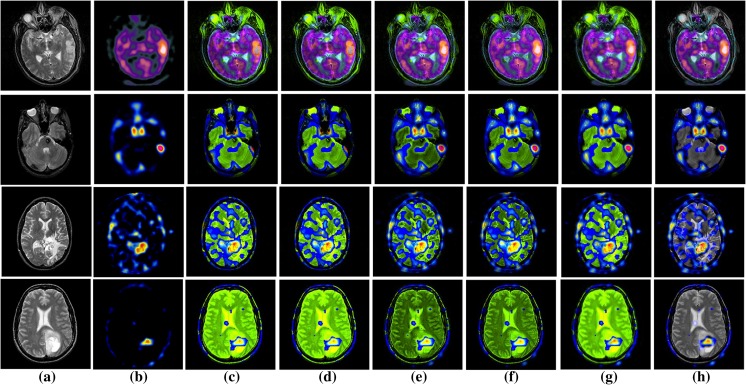
The proposed functional-anatomical image fusion method is tested on 5 SPECT-MRI cases. The first case which is a sub-acute stroke case is reported in Fig. 7. The SPECT image of this case presented in Fig. 7b shows hyper-perfusion in the right posterior parietal. Remaining cases 2 to 5 are presented in Fig. 8a, b. Case 2 is a stroke (aphasia) case. In the MRI image of this case, there are several areas of increased signal abnormality. SPECT image of this case showed the increased uptake of Thallium radioactive tracer representing the acute infraction in the left middle cerebral artery. Case 3 is cavernous hemangioma case in which SPECT images were made with Technetium-labeled red blood cells. Mixed signal in the MRI image of this case represents angiomas. Case 4 is anaplastic astrocytoma case. High tumor Thallium uptake in SPECT image indicates left parietal anaplastic astrocytoma. Case 5 is astrocytoma case in which MRI image shows cystic elements in a left occipital region, and SPECT image obtained with Thallium radioactive tracer shows an anterior border of high uptake. The visual and quantitative analysis of SPECT-MRI fusion results is discussed in the following subsections.
Fig. 7.
SPECT-MRI fusion results of case 1: a MRI image, b SPECT image. Fused image by c m1 [30], d m2 [26], e m3 [16], f m4 [25], g m5 [22], and h the proposed method m6
Fig. 8.
SPECT-MRI fusion results of cases 2 to 5: a MRI images, b SPECT images. Fused images by c m1 [30], d m2 [26], e m3 [16], f m4 [25], g m5 [22], and h proposed method m6
Visual Analysis of SPECT-MRI Fusion Results
SPECT image is a low-resolution pseudocolor image. Different levels of uptake of radioactive tracer are represented with different colors in SPECT image. MRI image is a high-resolution grayscale image presenting the anatomical details. Fused image of SPECT and MRI image should retain all the anatomical details of MRI image without altering the functional content that is without changing the color of SPECT image. Any change in the color of fused image compared to functional image is known as spectral distortion and loss of anatomical details is known as spatial distortion. Fused images of case 1 by different methods are illustrated in Fig. 7. Spectral distortion is evident in the fused images by methods m1 to m5 presented in Fig. 7c–g. The hyper-perfused region is changed to black color in fused images by m1 and m2, which is originally in white color in SPECT image. Non-functional region is presented as green color in fused images by m1 to m5. Because, methods m1 to m5 are based on NIHS color model, in which the changes made in intensity, the component during fusion process affects the spectral content. However, in the fused image by proposed method m6 presented in Fig. 7h retained the functional information. Anatomical details in fused images by m4 and m5 are smoothed. Proposed method m6 presented the anatomical details with good contrast. Fused images of cases 2 to 5 are presented in Fig. 8. Fused images by methods m1 to m5, spectral distortion is evident in non-functional area of SPECT images, whereas, in fused image by proposed method m6 shown in Fig. 8h, pathological tissues and other tissues are presented clearly.
Quantitative Analysis of SPECT-MRI Fusion Results
Quantitative analysis of SPECT-MRI image fusion for the 5 cases is presented in the Table 2. The best value of each quality index in each case is highlighted. To assess the spectral distortion incurred by various image fusion methods, bias index is adapted. Bias measures the absolute difference in the means of fused image and functional image relative to the mean of functional image. Hence, low value of bias indicates that the spectral distortion is low and fusion quality is better. Minimum value of bias is achieved by proposed method m6 for cases 1 to 4. This implies that spectral distortion is less in proposed method compared to other methods. Spatial distortion is quantified by filtered correlation coefficient (FCC) and edge information-based performance index (Qab/f). Proposed method achieved highest values for these quality indexes compared to other methods. This indicates that anatomical details of MRI images are better preserved in proposed compared to others.
Table 2.
Quantitative analysis of SPECT-MRI fusion results by different methods
| Case | Quality index | m1 | m2 | m3 | m4 | m5 | m6 |
|---|---|---|---|---|---|---|---|
| 1 | Bias | 0.907 | 0.906 | 0.771 | 0.859 | 0.782 | 0.742 |
| FCC | 0.695 | 0.696 | 0.671 | 0.699 | 0.513 | 0.782 | |
| Qab/f | 0.508 | 0.514 | 0.486 | 0.482 | 0.413 | 0.539 | |
| 2 | Bias | 1.167 | 1.167 | 0.944 | 0.848 | 1.068 | 0.880 |
| FCC | 0.734 | 0.734 | 0.663 | 0.727 | 0.571 | 0.763 | |
| Qab/f | 0.446 | 0.474 | 0.431 | 0.462 | 0.402 | 0.585 | |
| 3 | Bias | 2.540 | 2.540 | 1.514 | 1.943 | 2.026 | 1.380 |
| FCc | 0.330 | 0.330 | 0.290 | 0.320 | 0.213 | 0.405 | |
| Qab/f | 0.221 | 0.263 | 0.304 | 0.369 | 0.355 | 0.453 | |
| 4 | Bias | 2.786 | 2.786 | 2.070 | 2.100 | 2.373 | 1.749 |
| FCC | 0.339 | 0.339 | 0.303 | 0.410 | 0.210 | 0.499 | |
| Qab/f | 0.233 | 0.256 | 0.287 | 0.346 | 0.355 | 0.464 | |
| 5 | Bias | 29.867 | 29.866 | 17.468 | 20.370 | 29.627 | 19.781 |
| FCC | 0.488 | 0.488 | 0.428 | 0.563 | 0.370 | 0.744 | |
| Qab/f | 0.316 | 0.392 | 0.319 | 0.430 | 0.404 | 0.724 |
The best value of respective quality index is in bold entry
Conclusions
Multimodality medical image fusion method utilizing simplified adaptive PCNN model in NSST domain is proposed. The high directional sensitivity and shift-invariance property of NSST helps in extracting more directional information without introducing artifacts. Directional gradient feature at each location is used as the linking strength of the PCNN at corresponding locations. The adaptive PCNN-processing low-frequency and high-frequency sub-bands are motivated by different features consistent with the characteristics of corresponding sub-bands. The proposed method is compared with five state-of-the-art image fusion methods. A set of nine pairs of CT and MRI neurological images of different pathologies is used for testing the proposed method. Visual analysis of CT and MRI image fusion results proved that the proposed method is able to retain the salient information of CT and MRI images with good contrast compared to other methods. Quantitative comparison with respect to mutual information-based quality index, spatial frequency, standard deviation, edge information-based quality index, and UIQI-based quality indexes proved the superiority of proposed method over other methods.
The proposed method is extended for functional and anatomical image fusion in improved nonlinear IHS (INIHS) color model. INIHS color model does not incur color gamut problem and this helps in retaining the spectral information of functional image in the fusion process. The proposed functional and anatomical image fusion method is compared with five other methods. Set of five SPECT and MRI neurological images is used for testing. Visual analysis of SPECT and MRI fusion results reveal that the fused images by proposed method retain the color information of original images both in pathological regions and normal regions. In case of other methods, hyper-perfused areas and non-functional regions of SPECT images are changed to different colors, which hampers their practical utility for the diagnosis and treatment planning. The quantitative spectral and spatial distortion measures evidenced the superior performance of proposed functional and anatomical image fusion method over other methods. However, the proposed method is tested only on different neurological disorders. Because of the usage of the PCNN in the proposed method, computational complexity is slightly higher.
Acknowledgments
We would like to thank anonymous reviewers for their constructive comments which helped improve the quality of the paper. Also, we would like to thank the Harvard Medical School for providing source images (http://www.med.harvard.edu/aanlib/home.html). This work is funded by the Ministry of Human Resource Development, India.
Contributor Information
Padma Ganasala, Phone: +91-1332-286381, Email: Padma_417@yahoo.co.in.
Vinod Kumar, Email: vinodfee@gmail.com.
References
- 1.Paulino AC, Thorstad WL, Fox T. Role of fusion in radiotherapy treatment planning. Semin Nucl Med. 2003;33:238–243. doi: 10.1053/snuc.2003.127313. [DOI] [PubMed] [Google Scholar]
- 2.Krempien RC, Daeuber S, Hensley FW, Wannenmacher M, Harms W. Image fusion of CT and MRI data enables improved target volume definition in 3D-brachytherapy treatment planning. Brachytherapy. 2003;2:164–171. doi: 10.1016/S1538-4721(03)00133-8. [DOI] [PubMed] [Google Scholar]
- 3.James AP, Dasarathy BV. Medical image fusion: a survey of the state of the art. Inf Fusion. 2014;19:4–19. doi: 10.1016/j.inffus.2013.12.002. [DOI] [Google Scholar]
- 4.Bai X, Gu S, Zhou F, Xue B. Weighted image fusion based on multi-scale top-hat transform: algorithms and a comparison study. Optik - Int J Light Electron Opt. 2013;124:1660–1668. doi: 10.1016/j.ijleo.2012.06.029. [DOI] [Google Scholar]
- 5.Kavitha CT, Chellamuthu C. Medical image fusion based on hybrid intelligence. Appl Soft Comput. 2014;20:83–94. doi: 10.1016/j.asoc.2013.10.034. [DOI] [Google Scholar]
- 6.Li M, Cai W, Tan Z. A region-based multi-sensor image fusion scheme using pulse-coupled neural network. Pattern Recogn. Lett. 2006;27:1948–1956. doi: 10.1016/j.patrec.2006.05.004. [DOI] [Google Scholar]
- 7.Virmani J, Kumar V, Kalra N, Khandelwal N. Neural network ensemble based CAD system for focal liver lesions from B-mode ultrasound. J Digit Imaging. 2014;27:520–537. doi: 10.1007/s10278-014-9685-0. [DOI] [PMC free article] [PubMed] [Google Scholar]
- 8.Wang C, Chen M, Zhao J-M, Liu Y. Fusion of color doppler and magnetic resonance images of the heart. J Digit Imaging. 2011;24:1024–1030. doi: 10.1007/s10278-011-9393-y. [DOI] [PMC free article] [PubMed] [Google Scholar]
- 9.He C, Liu Q, Li H, Wang H. Multimodal medical image fusion based on IHS and PCA. Procedia Eng. 2010;7:280–285. doi: 10.1016/j.proeng.2010.11.045. [DOI] [Google Scholar]
- 10.Baum KG, Schmidt E, Rafferty K, Krol A, Helguera M. Evaluation of novel genetic algorithm generated schemes for positron emission tomography (PET)/magnetic resonance imaging (MRI) image fusion. J Digit Imaging. 2011;24:1031–1043. doi: 10.1007/s10278-011-9382-1. [DOI] [PMC free article] [PubMed] [Google Scholar]
- 11.Zhu Y-M, Nortmann C. Pixel-feature hybrid fusion for PET/CT images. J Digit Imaging. 2011;24:50–57. doi: 10.1007/s10278-009-9259-8. [DOI] [PMC free article] [PubMed] [Google Scholar]
- 12.Easley G, Labate D, Lim W-Q. Sparse directional image representations using the discrete shearlet transform. Appl. Comput. Harmon. Anal. 2008;25:25–46. doi: 10.1016/j.acha.2007.09.003. [DOI] [Google Scholar]
- 13.Lim W-Q. Nonseparable shearlet transform. IEEE Trans Image Process. 2013;22:2056–2065. doi: 10.1109/TIP.2013.2244223. [DOI] [PubMed] [Google Scholar]
- 14.Ganasala P, Kumar V. CT and MR image fusion scheme in nonsubsampled contourlet transform domain. J Digit Imaging. 2014;27:407–418. doi: 10.1007/s10278-013-9664-x. [DOI] [PMC free article] [PubMed] [Google Scholar]
- 15.Chen Y, Xiong J, Liu H-L, Fan Q. Fusion method of infrared and visible images based on neighborhood characteristic and regionalization in NSCT domain. Optik - Int J Light Electron Opt. 2014;125:4980–4984. doi: 10.1016/j.ijleo.2014.04.006. [DOI] [Google Scholar]
- 16.Kong W. Technique for gray-scale visual light and infrared image fusion based on nonsubsampled shearlet transform. Infrared Phys. Technol. 2014;63:110–118. doi: 10.1016/j.infrared.2013.12.016. [DOI] [Google Scholar]
- 17.Wang J, Lai S, Li M. Improved image fusion method based on NSCT and accelerated NMF. Sensors. 2012;12:5872–5887. doi: 10.3390/s120505872. [DOI] [PMC free article] [PubMed] [Google Scholar]
- 18.Kong W, Liu J. Technique for image fusion based on NSST domain improved fast non-classical RF. Infrared Phys. Technol. 2013;61:27–36. doi: 10.1016/j.infrared.2013.06.009. [DOI] [Google Scholar]
- 19.Wang Z, Ma Y, Cheng F, Yang L. Review of pulse-coupled neural networks. Image Vis. Comput. 2010;28:5–13. doi: 10.1016/j.imavis.2009.06.007. [DOI] [Google Scholar]
- 20.Qu X-B, Yan J-W, Xiao H-Z, Zhu Z-Q. Image fusion algorithm based on spatial frequency-motivated pulse coupled neural networks in nonsubsampled contourlet transform domain. Acta Autom. Sin. 2008;34:1508–1514. doi: 10.1016/S1874-1029(08)60174-3. [DOI] [Google Scholar]
- 21.Das S, Kundu M. NSCT-based multimodal medical image fusion using pulse-coupled neural network and modified spatial frequency. Med Biol Eng Comput. 2012;50:1105–1114. doi: 10.1007/s11517-012-0943-3. [DOI] [PubMed] [Google Scholar]
- 22.Kong W, Zhang L, Lei Y. Novel fusion method for visible light and infrared images based on NSST–SF–PCNN. Infrared Phys. Technol. 2014;65:103–112. doi: 10.1016/j.infrared.2014.04.003. [DOI] [Google Scholar]
- 23.Kong W, Liu J. Technique for image fusion based on nonsubsampled shearlet transform and improved pulse-coupled neural network. OPTICE. 2013;52:017001. doi: 10.1117/1.OE.52.1.017001. [DOI] [Google Scholar]
- 24.Wang Z, Ma Y. Medical image fusion using m-PCNN. Inf Fusion. 2008;9:176–185. doi: 10.1016/j.inffus.2007.04.003. [DOI] [Google Scholar]
- 25.Baohua Z, Xiaoqi L, Weitao J. A multi-focus image fusion algorithm based on an improved dual-channel PCNN in NSCT domain. Optik - Int J Light Electron Opt. 2013;124:4104–4109. doi: 10.1016/j.ijleo.2012.12.032. [DOI] [Google Scholar]
- 26.Kong WW. Multi-sensor image fusion based on NSST domain I < sup > 2</sup > CM. Electron. Lett. 2013;49:802–803. doi: 10.1049/el.2013.1192. [DOI] [Google Scholar]
- 27.Wang N, Ma Y, Zhan K. Spiking cortical model for multifocus image fusion. Neurocomputing. 2014;130:44–51. doi: 10.1016/j.neucom.2012.12.060. [DOI] [Google Scholar]
- 28.Wang R, Wu Y, Ding M, Zhang X: Medical image fusion based on spiking cortical model. City
- 29.Wang QL. Nonseparable shearlet transform. IEEE Trans. Image Process. 2013;22:2056–2065. doi: 10.1109/TIP.2013.2244223. [DOI] [PubMed] [Google Scholar]
- 30.Tu T-M, Su S-C, Shyu H-C, Huang PS. A new look at IHS-like image fusion methods. Inf Fusion. 2001;2:177–186. doi: 10.1016/S1566-2535(01)00036-7. [DOI] [Google Scholar]
- 31.Bhatnagar G, Wu QMJ, Zheng L. Directive contrast based multimodal medical image fusion in NSCT domain. IEEE Trans. Multimedia. 2013;15:1014–1024. doi: 10.1109/TMM.2013.2244870. [DOI] [Google Scholar]
- 32.Chun-Liang C, Wen-Hsiang T. Image fusion with no gamut problem by improved nonlinear IHS transforms for remote sensing. IEEE Trans. Geosci. Remote Sens. 2014;52:651–663. doi: 10.1109/TGRS.2014.2313558. [DOI] [Google Scholar]
- 33.Xydeas CS, Petrović V. Objective image fusion performance measure. Electron. Lett. 2000;36:308–309. doi: 10.1049/el:20000267. [DOI] [Google Scholar]
- 34.Piella G, Heijmans H: A new quality metric for image fusion. Proc Image Processing, 2003 ICIP 2003 Proceedings 2003 International Conference on: City, 2003, 14–17
- 35.Zhou W, Bovik AC. A universal image quality index. IEEE Signal Process Lett. 2002;9:81–84. doi: 10.1109/97.995823. [DOI] [Google Scholar]
- 36.Myungjin C, Rae Young K, Myeong-Ryong N, Hong Oh K. Fusion of multispectral and panchromatic satellite images using the curvelet transform. IEEE Geosci Remote Sens Lett. 2005;2:136–140. doi: 10.1109/LGRS.2005.845313. [DOI] [Google Scholar]


