

Abstract
Objective
Despite the proliferation of databases with increasingly rich patient data, prediction of medication adherence remains poor. We proposed and evaluated approaches for improved adherence prediction.
Data Sources
We identified Medicare beneficiaries who received prescription drug coverage through CVS Caremark and initiated a statin.
Study Design
A total of 643 variables were identified at baseline from prior claims and linked Census data. In addition, we identified three postbaseline predictors, indicators of adherence to statins during each of the first 3 months of follow‐up. We estimated 10 models predicting subsequent adherence, using logistic regression and boosted logistic regression, a nonparametric data‐mining technique. Models were also estimated within strata defined by the index days supply.
Results
In 77,703 statin initiators, prediction using baseline variables only was poor with maximum cross‐validated C‐statistics of 0.606 and 0.577 among patients with index supply ≤30 days and >30 days, respectively. Using only indicators of initial statin adherence improved prediction accuracy substantially among patients with shorter initial dispensings (C = 0.827/0.518), and, when combined with investigator‐specified variables, prediction accuracy was further improved (C = 0.842/0.596).
Conclusions
Observed adherence immediately after initiation predicted future adherence for patients whose initial dispensings were relatively short.
Keywords: Adherence, boosting, comparative effectiveness, epidemiologic methods, prediction
Improving medication adherence, or the degree to which patients take medications as prescribed by their health care providers, has the potential to greatly improve the performance of the health care system. Poor adherence has been documented across the spectrum of chronic disease (Caro et al. 1999; Osterberg and Blaschke 2005; Solomon et al. 2005; Brookhart et al. 2007) and is associated with adverse health outcomes and higher health care costs (Choudhry et al. 2008). The most effective interventions to improve adherence rely on a resource‐intensive mix of strategies that simultaneously promote patient adherence and address the many potential barriers to adherence (Haynes et al. 2008; Dean, Walters, and Hall 2010; Morgado et al. 2011; Ogedegbe et al. 2012). If patients who are most likely to be nonadherent could be accurately identified and targeted, the efficiency of these interventions could be increased (Cutrona et al. 2012).
Despite the proliferation of health care claims databases with increasingly rich patient data, prediction of future medication adherence remains poor. Traditional approaches have focused on a limited number of investigator‐specified clinical and demographic characteristics available at the time of treatment initiation. For example, age, race, socioeconomic status, the presence of psychological problems or cognitive impairment, and the complexity of the patient's treatment regimen have been shown to be predictive of future adherence (Mann et al. 2010; Choudhry et al. 2011; Gellad, Grenard, and Marcum 2011). While many of these variables are correlated with adherence, they provide weak discrimination between adherers and nonadherers (Osterberg and Blaschke 2005; Steiner 2010). As a result, the best published adherence‐prediction models from claims data for new medication initiators have not reached even a moderate C‐statistic of 0.65 (Steiner et al. 2009; Chan et al. 2010; Carroll et al. 2012). In contrast, prediction of adherence among prevalent users using prior refill adherence has provided discrimination accuracy up to 0.79 (Molfenter et al. 2012).
In this paper, we introduce and evaluate three categories of adherence predictors that may provide improved prediction in new initiators of statins. First, we incorporate linked Census data to capture socioeconomic information from the patients' zip code of residence. Second, we utilize the high‐dimensional propensity score (hd‐PS) variable selection algorithm to empirically identify a large number of potential adherence predictors from medical and pharmacy claims (Schneeweiss et al. 2009; Rassen et al. 2011). Third, we explore the impact of initial observations of medication filling behavior on future adherence, similar to the use of past refills to predict adherence among prevalent users. We compare these predictors with traditional predictors derived from claims data.
We further enhance our prediction models with generalized boosting techniques to evaluate whether these offer benefits over standard logistic regression. Boosting is one of many machine learning methods that may improve predictive accuracy in “big data” scenarios (i.e., many predictors and/or many observations) such as claims data (Friedman 2001; Varian 2014). Machine learning methods can improve prediction through automatic variable selection and through identification of nonlinear associations between predictors and outcome or deep interactions among predictors, which may be useful for modeling a behavior as complex as medication adherence. We evaluate the impact of new variables and enhanced prediction approaches on model discrimination using the cross‐validated C‐statistic that quantifies model prediction accuracy as applied to a new set of patients (Efron and Gong 1983).
Methods
Cohort
We created a cohort of Medicare beneficiaries aged 65 and older with prescription drug coverage through CVS Caremark, a U.S. pharmacy benefits management company with nation‐wide coverage. Diagnostic, health care utilization, and demographic data from Medicare Parts A and B and enrollment files were linked to Caremark prescription drug claims (Polinski et al. 2011). Within this cohort, we selected patients who newly initiated a statin or statin combination drug between January 1, 2006, and December 31, 2008, and defined the index date as the date of the first prescription filled for any statin with no use of statins in the prior 180 days. Patients were required to have continuous enrollment in both Medicare and Caremark for 180 days before the index date to ensure no prior statin use during this period. To ensure active benefit use, we required that patients have at least one drug dispensing claim and at least one health care claim in the 6 months prior to their index fill. Patients were required to have at least 1 year of continuous eligibility postindex fill and were excluded if they lost Medicare or Caremark eligibility, experienced a hospitalization lasting >14 days, entered hospice or a nursing home, or died prior to 365 days of follow‐up. The institutional review board of Brigham and Women's Hospital approved the study.
Adherence Measures
We followed patients and recorded fills for prescriptions of any statin or statin combination for 1 year following the index date. For each patient, we created a “supply diary” that indicates whether each day was covered with medication by linking all observed statin fills based on the dispensing date and the days' supply. Based on the supply diary, we calculated the proportion of days covered (PDC) during two potential follow‐up periods: (1) the 365 days following the index date and (2) days 91–365 after index. We refer to these measures as “1‐year adherence” and “delayed adherence,” respectively. The second measure excludes the first 3 months after initiation because adherence during those months will be utilized as predictors in some models, as described in the next section. For each measure, we defined “full adherence” as a PDC ≥0.8, which corresponds to the level of use above which patients with coronary artery disease benefit from statins (Choudhry et al. 2014), and the threshold employed by most quality measures (Centers for Medicare and Medicaid Services 2013; National Committee for Quality Assurance 2014). One‐year PDC, while potentially an incomplete picture of patient behavior, remains the most common benchmark measure that is likely to be targeted by pharmacies, payers, and other health care providers when implementing interventions to improve adherence. In addition, PDC has been shown to perform similarly to the other most commonly used adherence measures such as medication possession ratio or continuous measure of medication gaps, and we would not expect performance to differ meaningfully with the use of these methods (Karve et al. 2008, 2009).
Predictors of Adherence
Investigator‐Specified Variables
We defined 35 clinically relevant characteristics using Medicare enrollment files and medical and pharmacy claims incurred during the 180 days before the index date (Benner et al. 2002; Chan et al. 2010; Mann et al. 2010; Kulik et al. 2011). Demographic information included age, sex, and race. Clinical characteristics included prior medication use and comorbidities likely to influence adherence to a cardiovascular medication. All investigator‐specified predictors are listed in Table 1.
Table 1.
Cohort Characteristics by Length of the Index Prescription
| ≤30 Day Supply | >30 Day Supply | |
|---|---|---|
| Full adherence: 1–365 | 39.09 | 48.07 |
| Full adherence: 91–365 | 37.82 | 41.70 |
| Age (mean) | 74.71 | 74.27 |
| Female | 61.15 | 55.42 |
| Race | ||
| White | 57.99 | 71.68 |
| Black | 8.98 | 4.77 |
| Other/unknown | 33.03 | 23.55 |
| Index statin | ||
| Atorvastatin calcium | 34.71 | 46.93 |
| Fluvastatin sodium | 1.01 | 1.50 |
| Lovastatin | 6.14 | 4.10 |
| Pravastatin sodium | 7.20 | 7.78 |
| Rosuvastatin calcium | 11.26 | 10.24 |
| Simvastatin | 38.68 | 29.44 |
| High‐intensity dose | 28.99 | 29.61 |
| Count of health services (mean) | ||
| Cardiovascular diagnoses | 4.28 | 3.47 |
| Charlson score | 1.47 | 1.21 |
| Hospitalizations | 0.29 | 0.14 |
| Total hospital LOS | 1.80 | 0.79 |
| Physician visits | 4.12 | 4.41 |
| Distinct drugs | 8.37 | 7.81 |
| Revascularization | 5.86 | 1.71 |
| Postsurgical aortocoronary bypass | 4.23 | 4.09 |
| Recent CABG | 1.72 | 0.45 |
| Prior CABG | 4.35 | 4.21 |
| Angina | 9.32 | 5.48 |
| Atrial fibrillation | 3.05 | 1.41 |
| Chest pain | 21.94 | 14.07 |
| Congestive heart failure | 11.77 | 7.17 |
| Hypertension | 74.16 | 69.89 |
| Ischemic heart disease | 10.55 | 7.62 |
| Recent MI | 4.03 | 0.87 |
| Prior MI | 3.86 | 3.14 |
| Peripheral vascular disease | 2.06 | 1.37 |
| Stroke | 3.25 | 1.00 |
| Transient ischemic attack | 3.92 | 2.35 |
| COPD | 4.04 | 2.83 |
| Alzheimer's | 4.67 | 2.40 |
| Depression | 4.81 | 3.08 |
| Cancer | 15.76 | 18.74 |
| Diabetes mellitus | 36.66 | 34.02 |
| Kidney disease | 5.78 | 4.35 |
| End‐stage renal disease | 0.86 | 0.52 |
All values are proportions unless otherwise specified.
Census Variables
We used the patients' zip code of residence to link to 2000 Census data on 158 local sociodemographic measures, such as the proportion of residents in the zip code with a college degree and the total retail expenditures in the zip code. Unlike variables derived from health care claims, Census data can provide proxy information on patient income, education, and resources, important indicators of access to health care services including medications. In addition to the basic set of Census variables, we transformed and combined some variables to create additional predictors; for example, we created a variable measuring the average number of vehicles per household by dividing the total number of vehicles in the zip code by the number of households. This process created an additional 50 variables for a total of 208 potential predictors from census data.
Hd‐PS Variables
To facilitate more complete utilization of available claims for adherence prediction, we applied the hd‐PS variable selection algorithm (Schneeweiss et al. 2009; Rassen et al. 2011). As the name suggests, hd‐PS was originally developed for creating and selecting claims‐based variables for inclusion in a propensity score model to adjust for confounding in comparative effectiveness studies. The algorithm screens thousands of diagnosis, procedure, and medication codes for an empirical association with the exposure, and the top 300–500 are selected with the expectation that these variables can collectively proxy for unmeasured confounders. In empirical examples, hd‐PS has been shown to improve confounding control over investigator‐specified variable selection (Schneeweiss et al. 2009; Rassen et al. 2011).
To our knowledge, hd‐PS has not been used in prediction, but we similarly sought to identify a large collection of variables that are associated with medication adherence and can potentially proxy for underlying behavioral constructs that may be predictive of adherence. Accordingly, we ran hd‐PS using the indicator of full 1‐year adherence as the dependent variable and selected the 400 variables with the strongest associations. All hd‐PS variables were based on claims in the 180 days prior to statin initiation.
Postbaseline Adherence
We also created three indicator variables (PDC ≥0.8 or ≥24 days covered, equivalently) to capture initial medication filling during each of the first three 30‐day periods after initiation. We hypothesized that early medication filling behavior would be a strong indicator of patient intention and activation to use the prescribed medication, as measures of past refill behavior have been shown to predict medication adherence in prevalent users (Molfenter et al. 2012). Figure 1 shows temporal alignment of all predictors and follow‐up.
Figure 1.
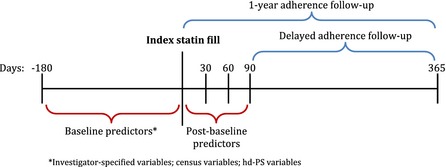
Study Design
Prediction Models
For each of the two adherence measures under consideration, we estimated 10 prediction models in the full cohort and in strata based on the days supply of the index statin prescription (≤30 days vs. >30 days). All prediction and evaluation was performed in R, Version 3.0.1 (Vienna, Austria). Models 1–5, as described in Table 2, utilized baseline predictors only (investigator‐specified, census, and hd‐PS variables), while models 6–10 included the postbaseline indicators of initial adherence as predictors. Specifically, in models 1–4, we used ordinary logistic regression, and all predictors were included as ordinary linear terms. Interactions were not considered. Model 6 included only the three initial adherence variables and their interactions, model 7 additionally included the investigator‐specified variables, and model 9 included all potential predictors. Models 4, 7, and 9 were reestimated (in models 5, 8, and 10, respectively) using the generalized boosting algorithm, as implemented in the R package gbm (Ridgeway 2007). These models included the best‐performing model from logistic regression (model 7) and the models with the largest predictor sets (models 4 and 9).
Table 2.
Cross‐Validated C‐Statistics from 10 Models Measuring Prediction Accuracy for Full Adherence during Days 1–365 (1‐Year Adherence) or 91–365 (Delayed Adherence) after Statin Initiation
| Model | Predictors | Estimation | All Patients | ≤30 Days Supply | >30 Days Supply | |||
|---|---|---|---|---|---|---|---|---|
| 1–365 | 91–365 | 1–365 | 91–365 | 1–365 | 91–365 | |||
| 1 | IS | Logistic | 0.589 | 0.588 | 0.603 | 0.600 | 0.577 | 0.575 |
| 2 | IS+ census | Logistic | 0.595 | 0.592 | 0.606 | 0.604 | 0.576 | 0.573 |
| 3 | IS+ hd‐PS | Logistic | 0.588 | 0.586 | 0.601 | 0.597 | 0.566 | 0.573 |
| 4 | All baseline | Logistic | 0.593 | 0.590 | 0.603 | 0.600 | 0.573 | 0.571 |
| 5 | All baseline | Boosted | 0.594 | 0.591 | 0.608 | 0.603 | 0.571 | 0.569 |
| 6 | Postbaseline | Logistic | 0.707 | 0.671 | 0.827 | 0.786 | 0.518 | 0.515 |
| 7 | Postbaseline + IS | Logistic | 0.748 | 0.716 | 0.842 | 0.803 | 0.596 | 0.590 |
| 8 | Postbaseline + IS | Boosted | 0.749 | 0.715 | 0.841 | 0.802 | 0.595 | 0.589 |
| 9 | All predictors | Logistic | 0.735 | 0.703 | 0.819 | 0.782 | 0.591 | 0.585 |
| 10 | All predictors | Boosted | 0.749 | 0.714 | 0.841 | 0.802 | 0.591 | 0.583 |
IS, investigator‐specified.
The boosting algorithm has been used frequently in health care research from administrative databases (Robinson 2008; Koh and Tan 2011) and is considered one of the best data‐mining approaches for general prediction problems (Hastie et al. 2009). The algorithm creates a prediction model by building many small regression trees that are weak predictors independently, but collectively can provide highly accurate classification (Friedman 2001), and has several features that are potentially advantageous in the prediction of adherence (Varian 2014). First, because the algorithm is based on regression trees, it automatically incorporates nonlinear associations between predictors and outcome, as well as deep interactions, as specified by the user. In addition, the process of model building provides automatic variable selection, as variables that are not utilized in any regression trees are effectively excluded from the model. Finally, the boosting algorithm includes several built‐in protections from model overfitting. In this analysis, we used standard default values for tuning parameters, an interaction depth of 5, and 15,000 regression trees to identify the optimal model (Friedman 2001).
Evaluation of Prediction Models
Prediction models were evaluated with respect to their ability to discriminate between patients who did and did not become nonadherent, as measured by the C‐statistic. A C‐statistic can be interpreted as the probability that for any pair of randomly chosen cases and controls (adherent and nonadherent patients) the predicted probability from the model will be higher for the case than for the control (Harrell, Lee, and Mark 1996). This measure ranges from 0.5 to 1.0, corresponding to a completely noninformative model (a case has a 50 percent chance of having a higher predicted probability than a randomly selected control) and perfect prediction, respectively. The practical meaning of a model C‐statistic depends on how the predictions are used, but a model with higher C‐statistic will generally lead to more accurate patient targeting, for example, a higher sensitivity and specificity when labeling patients as likely adherent or not.
To avoid the “over optimism” bias associated with evaluating model prediction accuracy in the same data that was used to estimate the model, we performed 10‐fold cross‐validation (Steyerberg et al. 2001). In this method, the cohort was randomly partitioned into 10 samples of approximately equal size. In the first cross‐validation fold, the first sample was set aside, and the remaining nine were used for model estimation. The estimated model was then applied to the data from the first sample (that was excluded from model estimation) and predictions were generated. This process was repeated for each of the 10 samples until every patient had a prediction that was generated without the use of his data in model estimation. These cross‐validated predictions were then compared with the relevant adherence measure to calculate a single cross‐validated C‐statistic. The statistical significance of differences in predictive accuracy across models was assessed via tests of the net reclassification index (NRI) (Pencina, D'Agostino, and Vasan 2008).
Results
Patient Characteristics
We identified 77,703 statin initiators who met all inclusion criteria, of whom 45,251 had an initial prescription length of ≤30 days and 32,452 had an initial prescription lasting more than 30 days (flowchart available in Web Appendix). Table 1 presents the predefined characteristics of these patients. The average age of 74 years was similar regardless of the length of the index statin prescription, but patients receiving a shorter initial prescription were more likely to be female or non‐white and less likely to initiate atorvastatin. Patients receiving shorter initial prescriptions also had on average higher health services and comorbidity counts and a higher likelihood of almost all comorbidities and procedures, both cardiovascular and noncardiovascular. As expected, patients with shorter initial prescriptions were less likely to be fully adherent over 1 year of follow‐up; we observed 39 percent versus 48 percent full adherence among patients with shorter versus longer index prescriptions, respectively.
The Census variables and hd‐PS variables used in prediction modeling are listed in the Web Appendix. The highest ranked hd‐PS variables included indicators for frequent nursing home diagnoses of hemiplegia, lower limb amputation, and unspecified bipolar disorder, all of which were associated with better adherence.
Prediction Accuracy
Table 2 reports the cross‐validated prediction accuracy, quantified by the C‐statistic, for all 10 models under consideration in each cohort and for each potential adherence measure. In models that utilized only baseline predictors, including investigator‐specified, Census, and hd‐PS selected variables, prediction was poor. The maximum observed C‐statistic in these models was 0.606, corresponding to Model 2 predicting 1‐year adherence among patients with index prescriptions ≤30 days. This model utilized only investigator‐specified and Census predictors and was estimated via logistic regression. Prediction was generally worse for all models that incorporated the hd‐PS selected predictors. As expected, prediction was also slightly worse when predicting delayed adherence, beginning on day 91 after index, or when predicting within the cohort of patients that received longer index statin prescriptions.
Utilization of the postbaseline indicators of initial adherence in Models 6–10 greatly improved predictions over the baseline‐only models. The maximum C‐statistic observed in these models was 0.842, corresponding to Model 7 predicting 1‐year adherence among patients with index prescriptions ≤30 days. This model utilized only the initial adherence indicators and baseline predefined characteristics. Discrimination was nearly as strong when utilizing the postbaseline variables alone (C = 0.827). Prediction was not improved through the use of boosting techniques or through inclusion of census or hd‐PS predictors. As with Models 1–5, prediction was slightly worse when predicting delayed adherence. However, when using postbaseline predictors, prediction was significantly worse in the cohort of patients with index supply >30 days. The majority of these patients received 90 days at index and therefore has complete coverage during the first 3 months after initiation. The improvement in classification from Models 2, 4, 7, and 9 over Model 1 was highly statistically significant in all analyses (p < .001).
The results from the best‐performing model (Model 7) predicting 1‐year adherence are given in Table 3, stratified by index days supply. Coverage during each of the first 3 months following initiation was strongly associated with adherence and, among patients with short initial dispensings, had odds ratios of 10.0 (95 percent confidence interval: 3.2—60.4), 49.3 (9.8—364.6), and 80.6 (22.2—519.2) for coverage during the first, second, and third months, respectively. The associations were weaker among patients with longer initial dispensings, but still much stronger than the effects of any investigator‐specified variables. All model terms that included the postbaseline indicator for the first month following index were dropped from the model in these patients, as they all were completely covered during the first month by definition.
Table 3.
Odds Ratio and 95% Confidence Intervals from Model 7, Applied to Predicting 1‐Year Adherence, Separately within Each Stratum of Days Supply. Model 7 Contained Postbaseline Adherence Indicators and Investigator‐Specified Variables
| ≤30 Day Supply | >30 Day Supply | |
|---|---|---|
| Adherent month 1 | 10.01 (3.21, 60.43) | – |
| Adherent month 2 | 49.30 (9.79, 364.55) | 4.65 (2.82, 8.21) |
| Adherent month 3 | 80.58 (22.19, 519.23) | 18.75 (10.16, 36.3) |
| Interaction months 1, 2 | 0.14 (0.02, 0.72) | – |
| Interaction months 1, 3 | 0.15 (0.02, 0.55) | – |
| Interaction months 2, 3 | 0.11 (0.01, 0.70) | 0.22 (0.11, 0.42) |
| Interaction months 1, 2, 3 | 4.10 (0.67, 34.39) | – |
| Male gender | 1.11 (1.05, 1.17) | 1.14 (1.09, 1.19) |
| Age | 1.01 (1.00, 1.01) | 1.00 (0.99, 1.00) |
| Race | ||
| White | 1.12 (1.06, 1.19) | 1.06 (1.01, 1.13) |
| Asian | 1.02 (0.82, 1.27) | 0.80 (0.60, 1.05) |
| Black | 0.73 (0.66, 0.80) | 0.59 (0.52, 0.66) |
| Hispanic | 0.62 (0.50, 0.76) | 0.66 (0.49, 0.90) |
| Native American | 0.86 (0.61, 1.22) | 1.29 (0.80, 2.10) |
| Other | 0.77 (0.60, 0.98) | 0.73 (0.56, 0.93) |
| Unknown | 1.01 (0.33, 2.98) | 1.35 (0.50, 3.75) |
| Health service utilization | ||
| Number of cardiovascular diagnoses | 1.01 (1.01, 1.02) | 1.02 (1.01, 1.03) |
| Charlson comorbidity score | 1.00 (0.97, 1.02) | 1.00 (0.98, 1.03) |
| Number of hospitalizations | 0.99 (0.92, 1.06) | 0.90 (0.81, 0.99) |
| Total hospitalization LOS (days) | 1.00 (0.99, 1.01) | 1.01 (1.00, 1.02) |
| Number of physician office visits | 0.98 (0.98, 0.99) | 0.99 (0.98, 1.00) |
| Number of medications | 1.02 (1.01, 1.02) | 1.03 (1.02, 1.03) |
| Index statin | ||
| High‐intensity dose | 0.84 (0.79, 0.89) | 0.73 (0.69, 0.77) |
| Branded drug | 0.79 (0.74, 0.84) | 0.82 (0.76, 0.88) |
| Generic name (ref = atorvastatin) | ||
| ezetimibe/simvastatin | 0.90 (0.83, 0.98) | 1.10 (1.01, 1.18) |
| fluvastatin | 0.96 (0.74, 1.23) | 1.31 (1.08, 1.58) |
| lovastatin | 0.87 (0.75, 1.02) | 1.15 (0.99, 1.35) |
| pravastatin | 0.91 (0.79, 1.04) | 1.29 (1.14, 1.45) |
| rosuvastatin | 0.91 (0.84, 0.99) | 0.89 (0.82, 0.96) |
| simvastatin | 1.02 (0.90, 1.15) | 1.16 (1.04, 1.29) |
| Acute coronary syndrome | 1.05 (0.85, 1.29) | 0.82 (0.59, 1.14) |
| Revascularization | 1.04 (0.89, 1.22) | 1.55 (1.21, 1.99) |
| Prior CABG | 0.78 (0.40, 1.55) | 2.26 (1.11, 4.95) |
| Recent CABG | 1.04 (0.85, 1.28) | 0.80 (0.54, 1.17) |
| Angina | 0.88 (0.72, 1.08) | 1.10 (0.78, 1.54) |
| Atrial fibrillation | 0.96 (0.83, 1.11) | 1.15 (0.93, 1.42) |
| Chest pain | 0.91 (0.85, 0.97) | 0.93 (0.86, 1.00) |
| Congestive heart failure | 1.00 (0.92, 1.10) | 1.06 (0.95, 1.17) |
| Prior congestive heart failure | 0.94 (0.75, 1.18) | 0.77 (0.55, 1.08) |
| Coronary atherosclerosis | 1.05 (0.99, 1.12) | 1.03 (0.97, 1.09) |
| Disorders of lipid metabolism | 1.04 (0.98, 1.10) | 1.14 (1.08, 1.21) |
| Hypertension | 1.05 (0.99, 1.11) | 1.10 (1.04, 1.17) |
| Ischemic heart disease | 1.04 (0.94, 1.14) | 1.00 (0.91, 1.10) |
| Recent MI | 1.19 (0.99, 1.44) | 1.29 (0.91, 1.82) |
| Prior MI | 0.86 (0.29, 2.40) | 3.45 (0.75, 24.31) |
| Palpitations | 0.83 (0.73, 0.94) | 0.89 (0.79, 1.01) |
| Peripheral vascular disease | 1.02 (0.86, 1.20) | 1.12 (0.92, 1.37) |
| Postsurgical aortic coronary bypass | 1.21 (0.60, 2.38) | 0.42 (0.19, 0.87) |
| Stroke | 1.11 (0.95, 1.29) | 1.09 (0.85, 1.4) |
| Transient ischemic attack | 0.99 (0.86, 1.12) | 1.10 (0.94, 1.29) |
| COPD | 0.93 (0.82, 1.06) | 0.76 (0.66, 0.87) |
| Alzheimer's | 1.15 (1.02, 1.29) | 1.03 (0.89, 1.20) |
| Depression | 0.97 (0.87, 1.09) | 0.99 (0.87, 1.13) |
| Cancer | 1.06 (0.98, 1.15) | 0.99 (0.93, 1.06) |
| HIV | 0.47 (0.17, 1.22) | 0.52 (0.16, 1.49) |
| Diabetes | 1.03 (0.97, 1.09) | 1.00 (0.95, 1.06) |
| Kidney disease | 1.10 (0.96, 1.26) | 1.00 (0.87, 1.15) |
| Dialysis | 0.70 (0.43, 1.15) | 1.29 (0.68, 2.47) |
| End‐stage renal disease | 0.91 (0.65, 1.28) | 0.66 (0.45, 0.96) |
Figure 2 presents adherence outcomes for each unique postbaseline adherence pattern separately by index days supply. Among patients with ≤30 days index supply, 39 percent had full adherence during each of the first 3 months; within this group, 72 percent went on to have full adherence during the year of follow‐up and 66 percent had full adherence during days 91–365. Among patients with >30 days index supply, 96 percent had complete coverage during each of the first 3 months, but only 49 percent went on to have full 1‐year adherence. Based on these results, a prediction rule that identified patients as adherent if they had full coverage during months 2 and 3 (patterns 1 and 5) and nonadherent otherwise (patterns 2–4 and 6–8) would have a positive predictive value (PPV) of 72 percent and a negative predictive value (NPV) of 82 percent in patients with initial prescriptions of ≤30 days. Alternatively, if predictions were needed sooner (60 days after initiation), one could use a prediction rule that depended only on coverage during month 2 (patterns 1–2 and 5–6 vs. patterns 3–4 and 7–8). This rule would have a PPV of 62 percent and a NPV of 84 percent.
Figure 2.
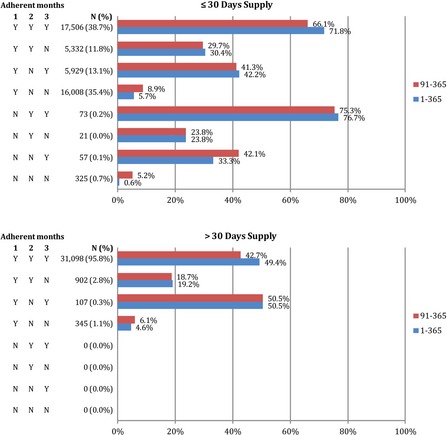
The Number of Patients with Each Initial Adherence Pattern and the Percent of Patients with Each Pattern That Were Fully Adherent during Days 1–365 (1‐year Adherence) or 91–365 (Delayed Adherence) after Statin Initiation, Separately by Index Days Supply
Discussion
In this large cohort of statin initiators, we found that a simple strategy using patterns of medication‐filling shortly after patients initiated therapy provided predictions of 1‐year adherence that were highly accurate and had substantially better discriminative ability than approaches using clinically relevant or advanced variable selection and modeling techniques. In particular, among patients with initial statin dispensings of 30 days or less, failing to refill in the second and third months after initiation was highly predictive of poor adherence over the year. Prediction accuracy was improved slightly when investigator‐specified clinical characteristics were added to initial adherence pattern predictors, but prediction was not improved through the use of area‐level socioeconomic data from Census linkage, hd‐PS variable selection from health care claims, or the nonparametric boosted data mining algorithm. Among patients with initial statin dispensings of more than 30 days, adherence prediction was poor in all models considered.
These results confirm prior research that found the accuracy of adherence predictions for medication initiators from baseline claims and enrollment data to be poor (Steiner et al. 2009; Chan et al. 2010; Carroll et al. 2012). The C‐statistics observed in our models containing baseline data only were generally slightly lower, possibly due to the fact that previously reported C‐statistics did not utilize a validation approach and therefore were likely overly optimistic. Our findings also support the conclusion that medication adherence is a complex behavior that cannot be explained well by health system use and disease state information recorded in claims or by local socioeconomic status. As a result, analytic techniques that rely on variables of this type, regardless of how well they are selected, are unlikely to make prediction substantially more accurate. In contrast, initial filling directly measures patient commitment and ability to access the medication and better predicts future adherence. This improved prediction can be applied to better target interventions to patients who are likely to be nonadherent, providing more efficient use of resources.
When exploring the relative contribution of each set of variables to adherence prediction, we generally used ordinary logistic regression with simple linear terms for all variables and no interactions. For the best‐performing model that utilizes initial adherence patterns and investigator‐specified characteristics, prediction accuracy may be further improved by extending the model to account for select interactions and the potentially nonlinear association between age and adherence that has been documented in other studies (Curtis et al. 2009). However, we reestimated this model with boosted regression that automatically incorporates nonlinear and interaction terms, and discrimination did not improve.
The boosting algorithm also provides automatic variable selection, as variables are incorporated into the model through inclusion in one of the regression trees, which are selected to maximize the improvement in prediction. In the all predictors model (Model 10) estimated within the cohort with longer index dispensings, the boosted algorithm on average selected 305 of the 643 potential baseline predictors, although that varied slightly across cross‐validation folds. Despite this reduced predictor space and the boosting algorithm's other built‐in protections, overfitting was still likely the source of its poor performance in patients with index supply of greater than 30 days. Other data mining approaches, such as random forests (Breiman 2001), model‐based boosting (Hothorn and Bühlmann 2006), or support vector machines (Cortes and Vapnik 1995) could provide better performance, as the relative performance of these methods is problem‐specific (Hastie et al. 2009).
In the logistic models, we did not pursue additional variable selection within each set of potential predictors. For example, we could have used a backward step‐wise selection approach (Beale, Kendall, and Mann 1967) or LASSO regression (Tibshirani 1996) to identify a subset of the 208 Census variables that were most predictive. This process would have certainly produced a more parsimonious model but would not necessarily improve prediction, as important predictors could be selected out of the model. A better approach to selecting variables that maximize model discrimination would be to utilize the existing cross‐validation framework and perform an all‐subset regression, where a separate model is estimated with every possible subset of the potential predictors and the cross‐validated C‐statistic is compared to choose the best model. This process would have been prohibitively time‐consuming with all 643 potential predictors in our study, but a focused search within the 35 predefined characteristics may be feasible and further improve prediction over our best‐performing model.
Our study was restricted to patients who demonstrated active use of the health care system and who remained enrolled in both Medicare and their Part D drug plan for 180 days before and 365 days after their initial statin dispensing. This group may not be representative of all statin initiators in Medicare, as the patients in our study maintained stable drug coverage for at least 18 months. Therefore, adherence may be better in this group, and results may not be generalizable to all Medicare patients. Prediction performance observed in our study may also not hold in a younger, working population receiving statins or when predicting adherence to other chronic disease medications.
This study focused on predicting adherence as measured in pharmacy claims data, which may misclassify the adherence of patients who fill prescriptions but do not actually take them. This misclassification was apparent when attempting to utilize initial adherence patterns to predict future adherence among patients who filled initial statin prescriptions of longer than 30 days. The majority of these patients received a supply of 90 days, so that they were fully covered during each of the first 3 months, regardless of whether they took the medication. In contrast, patients with 30‐day prescriptions had to return to the pharmacy and refill each month to maintain full coverage, representing a stronger likelihood of taking medication as prescribed. Therefore, we expect this issue to be of less practical importance in patients with short, frequent dispensings and as the period of adherence follow‐up is lengthened. An alternative prediction rule for patients with 90‐day index dispensings would be to follow patients until shortly after the end of days supply for the index prescription and observe the presence or absence of a refill. This may provide better predictions for patients in this group.
Similarly, in patients with 30‐day index dispensings, we may significantly shorten the time until predictions can be made by focusing on refilling behavior at the end of the index days supply. For example, reaching 80 percent coverage each month requires no gaps of 6 days or more. Thus, a prediction rule that flags patients for intervention at the first gap of 6 days may provide similar accuracy that does not require waiting a full 90 days after initiation. Predictions available at or near the time of medication initiation are more useful, as at this time, patients are most likely to be interacting with providers and therefore may be most susceptible to intervention.
Based on these results, initial adherence patterns to statins may provide a useful prediction tool for targeting patients with adherence interventions. In addition to being the most accurate of the approaches considered, basing predictions on initial observations of adherence was also by far the simplest. Because predictions are based on just three binary variables, adherence prediction and patient targeting could be done in any computer system without the need for statistical software, or even by hand for providers who wish to implement monitoring immediately. Accurate predictions can be generated based solely on pharmacy records, thereby avoiding the need to link to medical claims or other data sources and protecting patient privacy. Finally, predictions can be generated for patients with no prior data history, making accurate predictions possible for a wide spectrum of patients at providers with varying resources. If more complex prediction methods had been found to be of greater value to adherence prediction, new software tools for capture and manipulation of patient data would have been necessary to produce actionable recommendations for clinicians. Future work should evaluate whether prediction rules based on observed filling patterns can be extended to other drug classes and to more refined classifications of adherence behaviors, such as adherence trajectories (Franklin et al. 2013).
Supporting information
Appendix SA1: Author Matrix.
Appendix SA2: Web Appendix.
Acknowledgments
Joint Acknowledgment/Disclosure Statement: The research was funded by an unrestricted grant from CVS Caremark to the Brigham and Women's Hospital. WHS, OSM, and TAB are employees of CVS Caremark. None of the authors have any potential conflicts of interest to disclose relating to the work.
Disclosures: None.
Disclaimers: None.
References
- Beale, E. , Kendall M., and Mann D.. 1967. “The Discarding of Variables in Multivariate Analysis.” Biometrika 54 (3–4): 357–66. [PubMed] [Google Scholar]
- Benner, J. S. , Glynn R. J., Mogun H., Neumann P. J., Weinstein M. C., and Avorn J.. 2002. “Long‐Term Persistence in Use of Statin Therapy in Elderly Patients.” Journal of the American Medical Association 288 (4): 455–61. [DOI] [PubMed] [Google Scholar]
- Breiman, L. 2001. “Random Forests.” Machine Learning 45 (1): 5–32. [Google Scholar]
- Brookhart, M. A. , Patrick A. R., Dormuth C., Avorn J., Shrank W., Cadarette S. M., and Solomon D. H.. 2007. “Adherence to Lipid‐Lowering Therapy and the Use of Preventive Health Services: An Investigation of the Healthy User Effect.” American Journal of Epidemiology 166 (3): 348–54. [DOI] [PubMed] [Google Scholar]
- Caro, J. J. , Salas M., Speckman J. L., Raggio G., and Jackson J.. 1999. “Persistence with Treatment for Hypertension in Actual Practice.” Canadian Medical Association Journal 160 (1): 31–7. [PMC free article] [PubMed] [Google Scholar]
- Carroll, N. M. , Bayliss E. A., Schroeder E. B., Shetterly S., and Steiner J. F.. 2012. “Characteristics of Patients with Primary Non‐Adherence to Medications for Hypertension, Diabetes, and Lipid Disorders.” Journal of General Internal Medicine 27 (1): 57–64. [DOI] [PMC free article] [PubMed] [Google Scholar]
- Centers for Medicare and Medicaid Services . 2013. “Medicare Health & Drug Plan Quality and Performance Ratings: 2013 Part C & Part D Technical Notes” [accessed on March 31, 2015]. Available at https://www.cms.gov/Medicare/Prescription-Drug-Coverage/PrescriptionDrugCovGenIn/Downloads/2013-Part-C-and-D-Preview-2-Technical-Notes-v090612-.pdf
- Chan, D. C. , Shrank W. H., Cutler D., Jan S., Fischer M. A., Liu J., Avorn J., Solomon D., Brookhart M. A., and Choudhry N. K.. 2010. “Patient, Physician, and Payment Predictors of Statin Adherence.” Medical Care 48 (3): 196–202. [DOI] [PubMed] [Google Scholar]
- Choudhry, N. K. , Fischer M. A., Avorn J., Liberman J. N., Schneeweiss S., Pakes J., Brennan T. A., and Shrank W. H.. 2011. “The Implications of Therapeutic Complexity on Adherence to Cardiovascular Medications.” Archives of Internal Medicine 171 (9): 814–22. [DOI] [PubMed] [Google Scholar]
- Choudhry, N. K. , Glynn R. J., Avorn J., Lee J. L., Brennan T. A., Reisman L., Toscano M., Levin R., Matlin O. S., and Antman E. M.. 2014. “Untangling the Relationship between Medication Adherence and Post‐Myocardial Infarction Outcomes: Medication Adherence and Clinical Outcomes.” American Heart Journal 167(1): 51–8. [DOI] [PubMed] [Google Scholar]
- Choudhry, N. K. , Setoguchi S., Levin R., Winkelmayer W. C., and Shrank W. H.. 2008. “Trends in Adherence to Secondary Prevention Medications in Elderly Post‐Myocardial Infarction Patients.” Pharmacoepidemiology and Drug Safety 17 (12): 1189–96. [DOI] [PMC free article] [PubMed] [Google Scholar]
- Cortes, C. , and Vapnik V.. 1995. “Support‐Vector Networks.” Machine Learning 20 (3): 273–97. [Google Scholar]
- Curtis, J. R. , Xi J., Westfall A. O., Cheng H., Lyles K., Saag K. G., and Delzell E.. 2009. “Improving the Prediction of Medication Compliance: The Example of Bisphosphonates for Osteoporosis.” Medical Care 47 (3): 334. [DOI] [PMC free article] [PubMed] [Google Scholar]
- Cutrona, S. L. , Choudhry N. K., Fischer M. A., Servi A. D., Stedman M., Liberman J. N., Brennan T. A., and Shrank W. H.. 2012. “Targeting Cardiovascular Medication Adherence Interventions.” Journal of the American Pharmacists Association 52 (3): 381–97. [DOI] [PubMed] [Google Scholar]
- Dean, A. J. , Walters J., and Hall A.. 2010. “A Systematic Review of Interventions to Enhance Medication Adherence in Children and Adolescents with Chronic Illness.” Archives of Disease in Childhood 95 (9): 717–23. [DOI] [PubMed] [Google Scholar]
- Efron, B. , and Gong G.. 1983. “A Leisurely Look at the Bootstrap, the Jackknife, and Cross‐Validation.” American Statistician 37 (1): 36–48. [Google Scholar]
- Franklin, J. M. , Shrank W. H., Pakes J., Sanfélix‐Gimeno G., Matlin O. S., Brennan T. A., and Choudhry N. K.. 2013. “Group‐Based Trajectory Models: A New Approach to Classifying and Predicting Long‐Term Medication Adherence.” Medical Care 51 (9): 789–96. [DOI] [PubMed] [Google Scholar]
- Friedman, J. H. 2001. “Greedy Function Approximation: A Gradient Boosting Machine.” Annals of Statistics 29 (5): 1189–232. [Google Scholar]
- Gellad, W. F. , Grenard J. L., and Marcum Z. A.. 2011. “A Systematic Review of Barriers to Medication Adherence in the Elderly: Looking Beyond Cost and Regimen Complexity.” American Journal of Geriatric Pharmacotherapy 9 (1): 11–23. [DOI] [PMC free article] [PubMed] [Google Scholar]
- Harrell, F. , Lee K. L., and Mark D. B.. 1996. “Tutorial in Biostatistics Multivariable Prognostic Models: Issues in Developing Models, Evaluating Assumptions and Adequacy, and Measuring and Reducing Errors.” Statistics in Medicine 15: 361–87. [DOI] [PubMed] [Google Scholar]
- Hastie, T. , Tibshirani R., Friedman J., Hastie T., Friedman J., and Tibshirani R.. 2009. The Elements of Statistical Learning. New York: Springer. [Google Scholar]
- Haynes, R. B. , Ackloo E., Sahota N., McDonald H. P., and Yao X.. 2008. “Interventions for Enhancing Medication Adherence.” Cochrane Database of Systematic Review 2 (2): CD000011. [DOI] [PubMed] [Google Scholar]
- Hothorn, T. , and Bühlmann P.. 2006. “Model‐Based Boosting in High Dimensions.” Bioinformatics 22 (22): 2828–9. [DOI] [PubMed] [Google Scholar]
- Karve, S. , Cleves M. A., Helm M., Hudson T. J., West D. S., and Martin B. C.. 2008. “An Empirical Basis for Standardizing Adherence Measures Derived from Administrative Claims Data among Diabetic Patients.” Medical Care 46 (11): 1125–33. [DOI] [PubMed] [Google Scholar]
- Karve, S. . 2009. “Prospective Validation of Eight Different Adherence Measures for Use with Administrative Claims Data among Patients with Schizophrenia.” Value in Health 12 (6): 989–95. [DOI] [PubMed] [Google Scholar]
- Koh, H. C. , and Tan G.. 2011. “Data Mining Applications in Healthcare.” Journal of Healthcare Information Management 19 (2): 65. [PubMed] [Google Scholar]
- Kulik, A. , Shrank W. H., Levin R., and Choudhry N. K.. 2011. “Adherence to Statin Therapy in Elderly Patients after Hospitalization for Coronary Revascularization.” American Journal of Cardiology 107 (10): 1409–14. [DOI] [PubMed] [Google Scholar]
- Mann, D. M. , Woodard M., Muntner P., Falzon L., and Kronish I.. 2010. “Predictors of Non‐Adherence to Statins: A Systematic Review and Meta‐Analysis.” Annals of Pharmacotherapy 44 (9): 1410. [DOI] [PMC free article] [PubMed] [Google Scholar]
- Molfenter, T. D. , Bhattacharya A., and Gustafson D. H.. 2012. “The Roles of Past Behavior and Health Beliefs in Predicting Medication Adherence to a Statin Regimen.” Patient Preference and Adherence 6: 643. [DOI] [PMC free article] [PubMed] [Google Scholar]
- Morgado, M. P. , Morgado S. R., Mendes L. C., Pereira L. J., and Castelo‐Branco M.. 2011. “Pharmacist Interventions to Enhance Blood Pressure Control and Adherence to Antihypertensive Therapy: Review and Meta‐Analysis.” American Journal of Health‐System Pharmacy 68 (3): 241–53. [DOI] [PubMed] [Google Scholar]
- National Committee for Quality Assurance . 2014. “2014 HEDIS Measures” [accessed on March 31, 2015]. Available at http://www.ncqa.org/Portals/0/HEDISQM/HEDIS2014/List%20of%20HEDIS%202014%20Measures.pdf
- Ogedegbe, G. O. , Boutin‐Foster C., Wells M. T., Allegrante J. P., Isen A. M., Jobe J. B., and Charlson M. E.. 2012. “A Randomized Controlled Trial of Positive‐Affect Intervention and Medication Adherence in Hypertensive African Americans.” Archives of Internal Medicine 172 (4): 322. [DOI] [PMC free article] [PubMed] [Google Scholar]
- Osterberg, L. , and Blaschke T.. 2005. “Adherence to Medication.” New England Journal of Medicine 353 (5): 487–97. [DOI] [PubMed] [Google Scholar]
- Pencina, M. J. , D'Agostino R. B., and Vasan R. S.. 2008. “Evaluating the Added Predictive Ability of a New Marker: From Area under the ROC Curve to Reclassification and Beyond.” Statistics in Medicine 27 (2): 157–72. [DOI] [PubMed] [Google Scholar]
- Polinski, J. M. , Shrank W. H., Huskamp H. A., Glynn R. J., Liberman J. N., and Schneeweiss S.. 2011. “Changes in Drug Utilization During a Gap in Insurance Coverage: An Examination of the Medicare Part D Coverage Gap.” PLoS Medicine 8 (8): e1001075. [DOI] [PMC free article] [PubMed] [Google Scholar]
- Rassen, J. A. , Glynn R. J., Brookhart M. A., and Schneeweiss S.. 2011. “Covariate Selection in High‐Dimensional Propensity Score Analyses of Treatment Effects in Small Samples.” American Journal of Epidemiology 173 (12): 1404–13. [DOI] [PMC free article] [PubMed] [Google Scholar]
- Ridgeway, G. 2007. “Generalized Boosted Models: A Guide to the GBM Package” [accessed on March 31, 2015]. Available at http://cran.r-project.org/
- Robinson, J. W. 2008. “Regression Tree Boosting to Adjust Health Care Cost Predictions for Diagnostic Mix.” Health Services Research 43 (2): 755–72. [DOI] [PMC free article] [PubMed] [Google Scholar]
- Schneeweiss, S. , Rassen J. A., Glynn R. J., Avorn J., Mogun H., and Brookhart M. A.. 2009. “High‐Dimensional Propensity Score Adjustment in Studies of Treatment Effects Using Health Care Claims Data.” Epidemiology 20 (4): 512. [DOI] [PMC free article] [PubMed] [Google Scholar]
- Solomon, D. H. , Avorn J., Katz J. N., Finkelstein J. S., Arnold M., Polinski J. M., and Brookhart M. A.. 2005. “Compliance with Osteoporosis Medications.” Archives of Internal Medicine 165 (20): 2414–9. [DOI] [PubMed] [Google Scholar]
- Steiner, J. F. 2010. “Can We Identify Clinical Predictors of Medication Adherence…and Should We?” Medical Care 48 (3): 193–5. [DOI] [PubMed] [Google Scholar]
- Steiner, J. F. , Ho P. M., Beaty B. L., Dickinson L. M., Hanratty R., Zeng C., Tavel H. M., Havranek E. P., Davidson A. J., and Magid D. J.. 2009. “Sociodemographic and Clinical Characteristics Are Not Clinically Useful Predictors of Refill Adherence in Patients with Hypertension.” Circulation: Cardiovascular Quality and Outcomes 2 (5): 451–7. [DOI] [PMC free article] [PubMed] [Google Scholar]
- Steyerberg, E. W. , Harrell F. E. Jr, Borsboom G. J., Eijkemans M., Vergouwe Y., and Habbema J. D. F.. 2001. “Internal Validation of Predictive Models: Efficiency of Some Procedures for Logistic Regression Analysis.” Journal of Clinical Epidemiology 54 (8): 774–81. [DOI] [PubMed] [Google Scholar]
- Tibshirani, R. 1996. “Regression Shrinkage and Selection via the Lasso.” Journal of the Royal Statistical Society. Series B (Methodological) 58 (1): 267–88. [Google Scholar]
- Varian, H. R. 2014. “Big Data: New Tricks for Econometrics.” Journal of Economic Perspectives 28 (2): 3–28. [Google Scholar]
Associated Data
This section collects any data citations, data availability statements, or supplementary materials included in this article.
Supplementary Materials
Appendix SA1: Author Matrix.
Appendix SA2: Web Appendix.