

Abstract
The transcription factor Bach2 regulates the immune system at multiple points, including class switch recombination (CSR) in activated B cells and the function of T cells in part by restricting their terminal differentiation. However, the regulation of Bach2 expression and its activity in the immune cells are still unclear. Here, we demonstrated that Bach2 mRNA expression decreased in Pten-deficient primary B cells. Bach2 was phosphorylated in primary B cells, which was increased upon the activation of the B cell receptor by an anti-immunoglobulin M (IgM) antibody or CD40 ligand. Using specific inhibitors of kinases, the phosphorylation of Bach2 in activated B cells was shown to depend on the phosphatidylinositol 3-kinase (PI3K)-Akt-mammalian target of rapamycin (mTOR) pathway. The complex of mTOR and Raptor phosphorylated Bach2 in vitro. We identified multiple new phosphorylation sites of Bach2 by mass spectrometry analysis of epitope-tagged Bach2 expressed in the mature B cell line BAL17. Among the sites identified, serine 535 (Ser-535) was critical for the regulation of Bach2 because a single mutation of Ser-535 abolished cytoplasmic accumulation of Bach2, promoting its nuclear accumulation in pre-B cells, whereas Ser-509 played an auxiliary role. Bach2 repressor activity was enhanced by the Ser-535 mutation in B cells. These results suggest that the PI3K-Akt-mTOR pathway inhibits Bach2 by both repressing its expression and inducing its phosphorylation in B cells.
Keywords: cell signaling, gene regulation, immunology, lymphocyte, mammalian target of rapamycin (mTOR), protein phosphorylation, transcription factor, phosphatidylinositide 3-kinase (PI 3-kinase)
Introduction
Networks of signaling molecules and downstream signal-responsive transcription factors program the responses of immune cells. The transcription factors such as STAT (1), NF-κB (2), and Irf (3) families have been well studied in the context of the immune system in part due to their clear and established association with the upstream signaling cascades. In contrast, although the phosphatidylinositol 3-kinase (PI3K) pathway is critically important for the regulation of immune cells, its downstream transcription factors are still unclear except for the Foxo family (4). In this study, we investigated the possibility that the transcription factor Bach2 might be regulated in B cells by the PI3K pathway. Salient features of Bach2 relevant to this study are as follows.
Bach2 regulates the immune cells at multiple points. During the development of B cells from the progenitor cells, Bach2, together with its related factor Bach1, represses the expression of myeloid genes. The repression of the myeloid program is critical for the progenitor cells to be committed to the B cell fate (5). At the stage of pre-B cells, the successful completion of antibody heavy chain gene rearrangement is monitored by the lack or presence of pre-B cell receptor (pre-BCR2 checkpoint). Bach2 plays a critical role in negative selection (i.e. elimination of cells unsuccessful in the rearrangement) at the pre-BCR checkpoint (6). In mature B cells, Bach2 is required for the class switch recombination (CSR) and somatic hypermutation that diversify the effector function and antigen affinity, respectively, of antibody molecules in response to antigen and other stimulation (7). Bach2 promotes CSR by delaying the expression of Blimp-1, the master regulator of plasma cell differentiation, and thereby securing a time window for CSR before the terminal differentiation to plasma cells (8–10). A reduction in the Bach2 expression in memory B cells is involved in their rapid plasma cell differentiation upon antigen re-exposure (11). An integral view of the Bach2 functions in B cells has been proposed as a gene regulatory network (GRN) consisting of Bach2 and other transcription factor genes (12). Bach2 is also a critical regulator in T cells, where it is required for limiting effector T cell differentiation and promoting the generation of regulatory T cells and memory T cells (13–15). In both B and T cells, Bach2 represses the expression of the Blimp-1 gene (Prdm1) by directly binding to its enhancer regions. In addition, Bach2 targets many of the super enhancers associated with the genes for the cytokine-signaling pathways (16). Outside of the acquired immune system, Bach2 is important for the maturation and function of alveolar macrophages that maintain the homeostasis of the lung (17). Consistent with the diverse important functions of Bach2 in the immune system, recent genome-wide association studies have revealed association of BACH2 polymorphisms with immunity-related diseases such as type 1 diabetes (18, 19), inflammatory bowel diseases (20), celiac disease (21), autoimmune thyroid diseases (22), rheumatoid arthritis (23), asthma (24), and generalized vitiligo (25).
Two lines of observations suggest the possibility that Bach2 may be regulated downstream of the PI3K pathway. First, phosphatase and tensin homolog (Pten), which antagonizes the PI3K activity by dephosphorylating phosphatidylinositol 1,4,5-trisphosphate to regenerate phosphatidylinositol 4,5-bisphosphate, is required for CSR. B cells deficient for Pten show a specific defect in CSR (26), which is very similar to that of Bach2-deficient mice (7). Second, human BACH2 is phosphorylated downstream of the PI3K, resulting in cytoplasmic accumulation in lymphoma cells (27). Interestingly, when mouse mature B cells are activated in vitro, a portion of them show cytoplasmic accumulation of Bach2, which are becoming IgM-secreting plasma cells without undergoing CSR (8). These observations have suggested that the execution of CSR may be regulated by tuning the activity of Bach2. However, the exact phosphorylation status of Bach2 in activated B cells and its connection with upstream signaling have not been systematically analyzed. Connecting the Bach2 GRN with intracellular signaling pathways will be important to understand the immune cells at the level of systems biology.
In this study, we revisited the putative connection between the PI3K pathway and Bach2 using primary mouse B cells lacking Pten or treated with various chemical inhibitors of the pathway. We also carried out a detailed mass spectrometry analysis of epitope-tagged Bach2 in B cells, finding a total of 72 phosphorylation sites. Among these sites, a single site (serine 535) was critical for promoting its cytoplasmic accumulation and reducing its repressor activity in B cells. A model in which the critical function of Bach2 in B cells is integrated with the PI3K pathway is discussed, which can be extended into T cell biology.
Experimental Procedures
Mice
C57BL/6J mice were purchased from Charles River Laboratories. The Ptenflox/flox mice (26) were crossed with Mx1-Cre transgenic mice to generate Ptenflox/flox;Mx1-cre (+) (Pten−/−) mice and Ptenflox/flox;Mx1-cre (−) (Pten+/+) mice as described previously (28). Double-stranded poly(I)-poly(C) (pIpC) RNA (Sigma) was dissolved at 2 mg/ml in saline. Ptenflox/flox;Mx1-cre + or − mice were injected intraperitoneally with 500 μg of pIpC each on days 0, 2, and 4, and the splenic B cells were analyzed on day 10. B1–8hi mice (29) were obtained from Prof. Tomohiro Kurosaki. All experiments involving mice were approved by Tohoku University.
B Cell Purification
Splenic B cells were isolated from 8- to 12-week-old wild type C57BL/6 mice or B1–8hi mice where indicated and purified by B cell isolation kit (Miltenyi Biotec). Pten−/− splenic B cells were isolated from 5- to 7-week-old mice and purified by CD45R (B220) microbeads (Miltenyi Biotec). The purities were typically more than 96–99% of living cells and 90–95% of total cells.
Cell Culture
Splenic B cells were cultured in RPMI 1640 medium (Sigma) supplemented with 10% FBS (Nichirei Biosciences), 10 mm HEPES (Gibco), 1 mm sodium pyruvate (Gibco), 0.1 mm non-essential amid acids (Gibco), 50 μm 2-mercaptoethanol (Wako), 100 μg/ml streptomycin (Gibco), and 100 units/ml penicillin (Gibco) and stimulated with 20 μg/ml LPS (0111: B4; Sigma), 10 μg/ml anti-mouse IgM μ-chain-specific (115-006-020, Jackson ImmunoResearch), or 100 ng/ml CD40L (R&D Systems) and 10 ng/ml recombinant mouse IL-4 (BD Biosciences) as described previously (7, 8). For the experiments using the kinase inhibitors, splenic B cells were cultured with 5 μm LY294002 (Calbiochem), 10 μm IC87114 (Calbiochem), 1 μm Akt Inhibitor IV (Calbiochem), 1 μm SB203580 (Cell Signaling), 10 μm U0126 (Cell Signaling), 100 nm Torin1 (Tocris Bioscience), or 10 nm rapamycin (Calbiochem). BAL17 mature B cells were maintained in Iscove's modified Dulbecco's medium (Invitrogen) supplemented with 10% FBS, 50 μm 2-mercaptoethanol, 100 μg/ml streptomycin, and 100 units/ml penicillin. 293T cells were maintained in DMEM (Sigma) supplemented with 10% FBS, 100 μg/ml streptomycin, and 100 units/ml penicillin. Irf4−/−Irf8−/− pre-B cells were cultured as reported previously (30). In the SILAC experiment, Iscove's modified Dulbecco's medium for SILAC (Thermo Fisher Scientific) containing 10% dialyzed FBS (Thermo Fisher Scientific) and 2-mercaptoethanol was used by adding either 0.4 mm l-lysine-HCl with 0.2 mm l-arginine-HCl (Sigma) as the “light” medium or 0.4 mm l-lysine-HCl-13C6 with 0.2 mm l-arginine-HCl-13C6 (Wako) as the “heavy” medium.
Plasmids and Transfection
FLAG epitope-tagged Bach2 was described previously (31). Substitutions of serine or threonine in the phosphorylation sites with alanine were introduced into the mouse Bach2 cDNA by using Metamorph mutagenesis kit (System Bioscience). 293T cells were transfected with the Bach2 expression vectors using GeneJuiceTM transfection reagent (Novagen) and harvested 24 h after transfection. The retrovirus vector pOZ-FH-C-Bach2 was generated by PCR from pcDNA-FLAG-Bach2 using SalI site-containing forward primer and NotI site-containing reverse primer. The fragment was inserted into the XhoI and NotI sites of pOZ-FH-C (9). 293P packaging cells were transfected with each expression vector using GeneJuiceTM transfection reagent, and then the viral supernatants were harvested 2 days after transfection to infect BAL17 mature B cells. The retrovirus vector pOZ-FH-Bach2-Strep was generated by PCR from pcDNA-Bach2 using a NotI site-containing forward primer and a NotI site and Strep tag sequence containing reverse primer. pOZ-FH-Bach2-S509A-Strep was generated by PCR from pcDNA-FLAG-Bach2-S509A using a SalI site-containing primer. PlatE packaging cells (32) were transfected with each expression vector using FuGENE HD transfection reagents (Promega), and then the viral supernatants were harvested 2 and 3 days after transfection to infect BAL17 mature B cells.
FACS Analysis
The cells were stained with fluorescent-conjugated antibodies specific for B220 and CD138 (BD Biosciences). The cells were analyzed in a FACSCalibur or a FACSCantoII.
RT-PCR
RNA was prepared by using RNeasy Plus micro kit (Qiagen). Complementary DNA was synthesized by using Superscript III RT kit with random hexamers (Random Primers, Invitrogen). For quantitative PCR, LightCycler Fast Strand DNA Master SYBR Green I (Roche Applied Science) reagents and LightCycler System or LightCycler Nano System (Roche Applied Science) was used. The sequences of PCR primers are available from authors on request.
Immunoblot Analysis
Whole cell extracts were prepared as described previously (33). The cells were washed once with ice-cold phosphate-buffered saline (PBS) and were lysed in buffer C (20 mm HEPES, pH 7.5, 20% glycerol, 400 mm NaCl, 1 mm EDTA, 1 mm MgCl2, 2 mm tris(2-carboxyethyl)phosphine hydrochloride, 0.5 mm PMSF, 0.1% Nonidet P-40, 1× protease inhibitor mixture (Roche Applied Science), 1×Phos STOP (Roche Applied Science)). Subsequently, indicated lysates were treated with 10 units of calf intestinal alkaline phosphatase (CIAP) (New England Biolabs) for 1 h at 37 °C. Each sample was resolved on SDS-polyacrylamide gels and electrotransferred to polyvinylidene difluoride (PVDF) membranes (Millipore). The membranes were blocked in blocking buffer (5% (w/v) skimmed milk or 5% (w/v) bovine serum albumin (Sigma), 0.05% (v/v) Tween 20 in Tris-buffered saline (TBS), 25 mm Tris-HCl, pH 7.4, 137 mm NaCl, 3 mm KCl) for 1 h at room temperature. Subsequently, they were incubated with primary antibodies in the blocking buffer for 1 h at room temperature or overnight at 4 °C and secondary antibodies in the TBS with 0.05% (v/v) Tween 20 for 0.5 h at room temperature. The primary antibodies used were as follows: monoclonal anti-FLAG M2-peroxidase (A8592; Sigma); anti-Bach2 antiserum (F69-1 (34)); Akt antibody (catalog no. 9272; Cell Signaling); phospho-Akt (Ser-473) (193H12) rabbit mAb (catalog no. 4058; Cell Signaling); PTEN (138G6) rabbit mAb (catalog no. 9559; Cell Signaling); Foxo1 (C29H4) rabbit mAb (catalog no. 2880; Cell Signaling); phospho-FoxO1 (Ser-256) antibody (catalog no. 9461; Cell Signaling); p44/42 MAPK (ERK1/2) antibody (catalog no. 9102; Cell Signaling); phospho-p44/42 MAPK (ERK1/2) (Thr-202/Tyr-204) antibody (catalog no. 9101; Cell Signaling); p38 MAPK antibody (catalog no. 9212; Cell Signaling); phospho-p38 MAPK (Thr-180/Tyr-182) antibody (catalog no. 9211; Cell Signaling); anti-mTOR antibody (ab2833; Abcam); phospho-mTOR (Ser-2448) antibody (catalog no. 2971; Cell Signaling); p70 S6 kinase antibody (catalog no. 9202; Cell Signaling); phospho-p70 S6 kinase (Thr-389) antibody (catalog no. 9205; Cell Signaling); anti-GAPDH (ab8245; Abcam); or anti-tubulin antibody (sc-5286; Santa Cruz Biotechnology). The secondary antibody was either HRP-conjugated anti-rabbit IgG (GE Healthcare) or HRP-conjugated anti-mouse IgG (GE Healthcare). ECL Western blotting detection reagents (GE Healthcare) were used to detect antibody-antigen complexes.
In Vitro Phosphorylation
GST, GST-4EBP1, and Bach2(331–520) were expressed in Escherichia coli using expression plasmids based on pGEX6P-1 vector. GST and GST-4EBP1 were purified using glutathione-Sepharose HP (GE Healthcare). Bach2(331–520) was purified as described previously (35). 293T cells were transfected with expression plasmids for FLAG-mTOR and FLAG-Raptor. mTOR-Raptor complex was immunoprecipitated from the cell lysates with anti-FLAG antibody coupled to agarose beads (Sigma) as described previously (36). Each protein substrate (5 μg) was incubated with [γ-32P]ATP (0.37 MBq) (PerkinElmer Life Sciences) and the mTOR-Raptor complex in kinase buffer (30 μl) containing 50 mm HEPES, pH 7.5, 50 mm NaCl, 10 mm β-glycerophosphate at 30 °C for 30 min. As a negative control for the kinase assay, immunoprecipitates from cells without transfection of the expression plasmids were used. After heating at 95 °C for 5 min, the samples were separated by 15% SDS-PAGE, and radioactive bands were detected with a Typhoon FLA 7000 image analyzer (GE Healthcare).
Bach2 Purification
Bach2 was purified from whole cell extracts prepared from BAL17 mature B cells stably expressing FLAG-hemagglutinin (HA) epitope-tagged Bach2 (eBach2) as described previously (9). The eBach2-expressing cells were collected by centrifugation for 8 min at 1,865 × g and then were washed with PBS. After centrifugation for 5 min at 300 × g, cells were lysed as described previously (33). Whole cell extracts of BAL17 mature B cells were incubated with the anti-FLAG-M2 magnetic beads (Sigma) for 2 h at 4 °C and washed three times with wash buffer (50 mm Tris-HCl, 150 mm NaCl, and 0.01% Nonidet P-40). The bound proteins were eluted from beads by incubating in wash buffer with 0.15 mg/ml 3× FLAG peptide (Sigma) for 30 min at 4 °C. The elution was then incubated with anti-HA tag magnetic beads (MBL) for 30 min at 4 °C. After washing three times with wash buffer, the bound proteins were eluted from the beads by incubating with SDS buffer (62.5 mm Tris-HCl, pH 6.8, 2% SDS, 10% glycerol, 713 mm 2-mercaptoethanol, 0.01% bromphenol blue) for 5 min at 95 °C.
Mass Spectrometry Analysis
The purified eBach2 protein was subjected to SDS-PAGE on a 5–20% gradient gel, and the gel was stained with Coomassie Brilliant Blue (37). The stained bands of Bach2 were excised from the gel and were subjected to in-gel reduction with 10 mm DTT in 25 mm ammonium bicarbonate, alkylation of the cysteine residues with 55 mm acrylamide in 25 mm ammonium bicarbonate, and digestion with trypsin (Promega). The tryptic peptides were analyzed using a nano-flow HPLC-ESI-MS/MS system. The peptides were subjected to PAL HTC-xt autosampler (AMR) equipped with an Ultimate 3000 pump (Thermo Fisher Scientific). The peptides were separated with a C18 tip column (75-μm inner diameter × 8-cm length, 3-μm particle diameter; Nikkyo Technos) using solvent A (0.1% formic acid) and solvent B (0.1% formic acid and 95% acetonitrile) with a gradient from 100 to 60% A, 40% B in 47.5 min at a flow rate of 300 nl/min. The peptides eluted from the column were ionized and sprayed directly into LTQ-Velos Orbitrap with ETD (Thermo Fisher Scientific) at 2 kV. The full mass scans were acquired with the Orbitrap with a lock mass at m/z = 445.120025 followed by the collision-induced dissociation (CID) MS2 scans of the 10 most intense precursor ions in the ion trap (CID-IT) or those of the top three ions in the orbitrap with the resolution set at 7,500 (CID-FT). The resolution in MS1 was set at 100,000 when followed by CID-IT and at 30,000 when followed by CID-FT. The details of the MS2 scan setting are as follows: minimal signal for MS2 trigger at 500, the precursor ions isolated by 2 m/z width, the normalized collision energy set at 35, and 30 ms of the activation time.
Enrichment of phosphopeptides by TiO2 affinity purification was also applied. The tryptic peptides from eBach2 were prepared as described above and were subjected to phosphopeptide purification using TiO2 Mag-Sepharose (GE Healthcare) according to the supplier's instructions, except that the binding solution contained 2,5-dihydroxybenzoic acid instead of glycolic acid (38).
The raw MS/MS data analyses were performed using the MASCOT search engine (version 2.4, Matrix Science) for peptide identification. The data were searched against SwissProt (November, 2014) and a custom database, including the sequence of eBach2 as well as contaminating proteins. The variables used were 5 ppm mass tolerance for the precursor ion masses and 0.5 Da (for CID-IT) or 0.02 Da (for CID-FT) for the product ion masses, variable modifications of oxidation of methionine (+15.9949), propionamidation of cysteine (+71.0371), phosphorylation of serine/threonine (+79.9663), and a maximum of three trypsin miscleavages. We selected the phosphopeptides of Bach2 that were identified with MASCOT expectation values <0.05, irrespective of their MASCOT ranks, and considered all the designated phospho-Ser/Thr residues as possible phosphorylation sites of Bach2. Therefore, in our analysis, more than one possible phosphorylation site in a sequence often appears even from a single MS/MS data set.
SILAC Analysis
BAL17 cells that stably expressed wild type eBach2 were grown for 5 days (more than eight generations) in the SILAC light medium, and those that expressed either eBach2-S509A or eBach2-S535A were grown in the SILAC heavy medium. Each mutant (around 1 × 10⁸ cells) was mixed with an equal number of the wild type cells and was suspended in 2 ml of a lysis buffer (50 mm Tris-HCl, pH 7.4, 150 mm NaCl, 0.3% Nonidet P-40, protease inhibitor Complete and PhosStop). After centrifugation at 15,000 rpm for 10 min, the resulting cleared cell lysate was mixed with anti-FLAG magnetic beads (Sigma M8823, 40 μl of slurry was used for a sample) with gentle rotation for 1.5 h at 4 °C. The beads were washed three times using 0.5 ml of the lysis buffer. The proteins bound to the beads were eluted in 40 μl of the lysis buffer containing 0.2 μg/ml FLAG peptide (Sigma F3290). The sample was separated by SDS-PAGE using a 5–20% gel. Each lane was divided into 15 gel blocks, and after reduction/alkylation and tryptic digestion, the samples were subjected to LC-MS/MS as described above except that an ADVANCE HPLC system (AMR) with a PepSwift Monolithic column (100 μm inner diameter × 25 cm, Thermo Fisher Scientific) was used for HPLC. The MS1 scan in the orbitrap with resolution at 100,000 and the MS2 of the 20 most intense ions in the ion trap were acquired. The settings for MS2 were as follows: minimal signal intensity required = 500; isolation width = 2 m/z; AGC target = 10,000; maximum ion injection time = 100 ms; normal collision energy = 35; activation time = 10 ms; microscan = 1. The 15 raw data files derived from the gel blocks in a lane were gathered and were analyzed by performing MASCOT search using a Proteome Discoverer software (version 1.4, Thermo Fisher Scientific).
Retroviral Vectors and Transduction into Irf4−/−Irf8−/− pre-B Cells
A bi-cistronic retroviral vector encoding mouse Bach2 with an N-terminal FLAG tag and GFP was reported previously (5). PlatE packaging cells were transiently transfected with the retroviral constructs through the use of FuGENE reagent (Roche Applied Science). Viral supernatants were collected at 48 and 72 h after transfection and pooled. Irf4−/−Irf8−/− pre-B cells (39) were suspended in retroviral supernatant generated as described above with Polybrene (4 μg/ml) and were centrifuged for 90 min at 2,500 rpm at 32 °C. After centrifugation, cells were incubated for 3 h at 37 °C and were washed and plated on OP9 cells under the appropriate conditions. After 48 h, the cells were sorted on the basis of GFP expression.
Immunofluorescence Microscopy
Irf4−/−Irf8−/− pre-B cells infected with the retroviruses as above were placed on the microscope covers (Fisher) coated with poly-l-lysine solution (Sigma) and were incubated with an anti-DDDDK (FLAG) tag antibody (M185-3L; MLB) diluted in 1% BSA/PBS. Cells were then incubated with donkey anti-mouse IgG-labeled Alexa Fluor 594 (705-587-003; Jackson ImmunoResearch) diluted in 1% BSA/PBS. Nuclei were stained with 10 μm Hoechst 33342 (Sigma). The samples were examined with Zeiss LSM780 confocal microscope system. Photoshop (Adobe) was used for the presentation of the images.
Results
Bach2 Expression in B Cells Is Repressed by the PI3K Pathway
To examine whether Bach2 is regulated by the PI3K pathway in B cells, we first determined the effect of Pten deletion upon Bach2 expression in B cells. Ptenflox/flox;Mx1-cre mice were treated with pIpC three times to induce Cre-recombinase (hereafter referred to as Pten−/−). As a control, we used Ptenflox/flox mice without the Cre transgene (Pten+/+). At 6 days after the last injection, spleens of these mice were harvested. In a flow cytometry analysis, Pten−/− mice showed more CD138-positive cells (1.63%) than Pten+/+ mice (0.28%) in the spleens (Fig. 1A), suggesting an enhancement of plasma cell differentiation in Pten−/− B cells. This observation was consistent with previous reports (26, 40). Splenic B cells from Pten−/− or Pten+/+ mice were isolated with B220 micro beads and cultured for 1 h with an anti-IgM antibody to mimic BCR stimulation. In quantitative RT-PCR, the level of Prdm1 mRNA was increased by the BCR stimulation with the anti-IgM antibody (Fig. 1B). Pten−/− B cells tended to show higher levels of Blimp-1 mRNA than wild type cells with or without the BCR stimulation, although the differences did not reach statistical significance (Fig. 1B). These findings were consistent with the increased plasma cell formation in vivo. Although the treatment with the anti-IgM antibody did not affect the levels of Bach2 mRNA, the Pten deficiency resulted in its reduction (Fig. 1C). In contrast, Pax5 mRNA showed only a slight decrease in response to the BCR stimulation, which was not modified by the Pten deficiency (Fig. 1D). The increase and decrease in the Prdm1 and Bach2 mRNA levels, respectively, in the absence of Pten were consistent with the increased numbers of plasma cells in Pten−/− mice (Fig. 1A). Because Bach2 inhibits Prdm1 expression and plasma cell differentiation (8–10), we concluded that Pten deficiency caused increased plasma cell differentiation in part by the repression of Bach2 gene expression. Because the BCR stimulation did not reduce the mRNA expression of Bach2, a post-translational modification of Bach2 may also take place under this condition.
FIGURE 1.

Plasma cell differentiation and Bach2 mRNA expression in Pten-deficient B cells. A, expression of B220 and CD138 of total splenic cells from Pten+/+ mice (upper panel) or Pten−/− mice (lower panel) at 6 days after the last pIpC administration. The data are representative of two experiments. B–D, expression of Blimp-1 (B), Bach2 (C), and Pax5 (D) mRNAs in purified splenic B cells from Pten+/+ (WT) or Pten−/− (KO) mice at 6 days after the last pIpC administration. The cells were treated with or without anti-IgM stimulation in vitro. The mRNA quantities were normalized to β-actin mRNA in each sample and are represented as relative values to that in Pten+/+ B cells without anti-IgM stimulation. The mean values and S.D. of the results from three independent experiments are shown. Statistical significance was determined using the Student's t test, and p values are indicated. All authors reviewed the results and approved the final version of the manuscript.
To examine whether Bach2 is phosphorylated in response to the BCR stimulation, we carried out an immunoblotting analysis of whole cell extracts of splenic B cells using an anti-Bach2 antibody. In immunoblotting of Bach2 using B cells from wild type mice, Bach2 showed two bands with distinct mobility (Fig. 2A). After treatment with alkaline phosphatase, the upper band disappeared (Fig. 2A). These results indicated that Bach2 was phosphorylated in primary B cells and that its phosphorylated form migrated more slowly than non-phosphorylated one in SDS-PAGE. The relative level of the upper band was increased by treating the cells with the anti-IgM antibody (Fig. 2B, left two lanes), indicating that Bach2 was phosphorylated in response to BCR activation. Consistent with the results obtained by the RT-PCR analysis described above, the level of the Bach2 protein was less in Pten−/− than Pten+/+ B cells (Fig. 2B, right two lanes). Although the upper band increased upon anti-IgM stimulation of the Pten−/− B cells (Fig. 2B, right two lanes), it was difficult to judge whether the ratio of the upper and lower bands was affected by the Pten deficiency due to the reduction of the total amount of Bach2 protein. Phosphorylation of Akt, which is downstream of PI3K, was increased in Pten−/− B cells compared with Pten+/+ B cells. Although phosphorylation of Foxo1 occurred similarly in Pten+/+ and Pten−/− B cells, the total levels of Foxo1 were less in Pten−/− B cells than Pten+/+ B cells (Fig. 2B). These observations can be explained by the fact that Foxo1 is degraded depending on its phosphorylation by Akt (41). The reduction in the total protein levels of Bach2 and Foxo1 in the Pten−/− B cells precluded us from concluding whether PI3K might affect their phosphorylation in B cells. Notwithstanding this, these results together indicated that BCR activation increased phosphorylation of Bach2 in B cells and that the PI3K pathway kept the Bach2 protein level at a lower level.
FIGURE 2.

Bach2 phosphorylation in Pten-deficient B cells. A, whole cell lysates from B cells from wild type mice were treated or not with alkaline phosphatase (CIAP) for 1 h, and the Bach2 and Pten proteins were detected by immunoblotting (IB) using antibodies against Bach2 or Pten proteins. Pten is shown as a loading control. B, splenic B cells derived from Pten+/+ mice (left, WT) or Pten−/− mice (right, KO) at 6 days after the last pIpC administration were incubated or not for 1 h with anti-IgM stimulation. Whole cell lysates were prepared and were treated with CIAP for 1 h where indicated. Immunoblotting was performed with antibodies against the indicated proteins or phosphoproteins. Tubulin is shown as a loading control. The data are representative of three experiments.
Bach2 Is Phosphorylated by the PI3K-Akt-mTOR Pathway in Activated B Cells
To determine the upstream regulators of Bach2 phosphorylation in activated B cells, we next compared the pattern of Bach2 bands as a surrogate of Bach2 phosphorylation after treating splenic B cells with various stimulations. In B cells treated with the anti-IgM antibody, Bach2 phosphorylation increased at 1 h post-stimulation and remained high up to 24 h (Fig. 3A). In B cells treated with LPS or CD40L+IL4 stimulation, Bach2 phosphorylation also increased at 1 h post-stimulation (Fig. 3A). To further confirm that Bach2 was phosphorylated in response to extracellular signals, we utilized mature B cells isolated from B1–8hi knock-in mice carrying Ig heavy chains that can produce an antibody to a pre-specified antigen (29). Because the mature B cells in these mice are almost clonal, they are expected to show uniform reactions upon activation. When mature B1–8hi B cells were isolated and stimulated with CD40L+IL4, the faster migrating band of Bach2 disappeared within 1 h (Fig. 3B). These observations clearly indicated that phosphorylation of Bach2 was regulated in response to extracellular signals.
FIGURE 3.

Bach2 phosphorylation in activated B cells. Whole cell extracts were prepared from WT B cells with or without the indicated stimulation. The extracts were treated with CIAP for 1 h where indicated. Immunoblotting (IB) was performed with antibodies against the indicated proteins or phosphoproteins. Tubulin is shown as a loading control. A, B cells were stimulated with either anti-IgM, LPS, or CD40L plus IL-4 for the indicated period. B, B cells isolated from B1–8hi mice were stimulated with CD40L plus IL-4 for the indicated period. The asterisk indicates nonspecific band. C, B cells were stimulated with either anti-IgM or LPS for 1 h in the presence (+) or absence (−) of 5 μm LY294002.
To examine the signaling pathways involved in Bach2 phosphorylation, splenic B cells were stimulated with anti-IgM or LPS in the presence or absence of the pan-PI3K inhibitor LY294002. Immunoblot analysis showed an increase in the faster migrating Bach2 band in the presence of LY294002 (Fig. 3C). The effect of LY294002 was confirmed by the inhibition of the activating phosphorylation of Akt (Fig. 3C). These observations suggested that PI3K was involved in the phosphorylation of Bach2 in primary mature B cells.
To further determine the kinases downstream of PI3K that are involved in the phosphorylation of Bach2, B cells were stimulated with the anti-IgM antibody in the presence or absence of various kinase inhibitors, namely the PI3K δ inhibitor IC87114, Akt inhibitor IV, the p38 MAPK inhibitor SB203580, or the MEK inhibitor U0126. The phosphorylation of Bach2 and Akt was reduced in the presence of IC87114 and Akt inhibitor IV (Fig. 4A), the latter showing consistently a stronger effect. SB203580 and U0126 did not show such an effect (Fig. 4, A and B). The effect of U0126 was confirmed by the inhibition of the activating phosphorylation of ERK1/2 (Fig. 4B). Induction of phosphorylation of p38 MAPK was not clearly observed at 1 h after the stimulation, and it was rather decreased (Fig. 4A), possibly because this kinase was activated more rapidly (42). Next, to investigate whether mTOR is involved in the phosphorylation of Bach2, we examined the effect of Torin1, an ATP-competitive mTOR inhibitor that is known to inhibit both the mTORC1 and mTORC2 activities (43), and rapamycin, an allosteric inhibitor that selectively inhibits the mTORC1 activity (44). The effects of these inhibitors were confirmed by the inhibition of the activating phosphorylation of p70 S6K (Fig. 4, C and D). An immunoblot analysis showed inhibition of Bach2 phosphorylation by Torin1 but not by rapamycin (Fig. 4, C and D). Similarly, Akt phosphorylation was inhibited only by Torin1 but not by rapamycin (Fig. 4, C and D). These results suggested that Bach2 was phosphorylated downstream of the BCR-PI3K-Akt-mTOR pathway.
FIGURE 4.

Bach2 phosphorylation depending on PI3K-Akt-mTOR pathway. A, B cells were stimulated with anti-IgM for 1 h in the presence of either 5 μm LY294002 (LY), 10 μm IC87114 (IC), 1 μm Akt inhibitor IV (Akt), or 1 μm SB203580 (SB). B, B cells were stimulated with anti-IgM in the presence of either 5 μm LY294002 (LY) or 10 μm U0126 (U). C, B cells were stimulated with anti-IgM in the presence of either 5 μm LY294002, 1 μm Akt inhibitor IV, or 100 nm Torin1 (To). The arrowheads indicate phospho-p70 S6 kinase. D, B cells were stimulated with anti-IgM in the presence of 1 μm Akt inhibitor IV or rapamycin (10 or 50 nm indicated as R10 or R50, respectively). The arrowheads indicate phospho-p70 S6 kinase. IB, immunoblot.
To examine whether mTOR directly phosphorylates Bach2, we carried out an in vitro phosphorylation assay using a recombinant Bach2 fragment and mTOR complex immunopurified from 293T cells overexpressing both mTOR and Raptor (Fig. 5, A and B). In this experiment, we used a recombinant Bach2 spanning its amino acid residues 331–520 because this fragment was stable in vitro (35). As shown in Fig. 5C, the mTOR complex showed a phosphorylation activity toward Bach2. This particular experiment did not show a clear phosphorylation of GST-4EBP1, a known target of mTORC1, but another independent experiment showed its phosphorylation. We concluded that mTOR, most likely as a complex with Raptor (mTROC1), phosphorylated directly with Bach2 in vitro. Further studies are necessary to discern the roles of mTORC1 and mTORC2 in the regulation of Bach2.
FIGURE 5.
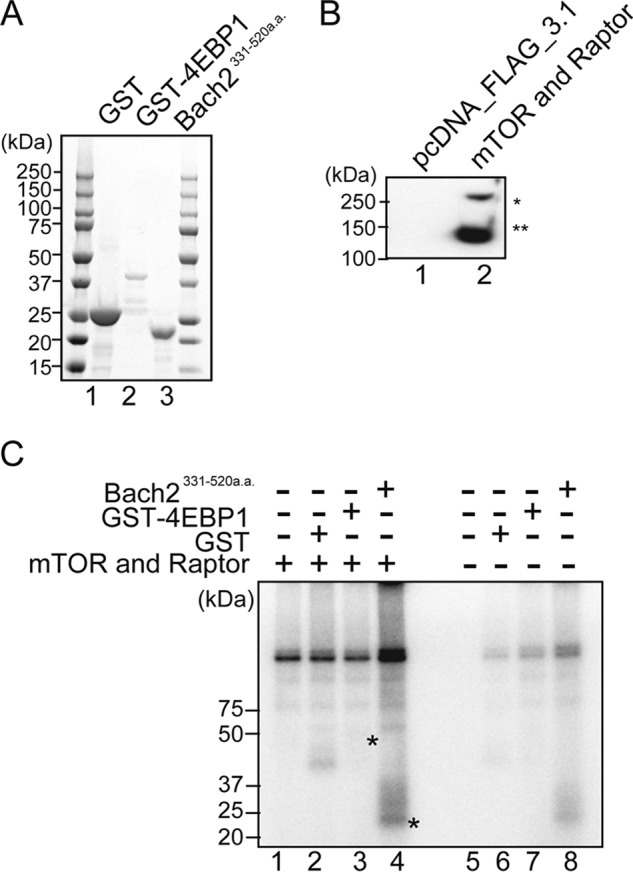
Phosphorylation of Bach2 by mTOR in vitro. A, Coomassie-stained gel shows purified proteins used as substrates. Each protein substrate was expressed in E. coli and purified as described under “Experimental Procedures.” B, preparation of mTOR-Raptor complex for the kinase assay. FLAG-tagged mTOR and FLAG-tagged Raptor were co-expressed in 293T cells, immunoprecipitated, and detected by immunoblot analysis using FLAG antibody. FLAG-tagged mTOR and FLAG-tagged Raptor are indicated with asterisk and double asterisks, respectively. C, kinase assay of Bach2(331–520) (Bach331-520a.a.) by the mTOR-Raptor complex. SDS-PAGE, GST (lanes 2 and 6), GST-4EBP1 (lanes 3 and 7), and Bach2(331–520) (lanes 4 and 8) were incubated with immunoprecipitates containing the FLAG-mTOR-Raptor complex or mock immunoprecipitates as indicated. Phosphorylated Bach2(331–520) and GST-4EBP1 are indicated with asterisks.
Identification of the Bach2 Phosphorylation Sites by Mass Spectrometry
To identify phosphorylation sites of Bach2, we generated BAL17 mature B cells that stably expressed FLAG-HA epitope-tagged Bach2 (eBach2) (9). The purification of eBach2 from the whole cell extracts was performed by sequential steps of affinity purification with anti-FLAG and anti-HA tag antibodies. The purified samples were resolved on SDS-PAGE. The eBach2 protein appeared as the two bands (Fig. 6A), which were analyzed by mass spectrometry. In all, 72 possible phosphorylated serines (Ser) and threonines (Thr) were detected with MASCOT expectation values less than 0.05 (supplemental Table 1 and Fig. 6B). The MS/MS spectra for the peptides containing phosphoserine 509 or phosphoserine 535 are shown as examples (Fig. 6, C and D). Many of the phosphorylation sites (64 sites) were located between the BTB and bZip domains. Interestingly, the minimal heme-binding region (residues 331–520), which is with naturally disordered structure (35), contained 24 phosphorylation sites. Among the sites identified, Ser-335 was concordant with the consensus sequence of Akt targets (RXRXX(S/T)X). The other 11 sites (Ser-260, Ser-314, Thr-318, Thr-321, Ser-336, Ser-408, Thr-442, Ser-509, Ser-535, Ser-547, and Ser-718) have proline at +1 position, which has been reported as an mTOR consensus motif (45).
FIGURE 6.

Phosphorylation sites of Bach2. A, eBach2 was purified from BAL17 mature B cells and was subjected to SDS-PAGE, and the gel was stained with Coomassie Brilliant Blue. The arrows indicate eBach2. B, possible phosphorylation sites of mouse Bach2 that were identified by the MS/MS analyses are shown in the boxes, out of which the red and green ones indicate the Ser/Thr residues that are contained in the consensus motifs for phosphorylation by mTOR and Akt, respectively. Considering the diverse phosphorylation states of a peptide containing multiple Ser/Thr residues, the phosphorylation sites assigned in the peptides whose peptide rank is >1 were also included. Therefore, in this analysis, it should be noted that multiple phosphorylation sites were often identified from a single MS/MS (see also supplemental Table 1 for the details). The red stars indicate Ser-509 and Ser-535. The black solid line below the amino acid sequence indicates the BTB domain; the black dotted line indicates the Cap'n'Collar region; the red dotted line indicates the bZip domain, and the red solid line indicates the CLS region. The minimal heme-binding region is indicated by the red double underline. C, MS1 spectrum showing a precursor ion with m/z = 703.3360 and z = 2 (boxed, observed mass = 1404.6574) and its MS2 spectrum acquired in the orbitrap are shown. The MASCOT search assigned these spectra as 505VC*PRSpPPLETR in mouse Bach2 with a MASCOT expectation value = 3.6 × 10⁻⁴, in which Sp and C* stand for phosphorylated serine and propionamidated cysteine, respectively. The theoretical mass of this peptide is 1404.6585 (Δ = −0.0011). The product ion peaks that agreed with the theoretical b- and y-ions within ±0.02-Da errors are indicated in red and blue, respectively. The same sequence but phosphorylated at Thr-514 was not a significant hit. D, MS1 spectrum acquired in the orbitrap showing a precursor ion with m/z = 1349.1973 and z = 3 (boxed, observed mass = 4044.5700) and its MS2 spectrum in the ion trap are shown. The MASCOT search assigned these spectra as 518TSSSC*SSYSYAEDGSGGSpPC*SLPLC*EFSSSPC*SQGAR in mouse Bach2 with a MASCOT expectation value = 4.6 × 10⁻⁸. The theoretical mass of this peptide is 4044.5795 (Δ = −0.0095). The product ion peaks that agreed with the theoretical b- and y-ions within ±0.5 Da errors are indicated in red and blue, respectively. The same sequence phosphorylated at either Ser-526, Ser-532, Ser-538, Ser-545, Ser-546, Ser-547, or Ser-550 were also indicated but had lower significance.
Mutations of Bach2 Ser-509 or Ser-535 Reduce the Mobility Shift
To identify the phosphorylation site(s) of Bach2 targeted by the PI3K-Akt-mTOR pathway, mutagenesis of Ser-335 within the Akt consensus sequence was first carried out by a substitution with alanine (Fig. 7A). Because the results of MS/MS analysis suggested that the other serine residues surrounding Ser-335 might also be phosphorylated, we combined mutations in these residues as well (i.e. Ser-333, Ser-336, and Ser-338 (mutant 4, M4); see supplemental Table 1). Immunoblotting of cell lysates of HEK293T cells expressing Bach2M4 showed that it migrated as two bands in SDS-PAGE just like wild type Bach2 (Fig. 7B), indicating that some of the other serine/threonine residues are also phosphorylated. Next, we added mutations of Thr-321 and Ser-509 (M6) or additional four sites (Thr-321, Ser-509, Thr-442 and Ser-718 (M8)) (Fig. 7A). These Bach2 mutants showed a less phosphorylated band than wild type in immunoblotting (Fig. 7B). Therefore, we mutagenized Thr-321 and Ser-509 simultaneously (M2) or individually (T321A or S509A). M2 and S509A showed a reduction in their phosphorylation like M6 (Fig. 7C). However, there remained a substantial level of the upper band with S509A.
FIGURE 7.
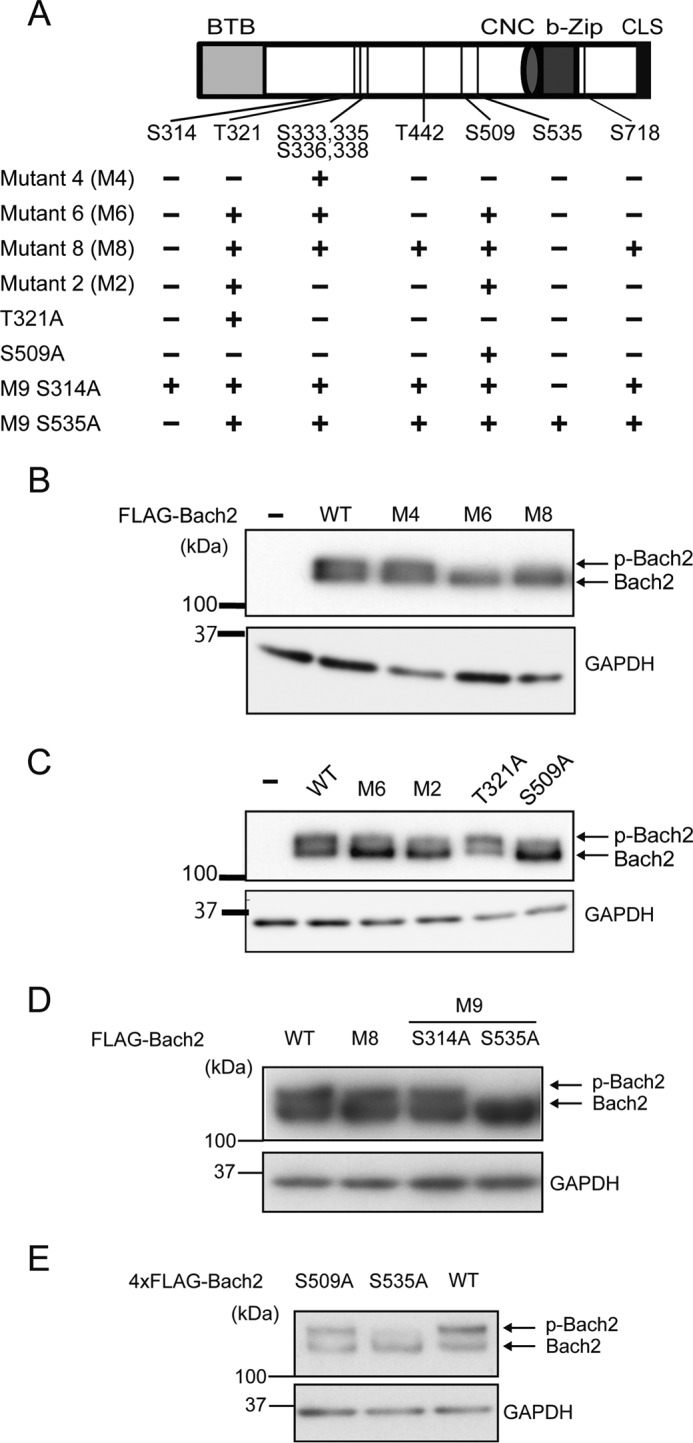
Construction of the Bach2 mutants and their phosphorylation in 293T cells. A, schematic representation of the mutant Bach2 proteins. Each mutant contains substitutions of serine or threonine to alanine at the positions indicated with (+). CNC, Cap'n'Collar region. B–D, immunoblot analysis of the whole cell lysates from 293T cells transfected with the plasmids expressing the FLAG-tagged wild type and mutant Bach2 proteins. Immunoblotting was performed with the FLAG antibody. GAPDH was detected as a loading control. E, immunoblot analysis of Bach2 with the indicated single mutations, tagged with 4×FLAG and expressed in plat-E cells derived from 293T cells (32).
To examine involvement of other candidate sites in phosphorylation, we further mutated Ser-314 or Ser-535 to alanine in the context of Bach2M8 (M9S314A or M9S535A). Interestingly, M9S535A migrated almost as a single band as compared with M8 or wild type Bach2 (Fig. 7D). We finally examined whether a single mutation of S535A would affect the shift of Bach2 in an immunoblotting analysis. Importantly, Bach2S535A resulted in less upper band compared with wild type Bach2 or Bach2S509A (Fig. 7E).
To examine the effect of Ser-509 or Ser-535 mutations upon overall phosphorylation of the mutant Bach2, we compared phosphorylation of Bach2 with or without the mutations by means of SILAC-based quantitative mass spectrometry analysis. We isolated wild type or mutant Bach2 expressed in BAL17 cells using immunoprecipitation and carried out SILAC analysis. The heavy and light ratios were used to compare relative abundance of phosphopeptides. As shown in supplemental Tables 2 and 3, we detected six or eight phosphorylation sites for Bach2S509A and Bach2S535A, respectively, under the experimental conditions. The heavy and light ratios of these peptides were not appreciably altered compared with the wild type Bach2, indicating that their relative abundances were not altered by these mutations. It should be noted that S535A mutation did not affect Ser-509 phosphorylation. Because we carried out the purification in a small scale, the numbers of the detected sites were less in these experiments than in the experiments in Fig. 5B. Therefore, it remains an open question how these two mutations affect phosphorylation of the other sites.
To probe into this possibility, wild type Bach2 or mutant versions (S535A or M9S535A) overexpressed in HEK293T cells were immunoprecipitated and immunoblotted with anti-phosphoserine antibody (Fig. 8). M9S535A showed the highest level of reactivity with the antibody. The single mutation S535A clearly increased Bach2 phosphorylation. Therefore, phosphorylation at Ser-535 and the other sites appears to inhibit the overall level of Bach2 phosphorylation. Therefore, some of serine residues of Bach2 other than those detected by the SILAC experiments underwent increased phosphorylation when Ser-535 and some of the other eight sites were not phosphorylated. Phosphorylation at these sites may affect enzyme accessibility of Bach2 via changing its subcellular localization and/or amounts. This interpretation seems possible considering that many of the Bach2 phosphorylation sites are located in its naturally disordered region that is generally believed to contribute to flexible protein-protein interaction. The mobility of the mutant Bach2 proteins, although they were similar to that of the less phosphorylated form of wild type Bach2, may reflect a combination of increased phosphorylation and effects of the mutations upon physicochemical properties of the proteins.
FIGURE 8.
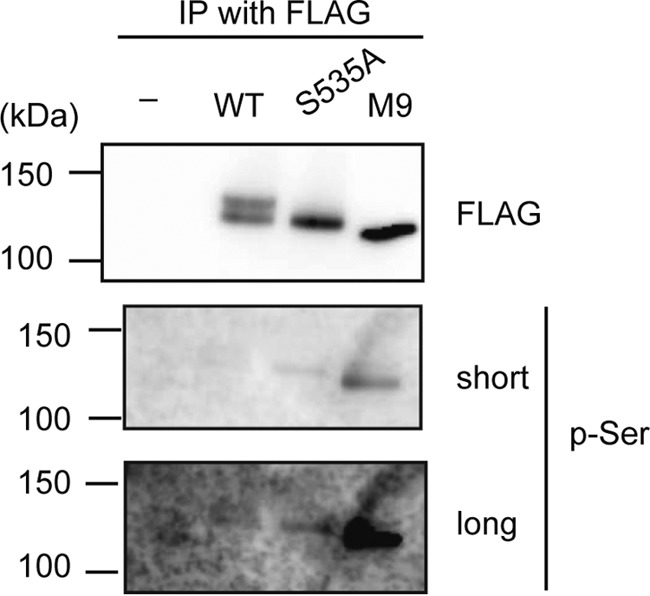
Mutations of phosphorylation sites enhanced Bach2 phosphorylation. The FLAG-tagged wild type Bach2, Bach2-S535A, and Bach2-M9S535A proteins expressed in 293T cells were immunoprecipitated (IP) with FLAG antibody. Immunoblotting was performed with anti-phosphoserine or FLAG antibodies. For the latter, images of shorter and longer exposures are shown.
Ser-535 Is Essential for Inhibiting Nuclear Accumulation of Bach2
To examine the function of Ser-509 and Ser-535, we overexpressed FLAG-tagged Bach2, Bach2S509A, or Bach2S535A in the Irf4−/−Irf8−/− pre-B cell line (39) and compared their subcellular localization. We used this cell system as a model because Irf4−/−Irf8−/− pre-B cells are dependent on IL-7 for proliferation in vitro, which stimulates the PI3K pathway (30) and inhibits the nuclear accumulation of endogenous Bach2.3 By staining the cells with anti-FLAG antibodies, we found that FLAG-Bach2 was present mainly in the cytoplasmic region with an exclusion from the nuclear region in ∼75% of the cells (Fig. 9, A and B). In contrast, FLAG-Bach2S535A showed clear nuclear accumulation in roughly 80% of the cells. FLAG-Bach2S509A also showed a tendency to accumulate within the nuclear region, but the effect was less prominent compared with the S535A mutation. Bach2 with both S509A and S535A mutations showed a distribution pattern similar to that of Bach2S535A. Therefore, we concluded that phosphorylation of Ser-535 was critical to inhibit nuclear accumulation of Bach2 and that Ser-509 phosphorylation played an auxiliary role. When nine of the phosphorylation sites, including Ser-535, were mutated together, the mutant protein FLAG-Bach2M9S535A showed less nuclear accumulation than FLAG-Bach2S535A (Fig. 9, A and B). This observation suggests that some of the phosphorylation sites rather promoted nuclear accumulation of Bach2 in B cells. It is also possible that the increase in the overall level of phosphorylation of Bach2M9S535A (see Fig. 8) affected its subcellular localization.
FIGURE 9.

Bach2 Ser-535 regulates subcellular localization in B cells. A, FLAG-tagged wild type Bach2, Bach2-S535A, Bach2-S509A+S535A, and Bach2-M9S535A proteins in the Irf4−/−Irf8−/− pre-B cells were visualized by immunofluorescence microscopy using the anti-FLAG antibody (red). The GFP fluorescence indicates the cells into which the exogenous Bach2 genes were transduced by retroviral infection (green). DNA was stained with Hoechst 33342 (blue). Scale bar, 10 μm. B, result from A was quantified by classifying the cells according to the subcellular localization of the wild type or mutant FLAG-tagged Bach2 proteins. The graph shows the percentages of cells exhibiting cytoplasm-dominant (N < C), nucleus-dominant (N > C), and even (N = C) distribution of the FLAG-Bach2 proteins. At least 100 GFP-positive cells were counted for each sample. C, FLAG-tagged wild type Bach2 and Bach2-Ser-520A were visualized as in A. D, result from C was quantified as in B.
We have reported previously that human BACH2 is phosphorylated at Ser-521, which regulates its subcellular localization in NIH3T3 cells (27). Therefore, we mutated the corresponding residue of mouse Bach2, Ser-520, and compared its subcellular localization in the Irf4−/−Irf8−/− pre-B cells. The S520A mutation did not affect the cytoplasmic localization of Bach2 in these cells (Fig. 9, C and D). Therefore, the regulatory roles of phosphorylation at Ser-520 and Ser-535 may depend on the developmental stages of B cells and/or cell types.
Ser-535 Is Involved in the Regulation of the Repressor Activity of Bach2
We examined whether the alteration of subcellular localization by the S535A mutation would correlate with its function. We transduced X63/0 plasma cells, which express Prdm1, with wild type FLAG-Bach2 or FLAG-Bach2S535A. After sorting transduced cells with the enhanced GFP expression, we determined the mRNA level of Prdm1. As shown in Fig. 10A, Bach2S535A and Bach2S509A repressed the Prdm1 expression more efficiently than wild type Bach2. The levels of overexpressed Bach2 mRNAs and proteins were not so different as being able to explain the effects upon Prdm1 expression (Fig. 10, B and C). Therefore, phosphorylation at Ser-535 and Ser-509 appeared to interfere with the repressor activity of Bach2. The increased nuclear accumulation of these Bach2 derivatives observed above may explain their efficient repressor activities compared with wild type Bach2.
FIGURE 10.
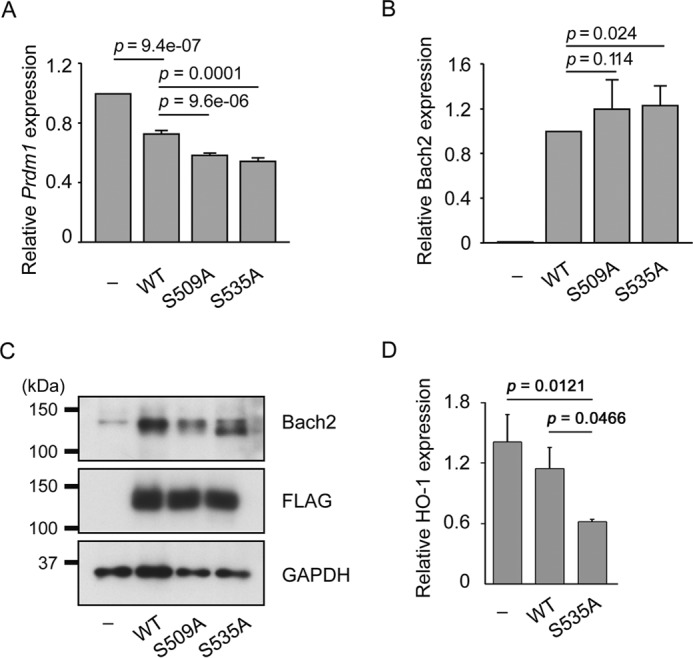
Increased repressor activity of Bach2S509A and Bach2S535A. A, expression of Blimp-1 mRNA in X63/0 murine plasma cells. The cells were infected with overexpressing wild type FLAG-Bach2, FLAG-Bach2S509A, or FLAG-Bach2S535A. After 48 h, transduced cells were collected by flow cytometer using enhanced GFP fluorescence. The mRNA quantities were determined by quantitative PCR, normalized to β-actin mRNA in each sample, and represented as relative values to that in control cells infected with empty virus. The mean values and S.D. of the results from two independent experiments are shown. Statistical significance was determined using the Student's t test, and p values are indicated. B, protein expression levels of FLAG-Bach2 or its mutant versions in X63/0. Immunoblotting was performed with antibodies against Bach2, FLAG epitope, or GAPDH. C, mRNA expression levels of FLAG-Bach2 or its mutant versions in X63/0. The mean values and S.D. of the results from two independent experiments are shown. Statistical significance was determined using the Student's t test, and p values are indicated. D, expression levels of HO-1 mRNA in Irf4−/−Irf8−/− pre-B cells. Cells were infected with retroviruses expressing wild type Bach2 or S535A mutant. The mean values and S.D. of three experiments are shown. Statistical significance was determined using the Student's t test, and p values are indicated.
To further verify the importance of Ser-535 phosphorylation, we examined the expression of heme oxygenase-1 (HO-1), another established target gene of Bach2 (46). In this experiment, we infected Irf4−/−Irf8−/− pre-B cells with retroviruses expressing either wild type Bach2 or S535A. The expression of endogenous HO-1 mRNA was efficiently repressed by Bach2S535A but not by wild type Bach2 (Fig. 10D). Therefore, we concluded that Ser-535 was critical to regulate the expression of its target genes.
Inhibition of mTOR Results in Reduced Expression of Prdm1 in Primary B Cells
To examine the effect of the mTOR pathway on Prdm1 gene expression, mature B1–8hi B cells were isolated and stimulated with CD40L+IL4. The effect of AZD8055, the inhibitor of both mTORC1 and mTORC2, was examined. As shown in Fig. 11, AZD8055 reproducibly reduced the level of Prdm1 mRNA. Therefore, we concluded that mTOR was involved in the enhancement of Prdm1 expression during B cell activation.
FIGURE 11.
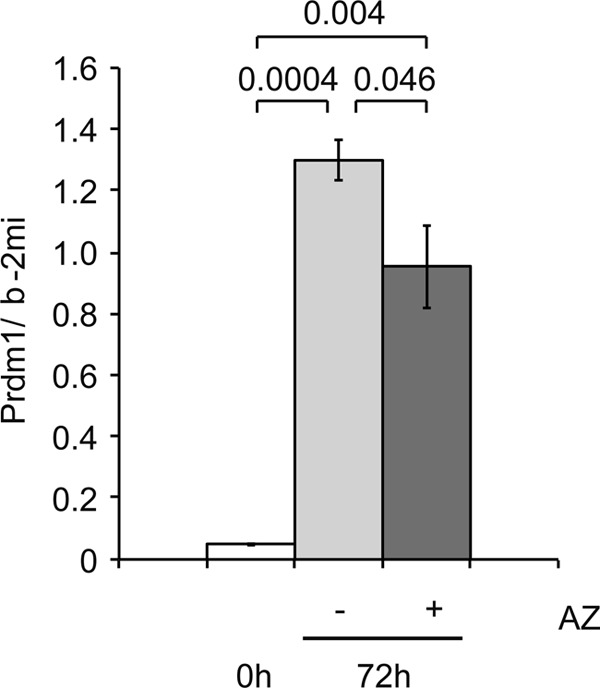
mTOR enhances expression of Prdm1 in primary B cells. Mature B cells isolated from B1–8hi mice were stimulated with IL-2, IL-4, IL-5, CD40L plus NP-Ficoll for the indicated period without or with AZD8055 (AZ). The relative mean values of Prdm1 mRNA, corrected with b-2mi mRNA as an internal control, and S.D. of three independent experiments are shown. Statistical significance was determined using the Student's t test, and p values are indicated.
Discussion
Although Bach2 has been reported as a phosphoprotein (27), this study is the first systematic analysis of its phosphorylation using normal primary B cells. By using the presence of a slower moving band of Bach2 upon immunoblotting as a proxy of its phosphorylation, we found that Bach2 phosphorylation was reduced by treating cells with the inhibitors of PI3K, Akt, or mTOR but not by those of MEK or p38 MAPK (Figs. 3 and 4). These results strongly suggest that Bach2 is phosphorylated by the PI3K-Akt-mTOR pathway. Using mass spectrometry analysis of Bach2 overexpressed in BAL17 B cells, we identified 72 phosphorylation sites, expanding substantially the phosphorylation map of Bach2. Out of the 72 phosphorylation sites identified in this study, 11 sites conform to an mTOR consensus motif (Fig. 6). Considering the effects of mTOR inhibitor Torin1 upon the upper Bach2 band in the immunoblotting (Fig. 4), many of these sites appear to be direct targets of mTOR. Consistent with this idea, the mTORC1 complex directly phosphorylated recombinant Bach2 in vitro (Fig. 5). Rapamycin did not show any effect upon the pattern of Bach2 bands (Fig. 4). However, this does not exclude the involvement of mTORC1 in Bach2 phosphorylation, because rapamycin shows substrate-specific inhibition of mTROC1 (47). Because Bach2 possesses multiple phosphorylation sites, it is not surprising whether additional kinases are involved in the regulation of Bach2. For example, the effect of Torin1 upon Bach2 was partial, and a substantial portion of phosphorylated Bach2 band remained, whereas S6K phosphorylation was completely inhibited (Fig. 4C). Therefore, it is highly likely that other kinases are also involved in the phosphorylation of Bach2 at its multiple sites.
The single mutations of Ser-535 or Ser-509 reduced the shift of Bach2 upon the immunoblotting analysis (Fig. 7). This is counterintuitive to the presence of multiple phosphorylation sites on a single molecule. A most likely explanation is that the nuclear accumulation of Bach2S535A sequestered it from kinases that phosphorylate Bach2 in the cytoplasmic region. Alternatively, Ser-535 phosphorylation may recruit other kinases for further phosphorylation of Bach2. In a strict sense, however, the lower band of Bach2, which increased upon the inhibition of PI3K pathway or S535A mutation, may still be phosphorylated at other sites. This possibility is supported by the observations that S509A or Ser-535 mutations did not alter the levels of phosphorylation at several other sites detected in the SILAC analysis and that the reactivity of Bach2 with anti-phosphoserine antibody was increased in the presence of mutations of Ser-535 and other sites (Fig. 8). It is also possible that many of the phosphorylation sites identified in this study using the mass spectrometry analysis are actually modified in minor fractions of Bach2 in a heterogeneous manner. In this case, considering the effect of its mutation upon the protein mobility in the immunoblotting analysis, Ser-535 may be the major site of phosphorylation. Because some of the phosphorylation sites we identified here may be regulated by specific upstream signaling events other than the PI3K pathway, we need to carry out a phosphoproteome analysis using different conditions that are relevant to the immune system.
The presence of multiple phosphorylation sites on a particular protein usually hinders functional analysis because they could be redundant in terms of regulatory roles or devoid of any physiological role (48, 49). This study revealed that, out of the multiple phosphorylation sites, a single serine (Ser-535) was essential for inhibiting the nuclear accumulation of Bach2 and its repressor activity in B cells, with an auxiliary role contributed by Ser-509. Considering that these sites were phosphorylated in B cells, phosphorylation of Ser-535 and Ser-509 may inhibit nuclear accumulation of Bach2 either by promoting its nuclear export or inhibiting its nuclear import. Bach1 and Bach2 possess a cytoplasmic localization signal (CLS) that mediates Crm1-dependent nuclear export (50). Although the Bach2 CLS, which is located at the C terminus, is not close to Ser-535 and Ser-509 in the primary sequence, phosphorylation of these residues may activate the CLS function through a tertiary structure. Alternatively, considering that Bach1 possesses another nuclear export signal upstream of the basic leucine zipper domain (51, 52), Bach2 may also carry an additional nuclear export signal around Ser-535 and Ser-509 whose activity is regulated by their phosphorylation. Rather than regulating the nuclear export of Bach2, phosphorylation of Ser-535 and Ser-509 may allow its binding to an anchoring protein in the cytoplasmic region.
Phosphorylation of Bach2 at sites other than Ser-535 and Ser-509 may also be of functional significance. The presence of multiple phosphorylation sites may provide an integration and/or separation of signaling cascades (48). Some of the phosphorylation may cross-talk with other modifications. Phosphorylation sites near other modifications (i.e. acetylation, ubiquitination, and sumoylation) tend to be conserved (53). Interestingly, 24 of the phosphorylation sites are present in the minimal heme-binding region of Bach2 (residues 331–520) (35). Because heme induces a structural change in this region (35), binding of heme to Bach2 may affect phosphorylation at these sites. The signal of heme may be transduced as phosphorylation of Bach2. Because heme binding de-stabilizes Bach2 in cells (46), phosphorylation of these residues may be involved in the regulation of protein degradation. Another important point is the fact that many of these phosphorylation sites are within the intrinsically disordered region of Bach2 (35). Therefore, phosphorylation of these residues may induce a conformational change of the disordered region, thereby regulating its function such as protein interaction. Human BACH2 is phosphorylated at Ser-521, which inhibits BACH2 nuclear accumulation in NIH3T3 cells (27). This site corresponds to Ser-520 of mouse Bach2, which was phosphorylated in our mass spectrometry analysis. We found by using the pre-B cell line that Ser-520 was not involved in the regulation of subcellular localization (Fig. 9). Therefore, each phosphorylation within this small region of Bach2 may play specific roles depending on the developmental stages of B cells and cell types. The presence of multiple phosphorylation sites suggests that Bach2 may function as a signaling hub in the immune system.
The connections of Bach2 with the upstream PI3K signaling at the transcriptional and post-translational levels we found here now allow insights into the mechanisms and future perspectives in the immune cell responses. The PI3K pathway inactivates Foxo1, which is an upstream activator of Bach2 expression in B cells (54). Consistent with this, Bach2 mRNA expression decreased in Pten−/− B cells (Fig. 1C). Therefore, we suggest that the PI3K pathway suppresses the expression of Bach2 in part by Foxo1 inactivation. The expression of Bach2 mRNA shows dynamic patterns in lymphoid cells. Along the B cell development, Bach2 mRNA is first induced in common lymphoid progenitors (5). Its expression is further induced in pro-B and pre-B cells.4 At the pre-B cell stage, Bach2 functions as a part of the pre-B cell receptor checkpoint to remove B cells with failed recombination of the antibody genes (6). It will be important to investigate whether the PI3K-Akt-FoxO1 pathway is involved in this initial activation of Bach2 in common lymphoid progenitors to promote their commitment to B cells and/or to maintain the pre-B cell homeostasis. In T cells, the expression of Bach2 is higher in peripheral T cells than thymocytes (14) and regulates the expression of diverse T cell effector genes such as S100 calcium-binding protein A, interferon γ, IL-4, GATA-3, granzymes, as well as Prdm1 (13, 14, 16, 55, 56). Considering that the T cell receptor as well as many of the cytokine receptors are directly or indirectly connected with PI3K, the inhibition of Foxo1 by this signaling cascade may decrease the expression of Bach2 mRNA in activated T cells as well. Such a GRN may be important to take the balance between the generation of effector and regulatory T cells in response to an antigen.
The function of the PI3K pathway in CSR in activated B cells may also involve Bach2. The inhibition of CSR by PI3K has been suggested to occur via the Akt-mediated inhibition of Foxo1 and induction of Prdm1 expression (40). Based on the facts that Bach2 promotes CSR by repressing Prdm1 expression (delay driven diversity model (8, 9)), we propose that the PI3K pathway inhibits CSR and promotes expression of Prdm1 by repressing the expression of the Bach2 gene. Because PI3K inactivates Foxo1, which is an upstream activator of Bach2 expression in B cells (54), the PI3K pathway suppresses the expression of Bach2 in part by Foxo1 inactivation. Upon an activation of primary B cells to stimulate CSR in vitro, Bach2 protein shows an interesting distribution; Bach2 is present in nuclei undergoing CSR, although it is absent or cytoplasmic in cells undergoing plasma cell differentiation without CSR (8). Such a regulation of the subcellular localization of Bach2 may also involve PI3K and the phosphorylation of Bach2 at Ser-535. The Ser-535 phosphorylation-dependent cytoplasmic accumulation of Bach2 may modulate B cells to skip CSR, resulting in the terminal differentiation of IgM-secreting plasma cells.
In conclusion, we have demonstrated that the PI3K pathway represses the expression of Bach2 and induces its phosphorylation in activated B cells. Phosphorylation of Ser-535 and Ser-509 may regulate the responses of immune cells including CSR. The PI3K pathway regulates development, differentiation, and responses to antigen of B and T cells (4), in which Bach2 is emerging as an interesting and important hub connecting the GRN with the phosphoprotein signaling.
Author Contributions
K. I. and R. A. conceived and coordinated the study and wrote the paper with H. S., T. T., M. W. M., K. O., and A. M. R. A., H. S., T. T., Y. S., M. W. M., K. O., A. M., and K. I. analyzed the data. M. N. assisted with coordination of the study. R. A. carried out experiments reported in Figs. 1–4, 6, and 7 and other related experiments in collaboration with H. S., K. O., and A. M. M. W. M. carried out the experiments in Fig. 5 using reagents and unpublished protocols provided by T. M. H. S. carried out the experiments using mass spectrometry. T. T., Y. S., and K. I. assisted with the experiments in Fig. 7. H. K. carried out the experiments in Fig. 8. T. T. carried out the experiments in Fig. 9 with help from K. O. N. S. and A. M. carried out the experiments in Fig. 10. K. O. carried out the experiments in Fig. 11. H. M., K. T., and M. Y. generated the Pten-deficient mice used in Fig. 1. All authors reviewed the results and approved the final version of the manuscript.
Supplementary Material
Acknowledgments
We thank Akira Suzuki (Kyushu University) for donating the Ptenflox/flox mice. We thank Daisuke Higo (Thermo Fisher) for valuable advice on the MS/MS data analysis. We thank Keiko Nakayama (Tohoku University) for donating some of the antibodies used. We thank the members of the Igarashi laboratory for helpful discussions. Restoration of the laboratory from the damage due to the 2011 Tohoku earthquake was provided in part by the Astellas Foundation for Research on Metabolic Disorders, the Banyu Foundation, the Naito Foundation, A. Miyazaki, and A. Iida.
This work was supported by Grants-in-aid 15H02506, 25670156, 24390066, 23116003, 21249014, 17054028, and 25291042 from the Japan Society for the Promotion of Science and the Network Medicine Global COE Program from the Ministry of Education, Culture, Sport, Science. The authors declare that they have no conflicts of interest with the contents of this article.

This article contains Tables S1–S3.
T. Tamahara, K. Ochiai, and K. Igarashi, manuscript in preparation.
A. Itoh-Nakadai and K. Igarashi, unpublished observation.
- BCR
- B cell receptor
- CSR
- class switch recombination
- GRN
- gene regulatory network
- mTOR
- mammalian target of rapamycin
- SILAC
- stable isotope labeling by amino acids in cell culture
- CIAP
- calf intestinal alkaline phosphatase
- CID
- collision-induced dissociation
- IT
- ion trap
- FT
- Fourier transform
- Pten
- phosphatase and tensin
- CLS
- cytoplasmic localization signal.
References
- 1. Li H. S., and Watowich S. S. (2014) Innate immune regulation by STAT-mediated transcriptional mechanisms. Immunol. Rev. 261, 84–101 [DOI] [PMC free article] [PubMed] [Google Scholar]
- 2. Hayden M. S., and Ghosh S. (2012) NF-κB, the first quarter-century: remarkable progress and outstanding questions. Genes Dev. 26, 203–234 [DOI] [PMC free article] [PubMed] [Google Scholar]
- 3. Savitsky D., Tamura T., Yanai H., and Taniguchi T. (2010) Regulation of immunity and oncogenesis by the IRF transcription factor family. Cancer Immunol. Immunother. 59, 489–510 [DOI] [PMC free article] [PubMed] [Google Scholar]
- 4. Okkenhaug K. (2013) Signaling by the phosphoinositide 3-kinase family in immune cells. Annu. Rev. Immunol. 31, 675–704 [DOI] [PMC free article] [PubMed] [Google Scholar]
- 5. Itoh-Nakadai A., Hikota R., Muto A., Kometani K., Watanabe-Matsui M., Sato Y., Kobayashi M., Nakamura A., Miura Y., Yano Y., Tashiro S., Sun J., Ikawa T., Ochiai K., Kurosaki T., and Igarashi K. (2014) The transcription repressors Bach2 and Bach1 promote B cell development by repressing the myeloid program. Nat. Immunol. 15, 1171–1180 [DOI] [PubMed] [Google Scholar]
- 6. Swaminathan S., Huang C., Geng H., Chen Z., Harvey R., Kang H., Ng C., Titz B., Hurtz C., Sadiyah M. F., Nowak D., Thoennissen G. B., Rand V., Graeber T. G., Koeffler H. P., et al. (2013) BACH2 mediates negative selection and p53-dependent tumor suppression at the pre-B cell receptor checkpoint. Nat. Med. 19, 1014–1022 [DOI] [PMC free article] [PubMed] [Google Scholar]
- 7. Muto A., Tashiro S., Nakajima O., Hoshino H., Takahashi S., Sakoda E., Ikebe D., Yamamoto M., and Igarashi K. (2004) The transcriptional programme of antibody class switching involves the repressor Bach2. Nature 429, 566–571 [DOI] [PubMed] [Google Scholar]
- 8. Muto A., Ochiai K., Kimura Y., Itoh-Nakadai A., Calame K. L., Ikebe D., Tashiro S., and Igarashi K. (2010) Bach2 represses plasma cell gene regulatory network in B cells to promote antibody class switch. EMBO J. 29, 4048–4061 [DOI] [PMC free article] [PubMed] [Google Scholar]
- 9. Ochiai K., Katoh Y., Ikura T., Hoshikawa Y., Noda T., Karasuyama H., Tashiro S., Muto A., and Igarashi K. (2006) Plasmacytic transcription factor Blimp-1 is repressed by Bach2 in B cells. J. Biol. Chem. 281, 38226–38234 [DOI] [PubMed] [Google Scholar]
- 10. Ochiai K., Muto A., Tanaka H., Takahashi S., and Igarashi K. (2008) Regulation of the plasma cell transcription factor Blimp-1 gene by Bach2 and Bcl6. Int. Immunol. 20, 453–460 [DOI] [PubMed] [Google Scholar]
- 11. Kometani K., Nakagawa R., Shinnakasu R., Kaji T., Rybouchkin A., Moriyama S., Furukawa K., Koseki H., Takemori T., and Kurosaki T. (2013) Repression of the transcription factor Bach2 contributes to predisposition of IgG1 memory B cells toward plasma cell differentiation. Immunity 39, 136–147 [DOI] [PubMed] [Google Scholar]
- 12. Igarashi K., Ochiai K., Itoh-Nakadai A., and Muto A. (2014) Orchestration of plasma cell differentiation by Bach2 and its gene regulatory network. Immunol. Rev. 261, 116–125 [DOI] [PubMed] [Google Scholar]
- 13. Roychoudhuri R., Hirahara K., Mousavi K., Clever D., Klebanoff C. A., Bonelli M., Sciume G., Zare H., Vahedi G., Dema B., Yu Z., Liu H., Takahashi H., Rao M., Muranski P., et al. (2013) BACH2 represses effector programs to stabilize T(reg)-mediated immune homeostasis. Nature 498, 506–510 [DOI] [PMC free article] [PubMed] [Google Scholar]
- 14. Tsukumo S., Unno M., Muto A., Takeuchi A., Kometani K., Kurosaki T., Igarashi K., and Saito T. (2013) Bach2 maintains T cells in a naive state by suppressing effector memory-related genes. Proc. Natl. Acad. Sci. U.S.A. 110, 10735–10740 [DOI] [PMC free article] [PubMed] [Google Scholar]
- 15. Hu G., and Chen J. (2013) A genome-wide regulatory network identifies key transcription factors for memory CD8(+) T-cell development. Nat. Commun. 4, 2830. [DOI] [PMC free article] [PubMed] [Google Scholar]
- 16. Vahedi G., Kanno Y., Furumoto Y., Jiang K., Parker S. C., Erdos M. R., Davis S. R., Roychoudhuri R., Restifo N. P., Gadina M., Tang Z., Ruan Y., Collins F. S., Sartorelli V., and O'Shea J. J. (2015) Super-enhancers delineate disease-associated regulatory nodes in T cells. Nature 520, 558–562 [DOI] [PMC free article] [PubMed] [Google Scholar]
- 17. Nakamura A., Ebina-Shibuya R., Itoh-Nakadai A., Muto A., Shima H., Saigusa D., Aoki J., Ebina M., Nukiwa T., and Igarashi K. (2013) Transcription repressor Bach2 is required for pulmonary surfactant homeostasis and alveolar macrophage function. J. Exp. Med. 210, 2191–2204 [DOI] [PMC free article] [PubMed] [Google Scholar]
- 18. Plagnol V., Howson J. M., Smyth D. J., Walker N., Hafler J. P., Wallace C., Stevens H., Jackson L., Simmonds M. J., Type 1 Diabetes Genetics Consortium, Bingley P. J., Gough S. C., and Todd J. A. (2011) Genome-wide association analysis of autoantibody positivity in type 1 diabetes cases. PLoS Genet. 7, e1002216. [DOI] [PMC free article] [PubMed] [Google Scholar]
- 19. Cooper J. D., Smyth D. J., Smiles A. M., Plagnol V., Walker N. M., Allen J. E., Downes K., Barrett J. C., Healy B. C., Mychaleckyj J. C., Warram J. H., and Todd J. A. (2008) Meta-analysis of genome-wide association study data identifies additional type 1 diabetes risk loci. Nat. Genet. 40, 1399–1401 [DOI] [PMC free article] [PubMed] [Google Scholar]
- 20. Franke A., McGovern D. P., Barrett J. C., Wang K., Radford-Smith G. L., Ahmad T., Lees C. W., Balschun T., Lee J., Roberts R., Anderson C. A., Bis J. C., Bumpstead S., Ellinghaus D., Festen E. M., et al. (2010) Genome-wide meta-analysis increases to 71 the number of confirmed Crohn's disease susceptibility loci. Nat. Genet. 42, 1118–1125 [DOI] [PMC free article] [PubMed] [Google Scholar]
- 21. Dubois P. C., Trynka G., Franke L., Hunt K. A., Romanos J., Curtotti A., Zhernakova A., Heap G. A., Adány R., Aromaa A., Bardella M. T., van den Berg L. H., Bockett N. A., de la Concha E. G., Dema B., et al. (2010) Multiple common variants for celiac disease influencing immune gene expression. Nat. Genet. 42, 295–302 [DOI] [PMC free article] [PubMed] [Google Scholar]
- 22. Medici M., Porcu E., Pistis G., Teumer A., Brown S. J., Jensen R. A., Rawal R., Roef G. L., Plantinga T. S., Vermeulen S. H., Lahti J., Simmonds M. J., Husemoen L. L., Freathy R. M., Shields B. M., et al. (2014) Identification of novel genetic Loci associated with thyroid peroxidase antibodies and clinical thyroid disease. PLoS Genet. 10, e1004123. [DOI] [PMC free article] [PubMed] [Google Scholar]
- 23. McAllister K., Yarwood A., Bowes J., Orozco G., Viatte S., Diogo D., Hocking L. J., Steer S., Wordsworth P., Wilson A. G., Morgan A. W., UK Rheumatoid Arthritis Genetics Consortium, Rheumatoid Arthritis Consortium International, Kremer J. M., Pappas D., et al. (2013) Identification of BACH2 and RAD51B as rheumatoid arthritis susceptibility loci in a meta-analysis of genome-wide data. Arthritis Rheum. 65, 3058–3062 [DOI] [PMC free article] [PubMed] [Google Scholar]
- 24. Ferreira M. A., Matheson M. C., Duffy D. L., Marks G. B., Hui J., Le Souëf P., Danoy P., Baltic S., Nyholt D. R., Jenkins M., Hayden C., Willemsen G., Ang W., Kuokkanen M., Beilby J., et al. (2011) Identification of IL6R and chromosome 11q13.5 as risk loci for asthma. Lancet 378, 1006–1014 [DOI] [PMC free article] [PubMed] [Google Scholar]
- 25. Jin Y., Birlea S. A., Fain P. R., Ferrara T. M., Ben S., Riccardi S. L., Cole J. B., Gowan K., Holland P. J., Bennett D. C., Luiten R. M., Wolkerstorfer A., van der Veen J. P., Hartmann A., Eichner S., et al. (2012) Genome-wide association analyses identify 13 new susceptibility loci for generalized vitiligo. Nat. Genet. 44, 676–680 [DOI] [PMC free article] [PubMed] [Google Scholar]
- 26. Suzuki A., Kaisho T., Ohishi M., Tsukio-Yamaguchi M., Tsubata T., Koni P. A., Sasaki T., Mak T. W., and Nakano T. (2003) Critical roles of Pten in B cell homeostasis and immunoglobulin class switch recombination. J. Exp. Med. 197, 657–667 [DOI] [PMC free article] [PubMed] [Google Scholar]
- 27. Yoshida C., Yoshida F., Sears D. E., Hart S. M., Ikebe D., Muto A., Basu S., Igarashi K., and Melo J. V. (2007) Bcr-Abl signaling through the PI-3/S6 kinase pathway inhibits nuclear translocation of the transcription factor Bach2, which represses the antiapoptotic factor heme oxygenase-1. Blood 109, 1211–1219 [DOI] [PubMed] [Google Scholar]
- 28. Zhang J., Grindley J. C., Yin T., Jayasinghe S., He X. C., Ross J. T., Haug J. S., Rupp D., Porter-Westpfahl K. S., Wiedemann L. M., Wu H., and Li L. (2006) PTEN maintains haematopoietic stem cells and acts in lineage choice and leukaemia prevention. Nature 441, 518–522 [DOI] [PubMed] [Google Scholar]
- 29. Shih T. A., Roederer M., and Nussenzweig M. C. (2002) Role of antigen receptor affinity in T cell-independent antibody responses in vivo. Nat. Immunol. 3, 399–406 [DOI] [PubMed] [Google Scholar]
- 30. Ochiai K., Maienschein-Cline M., Mandal M., Triggs J. R., Bertolino E., Sciammas R., Dinner A. R., Clark M. R., and Singh H. (2012) A self-reinforcing regulatory network triggered by limiting IL-7 activates pre-BCR signaling and differentiation. Nat. Immunol. 13, 300–307 [DOI] [PMC free article] [PubMed] [Google Scholar]
- 31. Muto A., Tashiro S., Tsuchiya H., Kume A., Kanno M., Ito E., Yamamoto M., and Igarashi K. (2002) Activation of Maf/AP-1 repressor Bach2 promotes apoptosis and its interaction with PML nuclear bodies. J. Biol. Chem. 277, 20724–20733 [DOI] [PubMed] [Google Scholar]
- 32. Morita S., Kojima T., and Kitamura T. (2000) Plat-E: an efficient and stable system for transient packaging of retroviruses. Gene Ther. 7, 1063–1066 [DOI] [PubMed] [Google Scholar]
- 33. Yamasaki C., Tashiro S., Nishito Y., Sueda T., and Igarashi K. (2005) Dynamic cytoplasmic anchoring of the transcription factor Bach1 by intracellular hyaluronic acid binding protein IHABP. J. Biochem. 137, 287–296 [DOI] [PubMed] [Google Scholar]
- 34. Oyake T., Itoh K., Motohashi H., Hayashi N., Hoshino H., Nishizawa M., Yamamoto M., and Igarashi K. (1996) Bach proteins belong to a novel family of BTB-basic leucine zipper transcription factors that interact with MafK and regulate transcription through the NF-E2 site. Mol. Cell. Biol. 16, 6083–6095 [DOI] [PMC free article] [PubMed] [Google Scholar]
- 35. Watanabe-Matsui M., Matsumoto T., Matsui T., Ikeda-Saito M., Muto A., Murayama K., and Igarashi K. (2015) Heme binds to an intrinsically disordered region of Bach2 and alters its conformation. Arch. Biochem. Biophys. 565, 25–31 [DOI] [PubMed] [Google Scholar]
- 36. Ohne Y., Takahara T., Hatakeyama R., Matsuzaki T., Noda M., Mizushima N., and Maeda T. (2008) Isolation of hyperactive mutants of mammalian target of rapamycin. J. Biol. Chem. 283, 31861–31870 [DOI] [PubMed] [Google Scholar]
- 37. Lawrence A. M., and Besir H. U. (2009) Staining of proteins in gels with Coomassie G-250 without organic solvent and acetic acid. J. Vis. Exp. 30, 1350. [DOI] [PMC free article] [PubMed] [Google Scholar]
- 38. Larsen M. R., Thingholm T. E., Jensen O. N., Roepstorff P., and Jørgensen T. J. (2005) Highly selective enrichment of phosphorylated peptides from peptide mixtures using titanium dioxide microcolumns. Mol. Cell. Proteomics 4, 873–886 [DOI] [PubMed] [Google Scholar]
- 39. Lu R., Medina K. L., Lancki D. W., and Singh H. (2003) IRF-4,8 orchestrate the pre-B-to-B transition in lymphocyte development. Genes Dev. 17, 1703–1708 [DOI] [PMC free article] [PubMed] [Google Scholar]
- 40. Omori S. A., Cato M. H., Anzelon-Mills A., Puri K. D., Shapiro-Shelef M., Calame K., and Rickert R. C. (2006) Regulation of class-switch recombination and plasma cell differentiation by phosphatidylinositol 3-kinase signaling. Immunity 25, 545–557 [DOI] [PubMed] [Google Scholar]
- 41. Aoki M., Jiang H., and Vogt P. K. (2004) Proteasomal degradation of the FoxO1 transcriptional regulator in cells transformed by the P3k and Akt oncoproteins. Proc. Natl. Acad. Sci. U.S.A. 101, 13613–13617 [DOI] [PMC free article] [PubMed] [Google Scholar]
- 42. Mizuno T., and Rothstein T. L. (2005) B cell receptor (BCR) cross-talk: CD40 engagement enhances BCR-induced ERK activation. J. Immunol. 174, 3369–3376 [DOI] [PubMed] [Google Scholar]
- 43. Thoreen C. C., Kang S. A., Chang J. W., Liu Q., Zhang J., Gao Y., Reichling L. J., Sim T., Sabatini D. M., and Gray N. S. (2009) An ATP-competitive mammalian target of rapamycin inhibitor reveals rapamycin-resistant functions of mTORC1. J. Biol. Chem. 284, 8023–8032 [DOI] [PMC free article] [PubMed] [Google Scholar]
- 44. Loewith R., Jacinto E., Wullschleger S., Lorberg A., Crespo J. L., Bonenfant D., Oppliger W., Jenoe P., and Hall M. N. (2002) Two TOR complexes, only one of which is rapamycin sensitive, have distinct roles in cell growth control. Mol. Cell 10, 457–468 [DOI] [PubMed] [Google Scholar]
- 45. Hsu P. P., Kang S. A., Rameseder J., Zhang Y., Ottina K. A., Lim D., Peterson T. R., Choi Y., Gray N. S., Yaffe M. B., Marto J. A., and Sabatini D. M. (2011) The mTOR-regulated phosphoproteome reveals a mechanism of mTORC1-mediated inhibition of growth factor signaling. Science 332, 1317–1322 [DOI] [PMC free article] [PubMed] [Google Scholar]
- 46. Watanabe-Matsui M., Muto A., Matsui T., Itoh-Nakadai A., Nakajima O., Murayama K., Yamamoto M., Ikeda-Saito M., and Igarashi K. (2011) Heme regulates B-cell differentiation, antibody class switch, and heme oxygenase-1 expression in B cells as a ligand of Bach2. Blood 117, 5438–5448 [DOI] [PubMed] [Google Scholar]
- 47. Baretić D., and Williams R. L. (2014) The structural basis for mTOR function. Semin. Cell Dev. Biol. 36, 91–101 [DOI] [PubMed] [Google Scholar]
- 48. Nishi H., Demir E., and Panchenko A. R. (2015) Crosstalk between signaling pathways provided by single and multiple protein phosphorylation sites. J. Mol. Biol. 427, 511–520 [DOI] [PMC free article] [PubMed] [Google Scholar]
- 49. Bodenmiller B., Wanka S., Kraft C., Urban J., Campbell D., Pedrioli P. G., Gerrits B., Picotti P., Lam H., Vitek O., Brusniak M. Y., Roschitzki B., Zhang C., Shokat K. M., Schlapbach R., et al. (2010) Phosphoproteomic analysis reveals interconnected system-wide responses to perturbations of kinases and phosphatases in yeast. Sci. Signal. 3, rs4. [DOI] [PMC free article] [PubMed] [Google Scholar]
- 50. Hoshino H., Kobayashi A., Yoshida M., Kudo N., Oyake T., Motohashi H., Hayashi N., Yamamoto M., and Igarashi K. (2000) Oxidative stress abolishes leptomycin B-sensitive nuclear export of transcription repressor Bach2 that counteracts activation of Maf recognition element. J. Biol. Chem. 275, 15370–15376 [DOI] [PubMed] [Google Scholar]
- 51. Suzuki H., Tashiro S., Sun J., Doi H., Satomi S., and Igarashi K. (2003) Cadmium induces nuclear export of Bach1, a transcriptional repressor of heme oxygenase-1 gene. J. Biol. Chem. 278, 49246–49253 [DOI] [PubMed] [Google Scholar]
- 52. Suzuki H., Tashiro S., Hira S., Sun J., Yamazaki C., Zenke Y., Ikeda-Saito M., Yoshida M., and Igarashi K. (2004) Heme regulates gene expression by triggering Crm1-dependent nuclear export of Bach1. EMBO J. 23, 2544–2553 [DOI] [PMC free article] [PubMed] [Google Scholar]
- 53. Beltrao P., Albanèse V., Kenner L. R., Swaney D. L., Burlingame A., Villén J., Lim W. A., Fraser J. S., Frydman J., and Krogan N. J. (2012) Systematic functional prioritization of protein posttranslational modifications. Cell 150, 413–425 [DOI] [PMC free article] [PubMed] [Google Scholar]
- 54. Lin Y. C., Jhunjhunwala S., Benner C., Heinz S., Welinder E., Mansson R., Sigvardsson M., Hagman J., Espinoza C. A., Dutkowski J., Ideker T., Glass C. K., and Murre C. (2010) A global network of transcription factors, involving E2A, EBF1 and Foxo1, that orchestrates B cell fate. Nat. Immunol. 11, 635–643 [DOI] [PMC free article] [PubMed] [Google Scholar]
- 55. Kim E. H., Gasper D. J., Lee S. H., Plisch E. H., Svaren J., and Suresh M. (2014) Bach2 regulates homeostasis of Foxp3+ regulatory T cells and protects against fatal lung disease in mice. J. Immunol. 192, 985–995 [DOI] [PMC free article] [PubMed] [Google Scholar]
- 56. Kuwahara M., Suzuki J., Tofukuji S., Yamada T., Kanoh M., Matsumoto A., Maruyama S., Kometani K., Kurosaki T., Ohara O., Nakayama T., and Yamashita M. (2014) The Menin-Bach2 axis is critical for regulating CD4 T-cell senescence and cytokine homeostasis. Nat. Commun. 5, 3555. [DOI] [PMC free article] [PubMed] [Google Scholar]
Associated Data
This section collects any data citations, data availability statements, or supplementary materials included in this article.