Abstract
Nano-sized Fe3O4 and Fe2O3 were synthesized using a precipitation method. The nanomaterials were tested as adsorbents for the removal of both Cu2+ and Pb2+ ions. The nanomaterials were characterized using X-ray powder diffraction to determine both the phase and the average grain size of the synthesized nanomaterials. Batch pH studies were performed to determine the optimum binding pH for both the Cu2+ and Pb2+ to the synthesized nanomaterials. The optimum binding was observed to occur at pH 4 and above. Time dependency studies for Cu2+ and Pb2+ showed the binding occurred within the first five minutes of contact and remained constant up to 2 hours of contact. Isotherm studies were utilized to determine the binding capacity of each of the nanomaterials for Cu2+ and Pb2+. The binding capacity of Fe3O4 with Cu2+ and Pb2+ were 37.04 mg/g and 166.67 mg/g, respectively. The binding capacities of the Fe2O3 nanomaterials with Cu2+ and Pb2+ were determined to be 19.61 mg/g and 47.62 mg/g, respectively. In addition, interference studies showed no significant reduction in the binding of either Cu2+ or Pb2+ to the Fe3O4 or Fe2O3 nanomaterials in the presence of solutions containing the individual ions Na+, K+, Mg2+ and Ca2+ or a solution consisting of a combination of all the aforementioned cations in one solution.
Keywords: Copper, Lead, iron oxide nanomaterials, sorption, XRD, ICP-OES
1. Introduction
Contamination of potable water is a major global environmental and human heath concern as more and more countries become industrialized. Both copper and lead are of interest due to numerous health concerns associated with exposure to these heavy metals. At low concentrations, lead has been shown to affect the nervous and renal systems; lead has been shown to negatively affect the synthesis of heme (1,2). Exposure to high levels of copper has been associated with liver damage nausea, abdominal pain, diarrhea, and vomiting (3). Many common industrial processes such as battery manufacturing, battery recycling, paint manufacturing, metal smelting, oil refining, mining, electroplating, and the manufacturing of alloys; produce large amounts of copper and lead contaminated waste. Disposal of copper and lead contaminated wastes have been shown to contaminate natural clean water (4, 5). Heavy metal contamination is of a concern due to the difficulty of the remediation of heavy metals from soils (1).
Various methods have been studied for the removal of heavy metal ions, which include: ion exchange, biosorption, activated carbon sorption, solvent extraction, precipitation, coagulation, and adsorption (6, 7). Although these methods have been shown to be effective for the remediation of heavy metals, many of the aforementioned methods are either costly or complicated to implement. Adsorption, on the other hand, is relatively inexpensive and easy to implement. The use of nanometer-sized adsorbents has the advantage of higher surface area for increased reactivity (8) Recent studies have shown that nano-sized Fe3O4 and Al2O3 were effective for the removal of lead, with Fe3O4 having a higher binding capacity than the Al2O3 (9). A second study showed that Fe3O4 had a binding capacity 10 times higher for copper and lead than a CuO nanomaterial (10). The use of Fe3O4 nanomaterials have the added benefit of superparamagnetism and can be easily removed using a magnet, thus the removal of contaminates can be achieved using magnets/magnetic fields.
In this study nano-sized Fe3O4 and Fe2O3 were synthesized using a titration/precipitation method. The method involved the titration of solutions of iron(III) chloride or iron (II) chloride with sodium hydroxide. The resulting nanoparticles were characterized using X-ray diffraction to determine their crystal structure and average grain size. The nanomaterials were then investigated for their potential as adsorbents for Cu2+ and Pb2+ in solution. Batch studies were performed to determine the optimum binding pH, equilibration time, and binding capacity. The binding capacity studies were performed using isotherm studies and found to follow the Langmuir isotherm. In addition, the effects of K+, Na+, Ca2+, and Mg2+ ions on the binding of both copper and lead were also investigated at the optimal binding pH.
2. Experimental
2.1. Synthesis of iron nanomaterials
Fe3O4 and Fe2O3 was synthesized via a slow titration/precipitation method. Fe3O4 was synthesized using a 1.0 L 30 mM solution of iron (II) chloride, which was titrated drop wise with 100 mL of 1 M sodium hydroxide. The 30 mM iron (II) chloride was prepared by dissolving 30 mmol (5.964 g) of iron (II) chloride in 1.0 L of 18 MΩ Millipore water. The Fe2O3 nanomaterial was synthesized using the same method a 1.0 L 30 mmol of iron (III) chloride was titrated using 100 mL of 1 M sodium hydroxide. The 30 mM FeCl3 solution was prepared by dissolving (8.109 g) of iron (III) chloride in 1 L of 18 MΩ Millipore water. The 1 M sodium hydroxide was prepared by dissolving 40.0 g of sodium hydroxide in 18 MΩ Millipore water. The titration of the iron(II) and iron(III) solutions was performed at rate of 1 mL min−1 under vigorous stirring. Subsequent to the addition of the NaOH to the iron solutions the samples were boiled for 1 hr under vigorous stirring. The solutions were then cooled to room temperature, centrifuged at 3500 rpm for 5 minutes, decanted, suspended again in 18.0 MΩ deionized water centrifuged. The nanomaterials were washed three times using 18.0 MΩ deionized water followed by centrifugation to remove any by-products and unreacted starting material. The resulting nanoparticles were oven dried overnight at 70°C.
2.2. Characterization of iron nanomaterials
The synthesized Fe3O4 and Fe2O3 nanomaterials were characterized using a Rigaku Miniflex XRD equipped with a scintillation detector. The samples scans were collected from 20° to 60° (2θ) with a count time of 1 s and a step of 0.01° in 2θ. The resulting diffraction patterns were then fitted using the Le Bail fitting procedure and crystal structure data from the literature (11, 12). The Average grain size of the nanoparticles was determined using Scherrer’s equation and the full width at half maximum of three independent diffraction peaks.
2.3. pH study
Stock solutions of either Cu2+ or Pb2+ were prepared at concentrations of 300 ppb. The pH of the stock solutions were adjusted to 2,3,4,5, 6 using either dilute nitric acid or dilute sodium hydroxide. From the pH adjusted stock solutions 4 mL aliquots of the solution was then placed into 5 mL tubes, which were preloaded with 10 mg of either Fe3O4 or Fe2O3 nanomaterials. In addition, control reactions were also maintained for all reactions, which consisted of 4 mL aliquots of the Cu2+ or Pb2+ solutions without the nanomaterials. All samples and control reactions were performed in triplicate for statistical purposes. The tubes were capped and placed on a speci-mix rocker and equilibrated for 1 hr. After equilibration the tubes were centrifuged for 5 min at 3000 rpm, decanted, and saved for analysis. Metal analysis was performed using a PerkinElmer AAnalyst 800 atomic absorption spectrometer operated in graphite furnace mode. All calibration curves obtained for analysis had correlation coefficients (R2) of 0.99 or better.
2.4. Time Dependency Studies
Samples consisting of 10mg of either Fe3O4 or Fe2O3 were weighted out and placed in 5 mL tubes and 4 mL aliquots of pH adjusted (pH 4) 300 ppb solution of either Cu2+ or 300 ppb Pb2+ were added to the tube. The tubes were then capped and equilibrated for the following times: 5,10, 15, 20, 30, 60, 120, and 240 min. Control samples consisting of either the Cu2+ or Pb2+ ions, without the iron oxide nanoparticles were maintained and treated the same as the reaction samples. All samples and controls were performed in triplicate for statistical purposes. After equilibration the test tubes were centrifuged for 5 min at 3000 rpm, decanted, and the supernatants were saved for analysis. A PerkinElmer AAnalyst 800 atomic spectrometer was used to analyze the samples. Cu2+ and Pb2+ concentrations were determined using calibration curves with correlation coefficients (R2) of 0.99 or better.
2.5. Adsorption isotherm
Isotherm studies were performed under similar conditions as the time dependency studies, with the exception of a fixed 1 hr equilibration time. Solutions of Cu2+ and Pb2+ at the following concentrations: 5, 10, 50, 100, and 1000 ppm were adjusted to a pH 4. A 4.0 mL aliquot of the pH adjusted Cu2+ or Pb2+ solution was added to 5 mL test tubes, containing either 10 mg of Fe3O4 or 10 mg of Fe2O3. The tubes were capped, equilibrated for 1 hr, and centrifuged for 5 min at 3000 rpm. In addition, control samples consisting of either the Cu2+ or Pb2+ solutions were maintained through the equilibration time and treated the same as the samples. The reaction sample and control samples were prepared in triplicate for statistical purposes. Subsequent to centrifuging the supernatants were saved for analysis with a PerkinElmer ICP-OES Optima 8300. Calibration curves with correlations coefficients (R2) values of 0.99 or better were obtained for all analyses.
2.6. Binding interference
The effects of potential interference of secondary cations Na+, K+, Mg2+, and Ca2+ to Cu2+ and Pb2+ binding onto Fe3O4 and Fe2O3 was determined by preparing solutions of 0.3, 3, 30, 300, and 3000 ppm of Na+, K+, Mg2+, and Ca2+ spiked with 300 ppb of either Cu2+ or Pb2+. In addition, a mixture of all four cations was prepared with each cation at the aforementioned concentrations in the presence of 300 ppb of either Cu2+ or Pb2+. All solutions were pH adjusted to 4.0 and 4.0 mL aliquots were added to tubes containing 10 mg of either Fe3O4 or Fe2O3. Control solutions were also prepared consisting of the mixture of cations without the nanomaterials present. The test tubes were capped, equilibrated for 1 hr, centrifuged for 5 min at 3000 rpm, decanted, and the supernatants were saved for analysis. Analysis was performed using a PerkinElmer ICP-OES Optima 8300 using calibration curves with correlations coefficients (R2) values of 0.99 or better.
3. Results
3.1. X-ray Diffraction of synthesized iron oxides
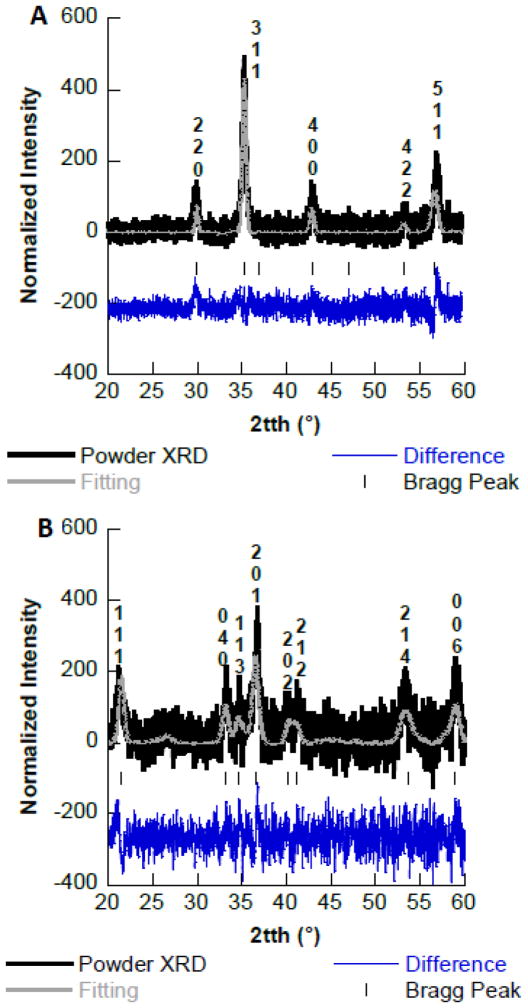
The XRD patterns for the Fe3O4 and Fe2O3 synthesized are presented in Fig 1. Fig. 1A shows the XRD pattern for Fe3O4 contains the 220, 311, 400, 422, and 511 Miller indices, indicating that the magnetite phase was obtained (13). The observed Miller indices correspond to the diffraction peaks observed at the following angles 30.11, 35.44, 37.11, 43.11, 47.11, 53.44, and 57.00 in 2θ. Fig. 1B shows the XRD pattern obtained for Fe2O3 synthesis which, contains the 111, 040, 113, 201, 202, 212, 214, and 006 Miller indices corresponding to ε-Fe2O3 (14). The diffractions peaks were observed at the following angles 21.46, 33.58, 35.07, 36.91, 40.38, 41.59, 53.49, and 59.44 in 2θ. The fittings of the diffraction patterns were performed using the Le Bail fitting procedure in the FullProf suite and crystallographic data from the literature (10, 11).
Fig. 1.
A. Powder X-ray diffraction pattern of synthesized Fe3O4. B. Powder X-ray diffraction pattern of synthesized Fe2O3.
The average grain size of each of the nanomaterials was calculated using Scherrer’s equation and the full width half maximum (FWHM) of three independent diffraction peaks. Scherrer’s equation is provided below:
Where d is the nanomaterials diameter, λ is the wavelength of the copper x-ray source (1.54 Å), β is FWHM of the peak, and 2θ/2 is the diffraction angle. Using the Scherrer’s method the average grain size of the synthesized Fe3O4 nanomaterial was 19.9 nm ± 0.2 nm, whereas the synthesized Fe2O3 material had an average grain size of 12.9 nm ± 1.4 nm. Luther et al., as well as Parsons et al., have observed similar results for iron oxide nanomaterials synthesized using this precipitation technique (15–17). These authors have shown nanomaterials synthesized through the precipitation technique have average grain sizes of 17.0 nm (Fe3O4), 12 nm (Fe2O3), 28 nm (Fe3O4),, and 19 nm (Fe3O4).
3.2. pH binding studies
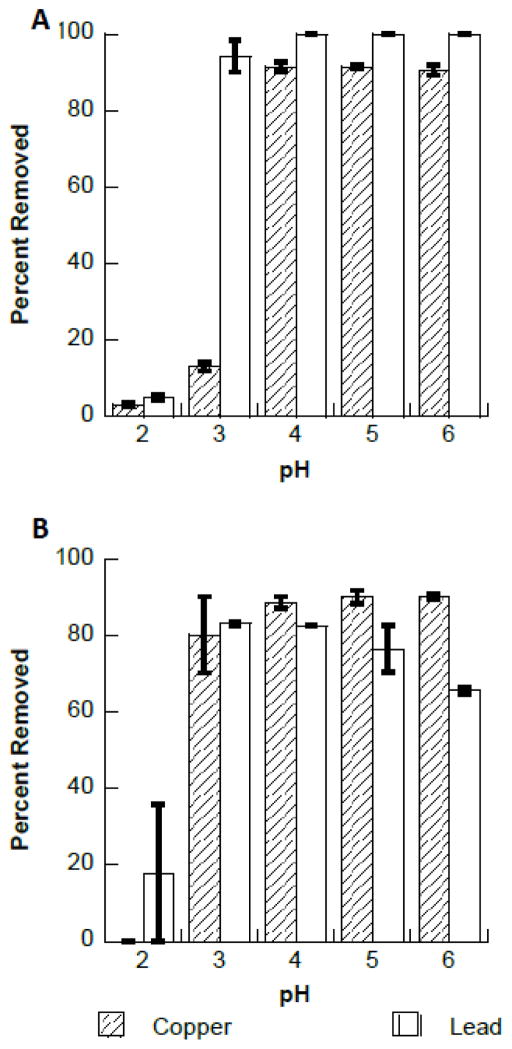
The effects of pH on the binding of copper and lead to Fe3O4 and Fe2O3 are shown in Figure 2. Figure 2A shows the binding of copper and lead to Fe3O4 nanomaterial. As can be seen in Figure 2A at pH values below 3, both Cu2+ and Pb2+ binding to the Fe3O4 nanomaterial is very low, less than 15% and 5%, respectively. However, at pH 3 and above the binding increased to greater than 90% for Pb2+. Cu2+ binding to the nanomaterials was observed to increase with increasing pH. However, the maximum binding for the Cu2+ was achieved at pH 4 and above. Figure 2B shows the binding of Cu2+ and Pb2+ to Fe2O3 from pH 2 through pH 6. Cu2+ showed little to no binding at pH 2 and an increase to approximately 80% binding at pH 3 and above. Similarly, observed Pb2+ binding to Fe2O3 was low at pH 2, below 20%, which increased to 80% at pH 3 and remained relatively constant through pH 5. However, the Pb2+ binding was observed to decreased slightly to approximately 65% at pH 6. The reduction in binding may have been due to Pb(OH)X species formation, which have been observed to start forming at pH 5 and above (18). The formation of the hydroxide species observed for Pb2+ in solution may inhibit to adsorption of the Pb2+ ions to the surface of the nanomaterials. Similar studies have observed comparable results for the removal of lead (10, 19). However, Mahdavi et al, studying the removal of heavy metal ions using Fe3O4, ZnO and CuO obtained less than 20% removal of copper up to pH 6, with a drastic increase to nearly 100% at pH 7. Katsumata et al. found effective removal of both copper and lead (over 90%) with Fe3O4 (20). Yu et al. observed optimal binding of copper and lead at pH 4 using sawdust as the adsorbent (21). Machida et al showed the adsorption of Pb2+ from aqueous solution using carbon based materials occurred optimally at pH 5.5 (18). The selection of pH 5.5 as the optimal binding pH was due to the speciation of the Pb2+ ions in solution. At pH 5.5 and below the majority of lead ions in solution are present as the single hydrated lead ions (Pb2+) (18). Above pH 5.5 hydrated Pb species have been found to exist in solution, which may change the binding properties of the ions (18).
Fig. 2.
A. pH profile for the binding of copper and lead to Fe3O4, pH 2 to pH 6. B. pH profile for the binding of copper and lead to Fe2O3, pH 2 to pH 6.
3.3. Time Dependency Studies
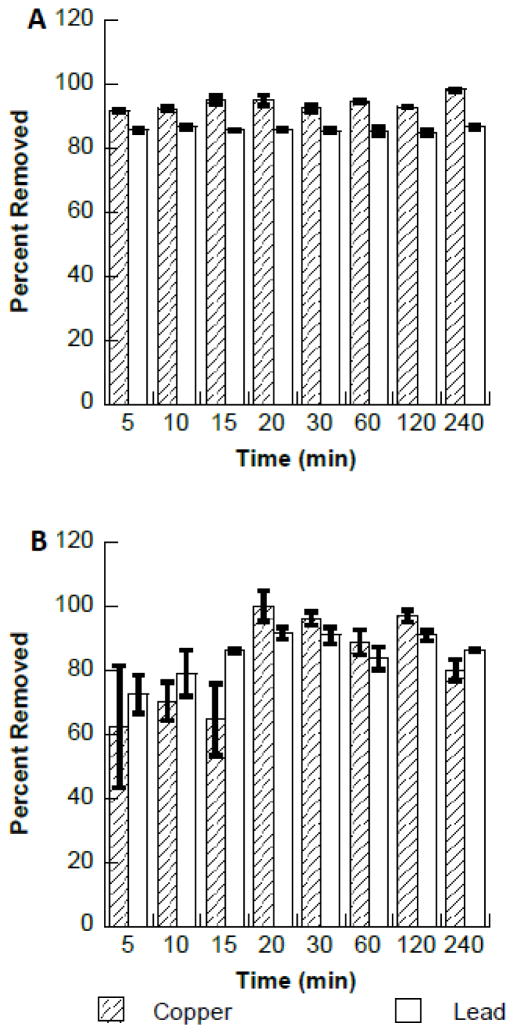
The results from time dependency studies are shown in Fig. 3. Fig. 3A shows the binding of Cu2+ and Pb2+ to the Fe3O4 nanomaterials, as can be seen in Fig. 3A the binding was independent of time. The Cu2+ solution concentration was reduced by approximately 90% within the first 5 minutes of contact and remained constant up to 120 minutes of contact time. However, a slight increase (approximately 10%) in the Cu2+ binding was observed at the 240 minutes time interval. Similarly the Pb2+ binding remained relatively constant at approximately 85% from the initial 5 minute contact time to 240 minute contact time. Fig. 3B shows the binding of both Cu2+ and Pb2+ to the Fe2O3 nanomaterials. As can be seen in Figure 3B the Cu2+ binding remained below 70% for the first 15 min of contact time with Fe2O3 and maximum binding was observed at 20 min, with little to no change up to the 240 minute contact time. Similarly, Pb2+ ions showed a small increase in binding percentage binding at the 20 minute contact time. Initially the Pb2+ removal was observed to be approximately 70% at 5 min and was observed to increase to approximately 90% at 20 min and remaining constant through to the 240 min of contact time. The results obtained in this study are significantly higher than previously conducted studies using Fe3O4. Mahdavi et al., found between 40%–50% lead removal through 100 min of contact time, this value increase to 60% lead removal at 120 min (10). Similarly, copper removal remained approximately 40% through 120 min of contact time. A second study, achieved 35% after 2 h of contact with Fe3O4, with only a slight increase to 40% after 5 h of contact (8). The observed differences in the percentage binding may be due to many different factors, primarily the concentrations at which the reactions were performed. In the present study 0.3 ppm of either Cu2+ or Pb2+ was used for primary investigations. However, many of the comparable studies with respect to pH are in the ppm concentration ranges (18, 22–24). The observed increase in the binding of metal ions from solution with increasing time has been observed in the literature. Ions such as gold(III) show this phenomenon and it is generally related to the reduction of the gold(III) ion to gold(0). The reduction of gold ions in solution using many different biomasses has been highlighted in the literature (25,26). The reduction of silver(I) ions in solution binding to biomass has also been shown using Basil and Cinnamon zeylanicum bark(27,28). In addition, it has also been shown in the literature that magnetite (Fe3O4) has the capability to reduce copper(II) ions as well as Vanadium(V), and chromate ions (29). The observed increases in the adsorption of both the Cu2+ and Pb2+ ions at the 20 minute contact time may be due to a change at the surface after complexation of the ions. Alternatively, on the surface of the Fe2O3 residual protons may be blocking the binding of the metal ions, once the protons are removed then the binding of the Cu2+ and Pb2+ may occur.
Fig. 3.
A. Effects of contact time on the binding of copper and lead to Fe3O4. B. Effects of contact time on the binding of copper and lead to Fe2O3.
3.4. Isotherm binding studies
The binding capacities for both the Fe3O4 and Fe2O3 with Cu2+ and Pb2+ are shown in Table 1. The capacities in Table 1, for both the Cu2+ and Pb2+ ions are for 1 h of contact with each of the respective nanomaterials at the optimum binding pH. The binding of both Cu2+ and Pb2+ to the Fe3O4 and Fe2O3 nanomaterials was found to follow the Langmuir Isotherm model. The isotherm data were plotted were fitted using the Langmuir Isotherm equation in linear form, which resulted in linear plots with R2 values of 0.99 or better. The linear form of the Langmuir equation is shown below:
Table 1.
Binding capacities for copper and lead to Fe3O4 and Fe2O3 after 1 h of contact time at room temperature.
| Fe3O4 | Fe2O3 | |||
|---|---|---|---|---|
| Copper | 37.04 mg/g | 0.59 mmol/g | 19.61 mg/g | 0.31 mmol/g |
| Lead | 166.67 mg/g | 0.80 mmol/g | 47.62 mg/g | 0.23 mmol/g |
Where qe is the equilibrium concentration of the metal (copper or lead), Qo is the binding capacity of the nanomaterial (Fe3O4 or Fe2O3), b is a constant, and Ce is the initial metal concentration. By plotting 1/qe vs 1/Ce and employing the linearized Langmuir equation the intercept of the line can be used to calculate the binding capacity of the adsorbent. The Langmuir adsorption model for lead removal using Fe3O4 was also observed in a study conducted by (5). Studies conducted using amino functionalized Fe3O4 (30), biomass coated Fe3O4 (31) and γ-AlOOH @ SiO2/Fe3O4 (32) similarly, observed Langmuir adsorption for both copper and lead. In the present study the binding of copper and lead to both the Fe3O4 and Fe2O3 was found to be fitted best using the Langmuir adsorption model. The Langmuir adsorption model suggests single layer of metal ions adsorbing to the surface of the nanomaterial.
Table 1 shows that both copper and lead have high binding capacity for both of the adsorbents tested. Lead was determined to have a binding capacity of 166.67 mg/g for Fe3O4 and 45.45 mg/g for Fe2O3. These results are significantly higher than Fe3O4 binding capacities reported by others (8,19). Additional studies obtained Fe3O4 capacities only slightly lower, 101.4 mg/g and 111.1 mg/g, than the capacities obtained in the present study (10, 33). The results obtained for lead in this study were also compared binding capacities for lead binding to similar other metal oxides. Recillas et al., found high uptake of lead with TiO2 was 159 mg/g and CeO2 bound 189 mg/g, Mahdavi et al., achieved 119.1 mg/g lead binding with ZnO nanoparticles, but only 14.2 mg/g binding with CuO nanoparticles (8,10). Further comparing the Fe3O4 nanoparticles synthesized in the present study showed higher binding capacities than those observed in biosorbents such as sawdust, neem bark, and macrophyte biosorbent materials (33, 35). Studies that utilized Fe3O4 functionalized with various materials showed mixed results with binding capacities ranging from 64.50 mg/g to 598.8 mg/g (5, 33, 36). Using an Iron based material, Castaldi et al. showed that iron based water treatment residuals had adsorption capacities of 0.194 and 0.106 mmol/g or 40.20 and 6.73 mg/g for Pb2+ and Cu2+ ions at pH 4.5 (37). In the same manuscript Castaldi et al. showed that an Al based water treatment residual has capacities of 0.073 mmol/g and 0.065 mmol/g, or 15.2 and 4.13 mg/g, for Pb2+ and Cu2+, respectively (37).
Binding capacities of 37.04 mg/g and 19.31 mg/g were observed for copper to Fe3O4 and Fe2O3, respectively. Recent studies in the literature have shown variable results, ranging from very low capacities of 6 mg/g to high capacities of 52 mg/g(10, 38–40). Higher copper removal has been reported with the use of ZnO and CuO as well as Fe3O4 functionalized with polymers and polymeric beads (10,31, 38–40). However, these binding capacities are not specifically for the nanomaterial under investigation, but a combination of the nanomaterial and the ligand used to functionalize the nanomaterial. The use of macrophyte biomaterial obtained varying removal capacities ranging from 19.7 mg/g to 40.8 mg/g, with the removal dependent on the species of macrophyte used in the study. The variation of binding capacities observed for copper and lead to various materials suggest that binding capacity is highly dependent on particle size and experimental conditions.
3.5. Effects of coexisting cations
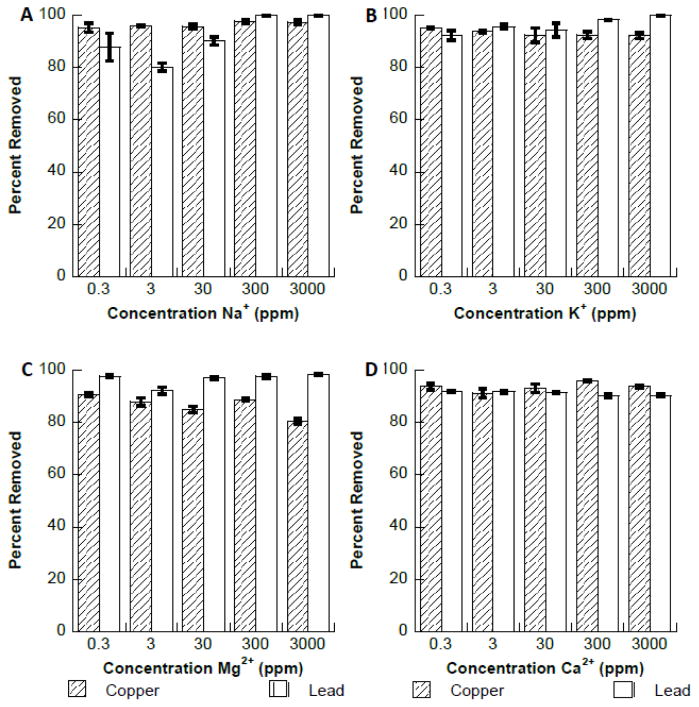
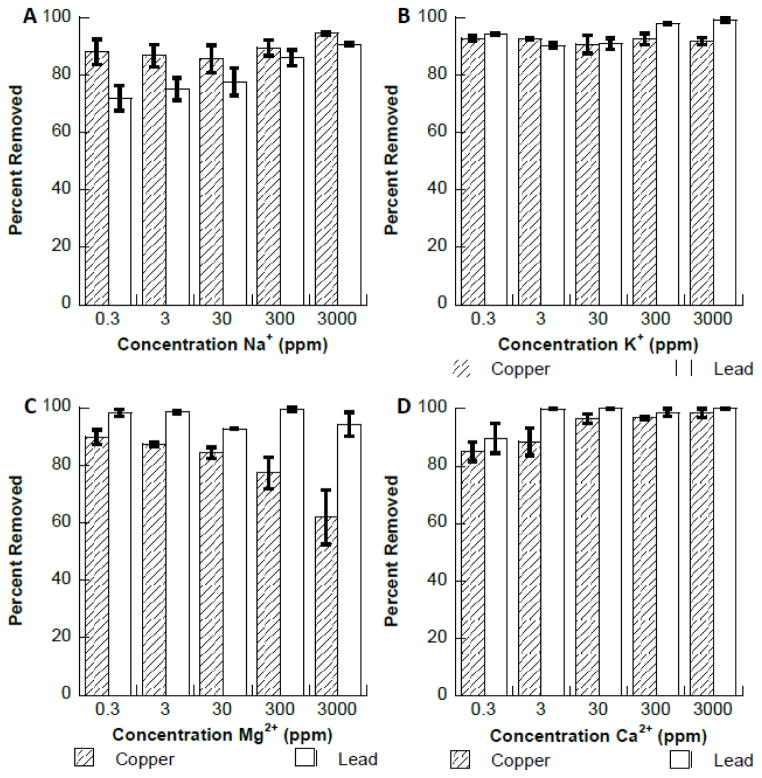
The effect of naturally occurring interfering cations ions Na+, K+, Ca2+, or Mg2+ on the binding of copper and lead to Fe3O4 are shown in Fig. 5. As can be seen in Fig 5A–D the presence of these metal ions had no significant effect on the binding of either copper or lead to the Fe3O4 nanomaterial. However, a small decrease in copper binding was observed in the presence of Mg2+ at 3000 ppm. A study conducted by Dong et al., found that no interference occurred with the binding of lead to hydroxyapatite coated Fe3O4 in the presence of the same ions (33). A second study showed that Ca2+ ions had no observable effect on the binding of lead to Fe3O4 at a Ca2+ concentration of 100 ppm (19). It was also observed in the study by Nassar et al. that the addition of Co2+, Ni+, and Cd2+ ions at 100 ppm had no significant effect on the binding of lead to Fe3O4. Fig. 6 shows the effects of the same metal ions on the binding of copper and lead to synthesized Fe2O3 nanomaterial. Fig. 6A and 6B also show that both Na+ and K+ ions had no significant effect on the binding of copper to the Fe2O3 nanomateiral. However, the Pb2+ binding to Fe2O3 was observed to decrease to approximately 70% in the presence of Na+ at 0.3 ppm. The binding of the Pb2+ ions increased continually after the initial decrease with increasing Na+ concentration, reaching 95% removed at a Na+ concentration of 3000 ppm. This initial binding decrease in the presence of low concentrations of interfering ions has been observed by other authors. The binding of Cu2+ (Fig. 6C) was found to decrease at high concentrations of Mg2+ ions, whereas lead binding is unaffected up to 3000 ppm. Copper binding decreased to 85% removal at 0.3 ppm Ca2+ and 88.5% removal at 3 ppm Ca2+. After this initial decrease, binding increased to greater than 95% removal at concentrations 30 ppm and above. Lead binding decreased to 90% at 0.3 ppm Ca2+, then increased to complete removal at concentrations of 3 ppm and above.
Fig. 5.
A. Interference study of copper and lead binding to Fe3O4 in the presence of increasing concentrations of Na+ ions. B. Interference study of copper and lead binding to Fe3O4 in the presence of increasing concentrations of K+ ions. C. Interference study of copper and lead binding to Fe3O4 in the presence of increasing concentrations of Mg2+ ions. D. Interference study of copper and lead binding to Fe3O4 in the presence of increasing concentrations of Ca2+ ions.
Fig. 6.
A. Interference study of copper and lead binding to Fe2O3 in the presence of increasing concentrations of Na+ ions. B. Interference study of copper and lead binding to Fe2O3 in the presence of increasing concentrations of K+ ions. C. Interference study of copper and lead binding to Fe2O3 in the presence of increasing concentrations of Mg2+ ions. D. Interference study of copper and lead binding to Fe2O3 in the presence of increasing concentrations of Ca2+ ions.
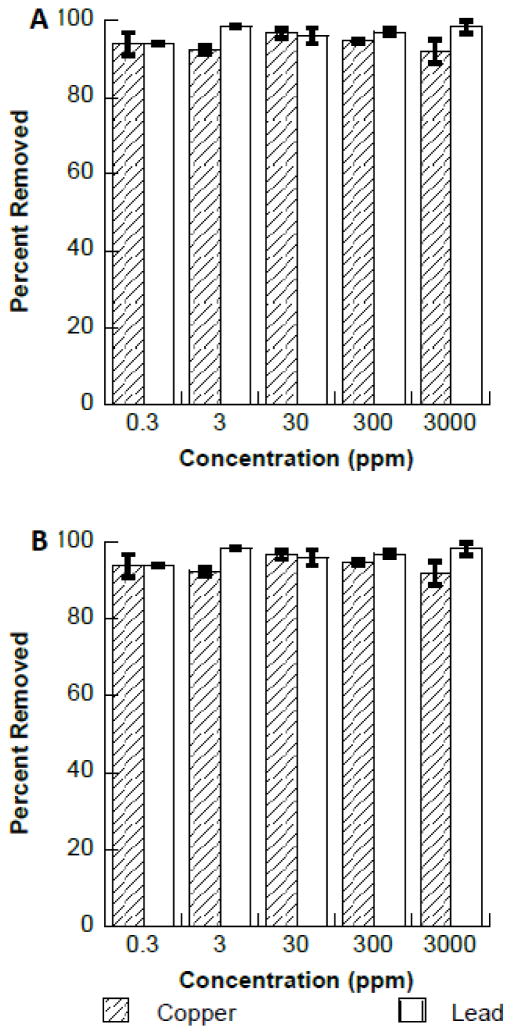
The effects of multiple coexisting alkali and alkali earth (Na+, K+, Ca2+, and Mg2+) are presented in Fig. 7. Fig. 7A shows that the presence of all of the coexisting ions has little to no effect on the binding of copper or lead to Fe3O4. Fig. 7B shows similarly that the presence of these ions do not affect the binding of copper or lead to Fe2O3. The effects of Na+, K+, Ca2+, or Mg2+ ions on the removal of lead were similarly observed using biosorbents (41). Deng et al., found that the presences of these ion individually had little effect on the removal of lead using Cladophora fascicularis green algae (41). Similar results were obtained for binding copper using the using Cladophora fascicularis algae biosorbent (42). There appears to be an antagonistic effect between some of the cations in solution and Pb2+ or Cu2+ especially at the low concentrations of both ions. However, the data indicates that the Cu2+ and Pb2+ ions are preferentially bound from aqueous solution, due to the high binding of Cu2+ and Pb2+ from solution in the presence of extremely high concentrations of the interfering cations. The combined interference study the molar ratio of the ions to the Cu2+ was 86147:1 and the Pb2+ was 282184:1. Even in these extremely high amounts of cations present in solution the Cu2+ and Pb2+ binding was still above 90%, which indicates a strong affinity of both the Cu2+ and Pb2+ ions to the nanomaterials.
Fig. 7.
A. Interference study of copper and lead binding to Fe3O4 in the presence of increasing concentrations of Na+, K+, Mg2+, and Ca2+. B. Interference study of copper and lead binding to Fe2O3 in the presence of increasing concentrations of Na+, K+, Mg2+, and Ca2+.
4. Conclusion
Optimal binding conditions for copper and lead to two synthesized nanomaterials, Fe3O4 and Fe2O3, were explored. Binding was found to be pH dependent, with pH 4 chosen as the optimal binding pH. Copper and lead binding was also found to be time independent, with high removal occurring within the first 5 min of contact with the Fe3O4 nanomaterial and within the first 20 min of contact with Fe2O3 nanomaterial. Nanomaterial binding was tested in the presence of competing alkali metals and alkaline earth metals for any possible interference. The presence of Na+, K+, Mg2+, and Ca2+ ions showed no significant effect on the binding of either Cu2+ or Pb2+ to either Fe3O4 or Fe2O3. The data indicates that nano-sized iron oxides can provide high removal of copper and lead without the need of additional modifications to the surface with organic ligands or chelating agents.
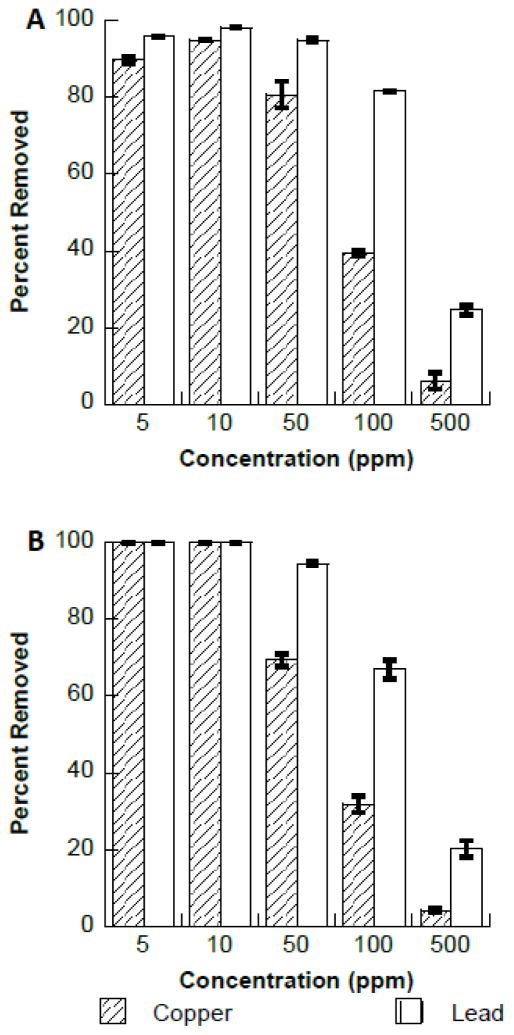
Fig. 4.
A. Binding affinity of copper or lead to Fe3O4 in the presence of increasing concentrations of copper and lead. B. Binding affinity of copper or lead to Fe2O3 in the presence of increasing concentrations of copper and lead.
Highlights.
Non-stabilized iron oxide nanoparticles were synthesized from 12–20 nm in size
Effects of pH, time, and interfering ions were investigated for low level Cu2+ and Pb2+ removal
Pb2+ had higher binding capacity to the Fe3O4 nanomaterial
Cu2+ had higher binding capacity and Fe2O3 nanomaterial
Both Cu2+ and Pb2+ binding followed the Langmuir isotherm model.
Acknowledgments
Authors would like to thank the NIH UTPA RISE program (Grant Number 1R25GM100866-01) and the HHMI (grant number 52007568). The Authors acknowledge financial support from the Welch Foundation for supporting the Department of Chemistry (Grant number GB-0017) and UTPA for sponsoring this research project.
Footnotes
Publisher's Disclaimer: This is a PDF file of an unedited manuscript that has been accepted for publication. As a service to our customers we are providing this early version of the manuscript. The manuscript will undergo copyediting, typesetting, and review of the resulting proof before it is published in its final citable form. Please note that during the production process errors may be discovered which could affect the content, and all legal disclaimers that apply to the journal pertain.
References
- 1.Daniell WE, Stockbridge HL, Labbe RF, Woods JS, Anderson KE, Bissell DM, Bloomer JR, Ellefson RD, Moore MR, Pierach CA, Schreiber WE, Tefferi A, Franklin GM. Environmental chemical exposures and disturbances of heme synthesis. Environ Health Perspect. 1997;105:37–53. doi: 10.1289/ehp.97105s137. [DOI] [PMC free article] [PubMed] [Google Scholar]
- 2.Fertmann R, Hentschel S, Dengler D, Janßen U, Lommel A. Lead exposure by drinking water: an epidemiologial study in Hamburg, Germany. Int J Hyg Environ Health. 2004;207:235–244. doi: 10.1078/1438-4639-00285. [DOI] [PubMed] [Google Scholar]
- 3.Araya M, Olivares M, Pizarro F, Llanos A, Figueroa G, Uauy R. Community-based randomized double-blind study of gastrointestinal effects and copper exposure in drinking water. Environ Health Perspect. 2004;112:1068. doi: 10.1289/ehp.6913. [DOI] [PMC free article] [PubMed] [Google Scholar]
- 4.Rampley CG, Ogden KL. Preliminary studies for removal of lead from surrogate and real soils using a water soluble chelator: Adsorption and batch extraction. Environ Sci Technol. 1998;32:987–993. [Google Scholar]
- 5.Badruddoza AZ, Shawon ZB, Tay WJ, Hidajat K, Uddin MS. Fe3O4/cyclodextrin polymer nanocomposites for selective heavy metals removal from industrial wastewater. Carbohydr Polym. 2012;91:322–332. doi: 10.1016/j.carbpol.2012.08.030. [DOI] [PubMed] [Google Scholar]
- 6.Walters RW, Tarleton AL, Grasso D, Al-Ghusain I, Chin YP, West BW, Schoppet MJ. Wastewater Treatment-Physical and Chemical Methods. J Water Pollut Control Fed. 1989;61:789–799. [Google Scholar]
- 7.Ahalya N, Ramachandra TV, Kanamadi RDR. Biosorption of heavy metals. Res J Chem Environ. 2003;7(4):71–79. [Google Scholar]
- 8.Recillas S, García A, González E, Casals E, Puntes V, Sánchez A, Font X. Use of CeO2, TiO2 and Fe3O4 nanoparticles for the removal of lead from water: Toxicity of nanoparticles and derived compounds. Desalination. 2011;277:213–220. [Google Scholar]
- 9.Yin J, Jiang Z, Chang G, Hu B. Simultaneous on-line preconcentration and determination of trace metals in environmental samples by flow injection combined with inductively coupled plasma mass spectrometry using a nanometer-sized alumina packed micro-column. Anal Chim Acta. 2005;540:333–339. [Google Scholar]
- 10.Mahdavi S, Jalali M, Afkhami A. Removal of heavy metals from aqueous solutions using Fe3O4, ZnO, and CuO nanoparticles. J Nanopart Res. 2012;14:1–18. [Google Scholar]
- 11.Rodriguez-Carvajal J. Recent advances in magnetic structure determination by neutron powder diffraction. Physica B. 1993;192:55–69. [Google Scholar]
- 12.Le Bail A, Duroy H, Fourquet JL. Ab-initio structure determination of LiSbWO6 by X-ray powder diffraction. Mat Res Bull. 1988;23:447–452. [Google Scholar]
- 13.Fleet ME. The Structure of Magnetite. Acta Crystallogr, Sect B: Struct Sci. 1981;37:917–920. [Google Scholar]
- 14.Kelm K, Mader WZ. Synthesis and Structural Analysis of ε-Fe2O3. Anorg Allg Chem. 2005;631:2383–2389. [Google Scholar]
- 15.Luther S, Borgfeld N, Kim J, Parsons JG. Removal of arsenic from aqueous solution: A study of the effects of pH and interfering ions using iron oxide nanomaterials. Microchem J. 2012;101:30–36. [Google Scholar]
- 16.Garcia S, Sardar S, Maldonado S, Garcia V, Tamez C, Parsons JG. Study of As(III) and As(V) Oxoanion Adsorption onto Single and Mixed Ferrite and Hausmannite Nanomaterials. Microchem J. 2014;117:52–60. doi: 10.1016/j.microc.2014.06.008. [DOI] [PMC free article] [PubMed] [Google Scholar]
- 17.Parsons JG, Lopez ML, Peralta-Videa JR, Gardea-Torresdey JL. Determination of arsenic(III) and arsenic(V) binding to microwave assisted hydrothermal synthetically prepared Fe3O4, Mn3O4, and MnFe2O4 nanoadsorbents. Microchem J. 2009;91:100–106. [Google Scholar]
- 18.Machida M, Yamazaki R, Aikawa M, Tatsumoto H. Role of minerals in carbonaceous adsorbents for removal of Pb(II) ions from aqueous solution. Sep Purif Technol. 2005;46:88–94. [Google Scholar]
- 19.Nassar NN. Rapid removal and recovery of Pb (II) from wastewater by magnetic nanoadsorbents. J Hazard Mater. 2010;184:538–546. doi: 10.1016/j.jhazmat.2010.08.069. [DOI] [PubMed] [Google Scholar]
- 20.Katsumata H, Kaneco S, Inomata K, Itoh K, Funasaka K, Masuyama K, Ohta K. Removal of heavy metals in rinsing wastewater from plating factory by adsorption with economical viable materials. J Environ Manage. 2003;69:187–191. doi: 10.1016/s0301-4797(03)00145-2. [DOI] [PubMed] [Google Scholar]
- 21.Yu B, Zhang Y, Shukla A, Shukla SS, Dorris KL. The removal of heavy metals from aqueous solutions by sawdust adsorption—removal of lead and comparison of its adsorption with copper. J Hazard Mater. 2001;84:83–94. doi: 10.1016/s0304-3894(01)00198-4. [DOI] [PubMed] [Google Scholar]
- 22.Prasad M, Xu HY, Saxena S. Multi-component sorption of Pb(II), Cu(II) and Zn(II) onto low-cost mineral adsorbent. J Hazard Mater. 2008;154:221–229. doi: 10.1016/j.jhazmat.2007.10.019. [DOI] [PubMed] [Google Scholar]
- 23.Han R, Zou W, Li H, Li Y, Shi J. Copper(II) and lead(II) removal from aqueous solution in fixed-bed columns by manganese oxide coated zeolite. J Hazard Mater. 2006;137:934–942. doi: 10.1016/j.jhazmat.2006.03.016. [DOI] [PubMed] [Google Scholar]
- 24.Mahmoud ME, Osman MM, Hafez OF, Hegazi AH, Elmelegy E. Removal and preconcentration of lead (II) and other heavy metals from water by alumina adsorbents developed by surface-adsorbed-dithizone. Desalination. 2010;251:123–130. [Google Scholar]
- 25.Gardea-Torresdey JL, Tiemann KJ, Gamez G, Dokken K, Cano-Aguilera I, Furenlid LR, Renner MW. Reduction and accumulation of gold (III) by Medicago sativa alfalfa biomass: X-ray absorption spectroscopy, pH, and temperature dependence. Environ Sci Technol. 2000;34:4392–4396. doi: 10.1021/es991325m. [DOI] [PMC free article] [PubMed] [Google Scholar]
- 26.Armendariz V, Herrera I, Peralta-Videa JR, J-Yacaman M, Troiani H, Santiago P, Gardea-Torresdey JL. Size controlled gold nanoparticle formation by Avena sativa biomass: use of plants in nanobiotechnology. J Nanopart Res. 2004;6:377–382. [Google Scholar]
- 27.Ahmad N, Sharma S, Alam MdK, Singh VN, Shamsi SF, Mehta BR, Fatma A. Rapid synthesis of silver nanoparticles using dried medicinal plant of basil. Colloids Surf, B. 2010;81:81–86. doi: 10.1016/j.colsurfb.2010.06.029. [DOI] [PubMed] [Google Scholar]
- 28.Sathishkumar M, Sneha K, Won SW, Cho CW, Kim S, Yun YS. Cinnamon zeylanicum bark extract and powder mediated green synthesis of nano-crystalline silver particles and its bactericidal activity. Colloids Surf, B. 2009;73:332–338. doi: 10.1016/j.colsurfb.2009.06.005. [DOI] [PubMed] [Google Scholar]
- 29.Wiatrowski HA, Das S, Kadapu R, Ilton ES, Barkay T, Yee N. Reduction of Hg(II) to Hg(0) by Magnetite. Environ Sci Technol. 2009;43:5307–5313. doi: 10.1021/es9003608. [DOI] [PubMed] [Google Scholar]
- 30.Hao YM, Man C, Hu ZB. Effective removal of Cu (II) ions from aqueous solution by amino-functionalized magnetic nanoparticles. J Hazard Mater. 2010;184:392–399. doi: 10.1016/j.jhazmat.2010.08.048. [DOI] [PubMed] [Google Scholar]
- 31.Peng Q, Liu Y, Zeng G, Xu W, Yang C, Zhang J. Biosorption of copper (II) by immobilizing Saccharomyces cerevisiae on the surface of chitosan-coated magnetic nanoparticles from aqueous solution. J Hazard Mater. 2010;177:676–682. doi: 10.1016/j.jhazmat.2009.12.084. [DOI] [PubMed] [Google Scholar]
- 32.Zhang F, Lan J, Zhao Z, Yang Y, Tan R, Song W. Removal of heavy metal ions from aqueous solution using Fe3O4-SiO2-poly (1, 2-diaminobenzene) core-shell sub-micron particles. J Colloid Interface Sci. 2012;386:277–284. doi: 10.1016/j.jcis.2012.07.066. [DOI] [PubMed] [Google Scholar]
- 33.Dong L, Zhu Z, Qiu Y, Zhao J. Removal of lead from aqueous solution by hydroxyapatite/magnetite composite adsorbent. J Chem Eng J. 2010;165:827–834. [Google Scholar]
- 34.Naiya TK, Bhattacharya AK, Das SK. Adsorption of Pb (II) by sawdust and neem bark from aqueous solutions. Environ Prog. 2008;27:313–328. [Google Scholar]
- 35.Schneider IAH, Rubio J. Sorption of heavy metal ions by the nonliving biomass of freshwater macrophytes. Environ Sci Technol. 1999;33:2213–2217. [Google Scholar]
- 36.Senel S, Uzun L, Kara A, Denizli A. Heavy metal removal from synthetic solutions with magnetic beads under magnetic field. J Macromol Sci Part A: Pure Appl Chem. 2008;45:635–642. [Google Scholar]
- 37.Castaldi P, Silvetti M, Garau G, Demurtas D, Deiana S. Copper(II) and lead(II) removal from aqueous solution by water treatment residues. J Hazard Mater. 2015;283:140–147. doi: 10.1016/j.jhazmat.2014.09.019. [DOI] [PubMed] [Google Scholar]
- 38.Zhang YX, Yu XY, Jin Z, Jia Y, Xu HW, Luo T, Huang JX. Ultra high adsorption capacity of fried egg jellyfish-like γ-AlOOH (Boehmite)@ SiO2/Fe3O4 porous magnetic microspheres for aqueous Pb (II) removal. J Mater Chem. 2011;21:16550–16557. [Google Scholar]
- 39.Ge F, Li MM, Ye H, Zhao BX. Effective removal of heavy metal ions Cd2+, Zn2+, Pb2+, Cu2+ from aqueous solution by polymer-modified magnetic nanoparticles. J Hazard Mater. 2012;211:366–372. doi: 10.1016/j.jhazmat.2011.12.013. [DOI] [PubMed] [Google Scholar]
- 40.Banerjee SS, Chen DH. Fast removal of copper ions by gum arabic modified magnetic nano-adsorbent. J Hazard Mater. 2007;147:792–799. doi: 10.1016/j.jhazmat.2007.01.079. [DOI] [PubMed] [Google Scholar]
- 41.Deng L, Su Y, Su H, Wang X, Zhu X. Sorption and desorption of lead (II) from wastewater by green algae Cladophora fascicularis. J Hazard Mater. 2007;142:220–225. doi: 10.1016/j.jhazmat.2006.09.009. [DOI] [PubMed] [Google Scholar]
- 42.Deng L, Su Y, Su H, Wang X, Zhu X. Biosorption of copper (II) and lead (II) from aqueous solutions by nonliving green algae Cladophora fascicularis: equilibrium, kinetics and environmental effects. Adsorpt. 2006;12:267–277. [Google Scholar]


