

Abstract
We developed a high-throughput screening assay that allows for relative comparison of the twitch force of millimeter-scale gel-based cardiac tissues. This assay is based on principles taken from traction force microscopy and uses fluorescent microspheres embedded in a soft polydimethylsiloxane (PDMS) substrate. A gel-forming cell suspension is simply pipetted onto the PDMS to form hemispherical cardiac tissue samples. Recordings of the fluorescent bead movement during tissue pacing are used to determine the maximum distance that the tissue can displace the elastic PDMS substrate. In this study, fibrin gel hemispheres containing human induced pluripotent stem cell-derived cardiomyocytes were formed on the PDMS and allowed to culture for 9 days. Bead displacement values were measured and compared to direct force measurements to validate the utility of the system. The amplitude of bead displacement correlated with direct force measurements, and the twitch force generated by the tissues was the same in 2 and 4 mg/mL fibrin gels, even though the 2 mg/mL samples visually appear more contractile if the assessment were made on free-floating samples. These results demonstrate the usefulness of this assay as a screening tool that allows for rapid sample preparation, data collection, and analysis in a simple and cost-effective platform.
Introduction
Engineered cardiac tissues (ECTs) can be a useful tool when investigating novel drug treatments and, potentially, for the replacement or augmentation of damaged tissue in vivo. With the discovery of human induced pluripotent stem cells1 (hiPSCs) and the development of fast and efficient differentiation protocols to generate cardiomyocytes,2 researchers have the ability to use both healthy and pathological cardiomyocytes3–5 to generate engineered tissues. However, many factors, such as cellular density, gel scaffold composition, growth medium, medium supplements, and experimental drugs, need to be assessed experimentally for their effect on cell and tissue function to generate physiologically relevant in vitro tissue models.
Cell traction and contraction are fundamental cell behaviors that require quantification during design, development, and characterization of many engineered tissues. The cell types predominantly responsible for these forces are interstitial cells, most notably fibroblasts, and muscle cells, such as cardiomyocytes and skeletal myoblasts. Interstitial cell types entrapped in a fibrillar network, such as collagen or fibrin, exert cell traction forces that are responsible for compaction of the bulk gel, which can result in desired matrix fiber and cell alignment.6,7 Similarly, cardiomyocytes and skeletal myoblasts generate considerable contractile forces as their primary function, which can be visualized with a microscope in small tissues or unaided in larger tissues. It is desirable for engineered muscle tissues to be able to reproduce these forces. As a result, many systems have been developed to measure traction forces or contraction forces of single cells or three-dimensional tissues.
Single-cell-level assays, such as traction force microscopy8 or microfabricated posts,9,10 have been used to determine forces exerted by single cells, including cellular responses because of soluble factors11 and substrate stiffness.12–14 However, these assays do not capture the complex three-dimensional environment that cells experience in vivo or in an engineered tissue construct. Not only do extracellular matrix (ECM) properties regulate cellular function,15 cell–cell interactions are important determinants of tissue properties as well. For example, both skeletal myoblasts and cardiomyocytes in mature muscle exist in a syncytium that aids in the rapid conduction of electrical signals necessary for coordinated contraction. Most tissues also have characteristic alignment that may not be captured by assays of single cells on a two-dimensional substratum.
Tissue-level assays have also been developed and include free-floating tissue samples, as well as anchored tissues of both macro- and microscales that have proven useful for investigating the role of alignment,16 matrix stiffness,17 and matrix composition.18 However, free-floating assays do not measure cell forces directly, instead rely on theory to relate the tissue compaction to cell forces.19,20 In addition, while macrosized tissues16 are easy to prepare and conducive to force measurement without a highly specialized equipment, they are low throughput, and screening many factors quickly becomes cumbersome and taxing on resources. Conversely, microsized tissues enable high-throughput screening but generally require microfabrication17,21 or the use of specialized equipment.22
Herein, we propose and validate a new approach, which we term tissue contraction force microscopy, inspired by cell traction force microscopy that combines simplicity of sample preparation and the use of common laboratory equipment. Rather than measure fluorescent microsphere displacements because of forces exerted by single cells on a polydimethylsiloxane (PDMS) or polyacrylamide membrane, we measure microsphere displacements because of forces collectively exerted by cells in 50 μL tissues formed by simply pipetting the gel-forming cell suspension directly onto the surface of a PDMS membrane, resulting in hemisphere-shaped tissue constructs.
Since fibrin gel is a common choice for ECTs,16,23,24 to demonstrate the utility of this approach, we compared microsphere displacements generated by ECTs fabricated from hiPSC-derived cardiomyocytes (hiPSC-CMs) in fibrin gels at two different fibrin concentrations as well as two different cell concentrations and then directly measured the forces in the same samples as a validation of the assay. These ECTs were also characterized histologically to provide insight as to how gel compaction might affect the measured bead displacements.
Materials and Methods
Culture dish preparation and characterization
To form the PDMS substrate, 1 mL (4.55 × 10¹⁰ particles/mL) of 1-μm-diameter yellow–green fluorescent microspheres (Polysciences, Inc.) were desiccated overnight under vacuum. Drying is necessary because the microspheres are suspended in water, which does not mix well with the hydrophobic PDMS and results in an unusable substrate. Once dried, the beads were dissociated into a fine powder using a mortar and pestle and mixed with 40 g of Sylgard 527 PDMS (Ellsworth Adhesives) at a 1:1 mixing ratio (part A:part B).
The PDMS components and microspheres were mixed by hand for 5 min before being centrifuged at 1000 g for 10 min to remove clumps. The supernatant, containing primarily singularized microspheres, was decanted into a plastic cup, and the PDMS–microsphere mixture was poured into 35-mm Petri dishes (BD Falcon). To maintain a uniform thickness between dishes, 1 g of the PDMS mixture was added to each dish before being placed into a 90°C oven overnight. Dishes are stored with the lids on to prevent accumulation of dust and debris on the PDMS surface before sterilization. Immediately before use, the cured dishes were sterilized with a UVO Cleaner (Model 342A; Jelight Company, Inc.) for 4 min with the lids off and then transferred to a sterile culture hood.
Uniaxial strain to failure testing was conducted on three substrate samples from three separate batches of PDMS–microsphere mixture. A 2 × 1 cm rectangular sample was removed from the Petri dish using a flat cell scraper (BD Falcon). Thickness of the samples was measured using a digital caliper. Samples were mounted into grips attached to the tester's actuating arms, preloaded to 0.005 N, and then strained to failure at 3 mm/min using an Instron MicroBionix (Instron Systems). Strain was calculated by taking the natural logarithm of the sample's deformed length over the initial length, and stress was defined as the force divided by the undeformed, cross-sectional area of the sample. Young's modulus was taken as the slope of the linear region of the stress–strain curve.
Cell and ECT culture
The hiPSC-CMs were obtained from the laboratory of Dr. Timothy Kamp at the University of Wisconsin–Madison. Cells were differentiated through the small molecule Wnt/GSK3 inhibition (GiWi) protocol2 from hiPS cell line DF19-9-11T. The purity of the differentiated cells was determined by flow cytometry for cardiac troponin-T (cTnT)+ cells at day 15 of differentiation to be 75–95% cTnT+. Cells were frozen in 90% fetal bovine serum (FBS) and 10% dimethyl sulfoxide (DMSO) at 10 × 106 cells/vial and stored in liquid nitrogen before shipping.
The hiPSC-CMs were thawed into 2 μg/cm2 fibronectin-coated (Sigma) T75 flasks and cultured in 15 mL EB-20 medium (Dulbecco's modified Eagle's medium/F12 basal medium [Corning], 0.1 mM 2-mercaptoethanol [Sigma], 0.1 mM nonessential amino acids [HyClone], 1% penicillin/streptomycin [Gibco], and 20% FBS). Medium was replaced 24 h after thaw to remove any residual DMSO and dead cells and changed to 2% FBS medium (EB-2) 48 h after thaw.
Cells were kept in culture until they resumed beating (approximately 4–7 days) before harvesting with 0.25% trypsin/ethylenediaminetetraacetic acid (HyClone) + 2% chicken serum (Sigma). Trypsinized hiPSC-CMs were added to a mixture of Medium 199 basal medium (M199; Life Sciences) and a fibrin-forming solution consisting of varying fibrinogen (Sigma) concentrations and thrombin (Sigma) to catalyze gel formation. Final concentrations of the gels comparing fibrinogen concentrations were either 2 or 4 mg/mL fibrinogen, 1.25 U/mL thrombin, and 4 million hiPSC-CMs/mL. For cell concentration experiments, final concentrations of the gels were 4 mg/mL fibrinogen, 1.25 U/mL thrombin, and either 3 or 5 million hiPSC-CMs/mL.
Immediately after mixing, 50 μL hemisphere gels were cast as droplets directly on the surface of prepared PDMS-coated dishes in a single line through the center of the dish. Gels were incubated for 4 min at room temperature in the sterile culture hood before being moved to 37°C, 5% CO2 incubator for an additional 10 min to complete polymerization, after which 2.5 mL EB-20 medium supplemented with 2 mg/mL ɛ-aminocaproic acid (ACA; Acros Organics) was added to the dishes to completely cover the hemispheres. Medium was changed 24 h after casting and switched to EB-2 + ACA after 48 h. Constructs were cultured for a total of 9 days, with medium changes every other day before analysis of beating.
Microsphere displacement measurements
Displacement of fluorescent microspheres was captured on an Olympus IX81 inverted microscope with heated environmental chamber (Precision Plastics) at 37°C using Metamorph 7.7.8.0 (Molecular Devices, Inc.). Before testing, medium was supplemented with 2 mM CaCl2. During testing (Fig. 1A), the constructs were paced through field stimulation (Grass S88X Stimulator; Astro-Med, Inc.) provided by silver wire electrodes and a square wave function of 24 V peak voltage, 10-ms pulse width, and 0.5 Hz frequency. This stimulation regime was chosen to ensure that all the cells within the ECT were contracting at the same time while allowing for complete relaxation before the next stimulation pulse. Fluorescent image series and a single brightfield image were taken at each of the four locations around the perimeter of each construct. The fluorescent image series was composed of 25 images taken using Metamorph's Stream Acquisition function, covering 3–5 s of real time, or 1–2 complete contraction cycles.
FIG. 1.

Microsphere displacement (A) and validation force testing setups (B). Red arrow indicates post attached to the force transducer; yellow arrows indicate pacing electrodes, and white arrows indicate the ECT. ECT, engineered cardiac tissue. Color images available online at www.liebertpub.com/tec
While the movement of the microbeads directly under the tissue could be measured, doing so would likely lead to an increased variability and a reduction in the observed displacements. Because the ECT is disk shaped and contracting radially inward, the microbeads at the tissue edge will have the greatest movement directed inward toward the center of the ECT. Because of the bottom surface of the PDMS substrate being fixed to the Petri dish, the upper surface that is attached to the ECT moves more than the microspheres deeper in the substrate. Therefore, the recordings of the microsphere movements are limited to the top of the PDMS substrate. This is accomplished by moving the microscope objective above the substrate surface and then slowly moving it downward until microspheres become resolved.
Microsphere displacement was analyzed using the two-dimensional particle-tracking feature of the MosaicSuite plugin25 for ImageJ (NIH). The plugin features three tunable parameters for particle detection: radius, cutoff, and percentile or absolute setting. The radius is the approximate radius of the microspheres to be tracked as they appear in units of pixels in the images. It is recommended to use a slightly larger radius than what would appear in the images. The default value of 3 was appropriate for the 1-μm microspheres used here. The cutoff score is used to eliminate nonparticles, where a higher score detects fewer particles. The default value of 3 was used in this study.
The percentile/absolute setting is used to determine which fraction of the bright pixels to use in particle detection. When the percentile mode is used, the value set here indicates the rth highest percentile of pixel intensities considered. When the absolute mode is used, the value entered indicates the intensity values above which are considered for tracking. The percentile mode was used here, and the value was changed as needed to increase the number of tracked particles, but 0.35 was used in most cases.
There are three standard parameters that can be tuned for linking particles once detected: displacement, link range, and dynamics. Displacement describes the maximum distance in pixels a particle will be linked between two frames of the series. Link range is the number of consecutive frames that are considered when tracking particles. The dynamics setting describes the type of particle motion to consider and includes Brownian, constant velocity, and straight line. These settings introduce penalizations to particle motions that do not fit the prescribed style of motion. The default settings of 10 and 2 were used for displacement and link range, respectively, while the straight line dynamics was used to minimize inappropriate perpendicular particle linking.
After tracking all microspheres in an image series, the results were filtered to only include microspheres that were traced through all 25 images of the series, and only traces within 200 pixels of the tissue edge were quantified (Fig. 2). Because of the linear elastic nature of the PDMS, microspheres further from the tissue edge exhibit reduced movement and would decrease the calculated mean displacement and increase variability. Analysis of microsphere displacements in 200 pixel bins from the tissue edge revealed an ∼12% decrease in displacement in each bin after the first. However, because of the high density of microspheres in the substrate, the first 200 pixel bins from the tissue edge still provide sufficient numbers of microspheres for analysis. Tissue edge location was determined using the brightfield image taken during data collection. Microsphere location data were imported into a custom MATLAB script that calculates the displacement of each microsphere based on its recorded (x, y) positions in each frame. The displacements calculated at each of the four fields are then used to create an average displacement per tissue construct, yielding three measurements per fibrinogen condition.
FIG. 2.
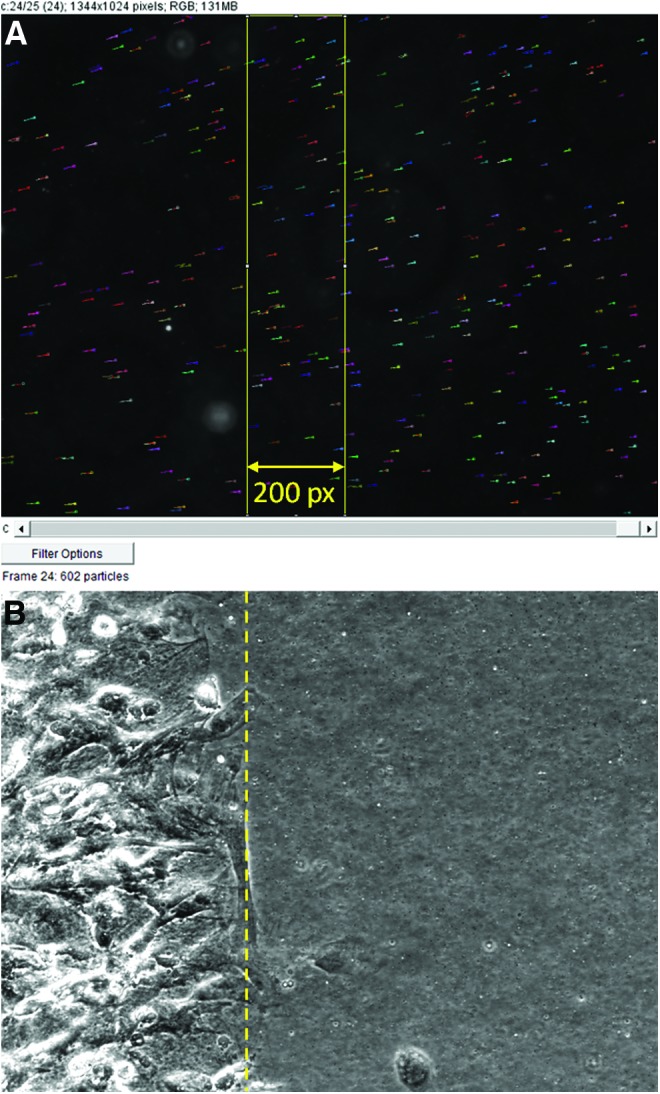
Screen capture of traced microsphere trajectories (short multicolored horizontal lines) overlaid on a single frame from the series (A) and brightfield image (B) used to determine the ECT edge (dashed yellow line). Yellow rectangle in (A) is the boxed selection of microsphere traces saved for quantification. Color images available online at www.liebertpub.com/tec
System validation by direct twitch force measurement
While the bead-tracking system does not allow for direct measurement of forces produced by constructs, it does allow for comparisons of beat strength relative to one another. This is possible because dishes are coated with the same mass of PDMS–microsphere mixture and experiments are cast using dishes from the same batch of PDMS. To verify that the relative comparisons of beat strength are valid, the twitch force produced by our hemispherical constructs was measured on a modified, custom-built force testing system16 (Fig. 1B).
Briefly, the system is composed of a media bath with a fixed post cemented to the bottom as well as two carbon pacing electrodes. A second post is attached to a force transducer and records the generated twitch forces of the paced construct. To modify the system, initially designed to test larger tissue-engineered rings, 25-gauge needles were attached to the two existing posts using polytetrafluoroethylene tape.
For these validation tests, microsphere displacement measurements were taken before removing the construct from the PDMS-coated Petri dish and impaling the compacted hemispherical constructs near their periphery onto the needles. Once in place, the construct was pretensioned using an adjustment dial and subjected to field stimulation by two carbon electrodes with the same parameters used during bead displacement measurement. Data were collected using LabVIEW and analyzed using a custom MATLAB script.
Direct twitch force measurements are reported as force normalized to the number of input cardiomyocytes. This allows for easier comparison of ECTs made from different cell numbers, cardiomyocyte purities, and sizes. This metric has been used previously as a way to report the “efficiency of a cardiac tissue engineering system”24 by describing how the measured forces are related to the initial state of the ECT.
Histology and immunohistochemistry
Constructs were fixed in 4% paraformaldehyde for 1 h at 4°C, and whole-mount immunofluorescence either stained or frozen in embedding medium and cryosectioned into 9-μm-thick sections before immunofluorescence staining. Samples were permeabilized with 0.1% Triton X-100 (Sigma), blocked with 5% Normal Donkey Serum (Jackson Immunoresearch), and incubated overnight at 4°C in primary antibody, followed by incubation at room temperature in secondary antibody and Hoechst 3332 (Life Technologies) for 1 h. Sections were mounted in fluorescent mounting medium (Dako) before imaging.
Statistical Analyses
Data are presented as means ± standard deviations of three experiments each involving three replicates for fibrin concentration dependence and one experiment involving three replicates for cell concentration dependence. All results were calculated in Microsoft Excel using Student's t-tests (fibrin and cell concentration dependence) or one-way ANOVA (PDMS substrate thickness and Young's modulus), with p-values <0.05 considered significant.
Results
PDMS substrate fabrication
A single 40-g batch of PDMS–microsphere mixture resulted in ∼30 dishes coated with 1 g of material. Variability in the number of dishes was a result of decanting the singularized microsphere mixture from the pelleted clumps after centrifugation. To determine what variability exists between different PDMS samples, three or four samples from three separate batches were mechanically tested. Once cured, the PDMS layer was measured to be 0.94 ± 0.014 (n = 4), 0.91 ± 0.02 (n = 3), and 0.77 ± 0.05 (n = 3) mm thick with corresponding Young's modulus of 8.47 ± 0.92, 6.93 ± 0.48, and 8.0 ± 0.81 kPa, respectively.
Variability between replicates of a given batch was minimal. Statistical analysis revealed a difference in the thickness (p < 0.05) but not in the Young's modulus (p = 0.09) between batches. These results highlight the importance of using the same batch when making comparisons. While the Young's modulus is the same between batches, variable thickness may result in different displacements at the surface because of the bottom of the PDMS being fixed to the Petri dish.
ECT fabrication
Immediately after creation of the fibrin gel hemisphere, the encapsulated hiPSC-CMs were rounded and nonbeating. However, within 1–2 days, the cells elongated, resumed beating, and began to compact the gel. Initially, contractions were sporadic and limited to individual cells. With increased time in culture, cells began to beat synchronously in small areas, and eventually, whole-construct contractions were observed. When formed, the construct was hemispherical and ∼5 mm in diameter and 3 mm thick at the center. However, cell-induced compaction caused the construct to flatten downward. Final ECT thickness was estimated using cross-sections and determined to be 293 ± 145 and 613 ± 129 μm for the 2 and 4 mg/mL groups, respectively (p = 0.02). Because the bottom surface of the gel was constrained to the PDMS substrate, compaction could not occur radially inward. This led to transverse isotropy, where cells appeared aligned in planes parallel to the PDMS substrate (Fig. 3B, D) but exhibited no alignment in the plane when viewed perpendicular to the substrate (Fig. 3A, C).
FIG. 3.

Immunofluorescence images of whole mount (A, C) and cross-sections (B, D) of 2 mg/mL (A, B) and 4 mg/mL (C, D) ECTs. Whole-mount images indicate an isotropic orientation of cells. Cross-sections show the cells oriented within planes parallel to the substrate, particularly near the bottom surface (left side of B, D), consistent with transverse isotropy. Scale bars = 100 μm, red = cTnT, and blue = DAPI. cTnT, cardiac troponin-T; DAPI, 4′,6-diamidino-2-phenylindole. Color images available online at www.liebertpub.com/tec
Microsphere displacement and direct force measurement
Analysis of microsphere displacements with pacing (24 V, 10-ms pulse duration, and 0.5 Hz) revealed no difference between the 2 and 4 mg/mL initial fibrinogen concentrations (22.61 ± 4.66 and 17.80 ± 6.62 pixels, respectively; p = 0.37), as shown in Figure 4A. To validate that the microsphere displacement measurements represented the twitch forces produced by the ECTs, we detached the constructs from the PDMS substrate and attached them to a custom-built force measurement system. Direct force measurement (Fig. 4B) also showed no difference between the 2 and 4 mg/mL groups (2.82 ± 1.09 and 2.57 ± 0.80 nN/input hiPSC-CM, respectively; p = 0.69). When detached from the PDMS substrate, free-floating deformation of 2 mg/mL ECTs was greater than 4 mg/mL (Supplementary Videos S1 and S2, respectively; Supplementary Data are available online at www.liebertpub.com/tec).
FIG. 4.
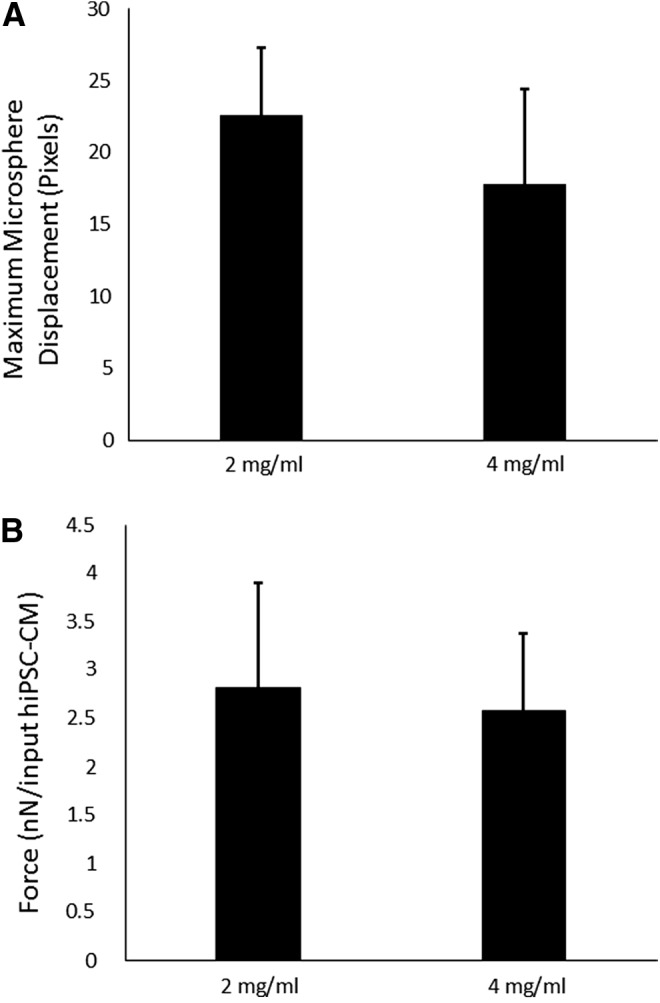
Microsphere displacement (A) and force generation (B) of ECTs comparing different fibrinogen concentrations. No difference was found between ECTs prepared from 2 and 4 mg/mL fibrin in either testing modality (n = 3; p = 0.37 for HTS, p = 0.69 for direct force measurements). HTS, high-throughput screening.
Microsphere displacement measurements (Fig. 5A) of cell concentrations revealed an increased displacement for 5 versus 3 M cells/mL (5.86 ± 0.58 and 18.59 ± 1.51 pixels, respectively; p < 0.05). Direct force measurements (Fig. 5B) of these samples also captured the difference between these two conditions (0.32 ± 0.02 and 3.58 ± 0.15 nN/input hiPSC-CM for 3 and 5 M cells/mL, respectively; p < 0.05).
FIG. 5.
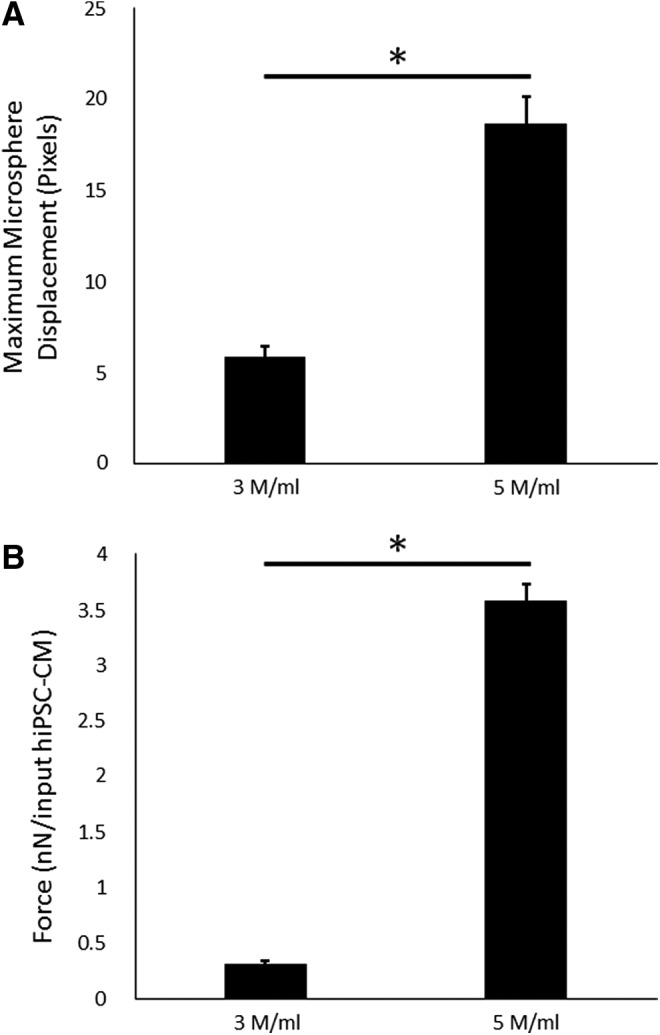
Microsphere displacement (A) and force generation (B) of ECTs comparing different cell concentrations. Both testing modalities showed a difference between the 3 and 5 M cells/mL (n = 1; p < 0.05 for HTS, p < 0.05 for direct force measurements). * = 0.05.
Discussion
This study demonstrated that fibrin gels with entrapped cells can be formed directly on the surface of a PDMS substrate and remain attached without coating the surface with ECM proteins or other functional groups. The PDMS constrains the cell-induced compaction of the gel while providing an auxotonic loading, which occurs with contraction against an elastic boundary. This has been shown to improve ECT twitch force production.26 ECTs formed as hiPSC-CM-containing fibrin gels were able to displace the microsphere-containing PDMS, which allowed for indirect quantification of the twitch force. While not reported, contraction and relaxation rates can be directly quantified and compared.
The substrate stiffness can be easily tuned by changing the ratio of PDMS components, with an increase in the ratio of part A:part B, resulting in a decrease in PDMS stiffness. This would allow for an investigation of how different elastic loading may affect twitch force production. Decreased PDMS stiffness may also allow for the generation of smaller ECTs, further increasing throughput. Sylgard 527 PDMS can be made as soft as 0.5 kPa,27 which would potentially allow for ECTs 10-fold smaller to be evaluated. Smaller ECTs were not evaluated in this study because validation using the direct force measurement setup would not have been possible.
The novel tissue contraction force microscopy assay described here is best suited for comparison of tissues with similar thickness, as would occur with application of a drug at varying concentrations to ECTs formed with the same fibrin gel composition. Rather than illustrate this simple application of our high-throughput screening (HTS), we examined the more complex case of samples with different thicknesses. Cells distributed throughout a thicker construct may contribute less force toward the deformation of the PDMS substrate because of reduced alignment with and increased distance from the surface.
In our comparisons of ECTs made from 2 versus 4 mg/mL fibrin, deformation of free-floating 2 mg/mL ECTs was greater than 4 mg/mL ECTs. While this observation could lead to the conclusion that the 2 mg/mL group produces greater force, no difference was measured comparing groups using either our HTS assay or direct force measurements, although the latter being twice as thick. This could be because the reduction in alignment and distance from the substrate do not negatively affect microsphere displacement until large thicknesses are reached.
To evaluate how an increased thickness and associated differences in cell distribution and orientation could affect comparisons in thicker samples, a model based on the anisotropic biphasic theory of tissue-equivalent mechanics6 could be developed. This theory predicts how cell traction forces induce compaction of a gel's fibrillar network, such as collagen or fibrin, and how this compaction leads to cell and fibril reorientation when there is a mechanical constraint, such as adhesion of the hemisphere at its base to the PDMS. Using this theory to model the cell force transmitted from the gel to the PDMS, the effects of gel compaction and resulting thickness on the bead displacement could be determined and the contraction force per cell estimated.
Differential gel compaction can lead to other complications in interpreting the contractile forces of engineered tissues regardless of the method used. Reduced compaction can lead to reduced cell–cell contacts, which are necessary for the formation of gap junctions and important for the fast propagation of electrical signals.28 Increased distance between cells may decrease the efficacy of paracrine signals from neighboring cells as well. Finally, constrained gel compaction is the primary effector of cell and fiber alignment in three-dimensional engineered tissues, and comparisons between aligned and isotropic ECTs show that alignment leads to increased twitch force.16 All these factors associated with differential gel thickness can and will play into the contractile force measured for gel-based ECTs by any method16–22 and need to be considered when interpreting the data.
In summary, we have described a method for screening forces generated by ECTs in a system based on traction force microscopy that we call tissue force microscopy. This method tracks fluorescent microsphere displacements in a PDMS substrate by the contraction of the tissue. The system can be fabricated and analyzed using common laboratory equipment quickly and easily, while allowing for multiple samples to be made in the same dish. We generated ECTs from two different fibrinogen concentrations as well as two different cell concentrations, measured the microsphere displacements, and then removed the ECTs from the PDMS to directly measure the contraction forces as validation of the assay.
Supplementary Material
Acknowledgments
The authors thank Dr. Patrick Alford for the use of fabrication and live cell imaging equipment and Susan Saunders for technical assistance. This study was funded by the National Institutes of Health award R01 HL108670 (R.T.T.).
Disclosure Statement
No competing financial interests exist.
References
- 1.Yu J., Vodyanik M.A., Smuga-Otto K., Antosiewicz-Bourget J., Frane J.L., Tian S., Nie J., Jonsdottir G.A., Ruotti V., Stewart R., Slukvin II., and Thomson J.A. Induced pluripotent stem cell lines derived from human somatic cells. Science 318, 1917, 2007 [DOI] [PubMed] [Google Scholar]
- 2.Lian X., Zhang J., Azarin S.M., Zhu K., Hazeltine L.B., Bao X., Hsiao C., Kamp T.J., and Palecek S.P. Directed cardiomyocyte differentiation from human pluripotent stem cells by modulating Wnt/beta-catenin signaling under fully defined conditions. Nat Protoc 8, 162, 2013 [DOI] [PMC free article] [PubMed] [Google Scholar]
- 3.Moretti A., Bellin M., Welling A., Jung C.B., Lam J.T., Bott-Flugel L., Dorn T., Goedel A., Hohnke C., Hofmann F., Seyfarth M., Sinnecker D., Schomig A., and Laugwitz K.L. Patient-specific induced pluripotent stem-cell models for long-QT syndrome. New Engl J Med 363, 1397, 2010 [DOI] [PubMed] [Google Scholar]
- 4.Sun N., Yazawa M., Liu J.W., Han L., Sanchez-Freire V., Abilez O.J., Navarrete E.G., Hu S.J., Wang L., Lee A., Pavlovic A., Lin S., Chen R., Hajjar R.J., Snyder M.P., Dolmetsch R.E., Butte M.J., Ashley E.A., Longaker M.T., Robbins R.C., and Wu J.C. Patient-specific induced pluripotent stem cells as a model for familial dilated cardiomyopathy. Sci Transl Med 4, 1, 2012 [DOI] [PMC free article] [PubMed] [Google Scholar]
- 5.Yazawa M., Hsueh B., Jia X.L., Pasca A.M., Bernstein J.A., Hallmayer J., and Dolmetsch R.E. Using induced pluripotent stem cells to investigate cardiac phenotypes in Timothy syndrome. Nature 471, 230, 2011 [DOI] [PMC free article] [PubMed] [Google Scholar]
- 6.Barocas V.H., and Tranquillo R.T. An anisotropic biphasic theory of tissue-equivalent mechanics: the interplay among cell traction, fibrillar network deformation, fibril alignment, and cell contact guidance. J Biomech Eng 119, 137, 1997 [DOI] [PubMed] [Google Scholar]
- 7.Klebe R.J., Caldwell H., and Milam S. Cells transmit spatial information by orienting collagen-fibers. Matrix 9, 451, 1990 [DOI] [PubMed] [Google Scholar]
- 8.Munevar S., Wang Y., and Dembo M. Traction force microscopy of migrating normal and H-ras transformed 3T3 fibroblasts. Biophys J 80, 1744, 2001 [DOI] [PMC free article] [PubMed] [Google Scholar]
- 9.Rodriguez M.L., Graham B.T., Pabon L.M., Han S.J., Murry C.E., and Sniadecki N.J. Measuring the contractile forces of human induced pluripotent stem cell-derived cardiomyocytes with arrays of microposts. J Biomech Eng 136, 051005, 2014 [DOI] [PMC free article] [PubMed] [Google Scholar]
- 10.Kim K., Taylor R., Sim J.Y., Park S.J., Norman J., Fajardo G., Bernstein D., and Pruitt B.L. Calibrated micropost arrays for biomechanical characterisation of cardiomyocytes. Micro Nano Lett 6, 317, 2011 [Google Scholar]
- 11.Tan J.L., Tien J., Pirone D.M., Gray D.S., Bhadriraju K., and Chen C.S. Cells lying on a bed of microneedles: an approach to isolate mechanical force. Proc Natl Acad Sci U S A 100, 1484, 2003 [DOI] [PMC free article] [PubMed] [Google Scholar]
- 12.Engler A. J., Carag-Krieger C., Johnson C.P., Raab M., Tang H.Y., Speicher D.W., Sanger J.W., Sanger J.M., and Discher D.E. Embryonic cardiomyocytes beat best on a matrix with heart-like elasticity: scar-like rigidity inhibits beating. J Cell Sci 121, 3794, 2008 [DOI] [PMC free article] [PubMed] [Google Scholar]
- 13.Jacot J.G., McCulloch A.D., and Omens J.H. Substrate stiffness affects the functional maturation of neonatal rat ventricular myocytes. Biophys J 95, 3479, 2008 [DOI] [PMC free article] [PubMed] [Google Scholar]
- 14.Bhana B., Iyer R.K., Chen W.L., Zhao R., Sider K.L., Likhitpanichkul M., Simmons C.A., and Radisic M. Influence of substrate stiffness on the phenotype of heart cells. Biotechnol Bioeng 105, 1148, 2010 [DOI] [PubMed] [Google Scholar]
- 15.Tibbitt M.W., and Anseth K.S. Hydrogels as extracellular matrix mimics for 3D cell culture. Biotechnol Bioeng 103, 655, 2009 [DOI] [PMC free article] [PubMed] [Google Scholar]
- 16.Black L.D., 3rd, Meyers J.D., Weinbaum J.S., Shvelidze Y.A., and Tranquillo R.T. Cell-induced alignment augments twitch force in fibrin gel-based engineered myocardium via gap junction modification. Tissue Eng Part A 15, 3099, 2009 [DOI] [PMC free article] [PubMed] [Google Scholar]
- 17.Boudou T., Legant W.R., Mu A., Borochin M.A., Thavandiran N., Radisic M., Zandstra P.W., Epstein J.A., Margulies K.B., and Chen C.S. A microfabricated platform to measure and manipulate the mechanics of engineered cardiac microtissues. Tissue Eng Part A 18, 910, 2012 [DOI] [PMC free article] [PubMed] [Google Scholar]
- 18.Hinds S., Bian W.N., Dennis R.G., and Bursac N. The role of extracellular matrix composition in structure and function of bioengineered skeletal muscle. Biomaterials 32, 3575, 2011 [DOI] [PMC free article] [PubMed] [Google Scholar]
- 19.Lee K.-M., Tsai K., Wang N., and Ingber D. Extracellular matrix and pulmonary hypertension: control of vascular smooth muscle cell contractility Am J Physiol 274, H76, 1998 [DOI] [PubMed] [Google Scholar]
- 20.Moon A.G., and Tranquillo R.T. Fibroblast-populated collagen microsphere assay of cell traction force: part 1. Continuum model. Aiche J 39, 163, 1993 [DOI] [PubMed] [Google Scholar]
- 21.Legant W.R., Pathak A., Yang M.T., Deshpande V.S., McMeeking R.M., and Chen C.S. Microfabricated tissue gauges to measure and manipulate forces from 3D microtissues. Proc Natl Acad Sci U S A 106, 10097, 2009 [DOI] [PMC free article] [PubMed] [Google Scholar]
- 22.Lam V., and Wakatsuki T. Hydrogel tissue construct-based high-content compound screening. J Biomol Screen 16, 120, 2011 [DOI] [PubMed] [Google Scholar]
- 23.Hansen A., Eder A., Bonstrup M., Flato M., Mewe M., Schaaf S., Aksehirlioglu B., Schwoerer A.P., Uebeler J., and Eschenhagen T. Development of a drug screening platform based on engineered heart tissue. Circ Res 107, 35, 2010 [DOI] [PubMed] [Google Scholar]
- 24.Zhang D., Shadrin I.Y., Lam J., Xian H.-Q., Snodgrass H.R., and Bursac N. Tissue-engineered cardiac patch for advanced functional maturation of human ESC-derived cardiomyocytes. Biomaterials 34, 5813, 2013 [DOI] [PMC free article] [PubMed] [Google Scholar]
- 25.Sbalzarini I.F., and Koumoutsakos P. Feature point tracking and trajectory analysis for video imaging in cell biology. J Struct Biol 151, 182, 2005 [DOI] [PubMed] [Google Scholar]
- 26.Zimmermann W.H., Melnychenko I., Wasmeier G., Didie M., Naito H., Nixdorff U., Hess A., Budinsky L., Brune K., Michaelis B., Dhein S., Schwoerer A., Ehmke H., and Eschenhagen T. Engineered heart tissue grafts improve systolic and diastolic function in infarcted rat hearts. Nat Med 12, 452, 2006 [DOI] [PubMed] [Google Scholar]
- 27.Calve S., and Simon H.G. Extracellular control of limb regeneration. In: Garikipati K. and Arruda E. M., eds. IUTAM Symposium on Cellular, Molecular and Tissue Mechanics. Dordrecht: Springer Netherlands, 2010, pp. 257–266 [Google Scholar]
- 28.Noorman M., van der Heyden M.A., van Veen T.A., Cox M.G., Hauer R.N., de Bakker J.M., and van Rijen H.V. Cardiac cell-cell junctions in health and disease: electrical versus mechanical coupling. J Mol Cell Cardiol 47, 23, 2009 [DOI] [PubMed] [Google Scholar]
Associated Data
This section collects any data citations, data availability statements, or supplementary materials included in this article.