

Abstract
Cytosolic Ca2+ signals, generated through the coordinated translocation of Ca2+ across the plasma membrane (PM) and endoplasmic reticulum (ER) membrane, mediate diverse cellular responses. Mitochondrial Ca2+ is important for mitochondrial function and, when cytosolic Ca2+ concentrations become too high, mitochondria function as cellular Ca2+ sinks. By measuring mitochondrial Ca2+ currents, we found that mitochondrial Ca2+ uptake was reduced in chicken DT40 B lymphocytes lacking either the ER-localized inositol trisphosphate receptor (IP3R), which releases Ca2+ from the ER, or Orai1 or STIM1, components of the PM-localized Ca2+-permeable channel complex that mediates store-operated calcium entry (SOCE) in response to depletion of ER Ca2+ stores. The abundance of MCU, the pore-forming subunit of the mitochondrial Ca2+ uniporter, was reduced in cells deficient in IP3R, STIM1, or Orai1. Chromatin immunoprecipitation and promoter reporter analyses revealed that the Ca2+-regulated transcription factor CREB directly bound the mcu promoter and stimulated expression. Lymphocytes deficient in IP3R, STIM1, or Orai1 exhibited altered mitochondrial metabolism, indicating that Ca2+ released from the ER and SOCE-mediated signals modulate mitochondrial function. Thus, our results showed that a transcriptional regulatory circuit involving Ca2+-dependent activation of CREB controls the Ca2+-uptake capability of mitochondria and hence regulates mitochondrial metabolism.
INTRODUCTION
Intracellular calcium ([Ca2+]i) plays an important role in regulating numerous cellular functions. Studies with isolated mitochondrial studies demonstrated that mitochondria can accumulate large amounts of Ca2+ (1–3). Mitochondrial Ca2+ uptake is mediated by an inner mitochondrial membrane-resident complex that includes the mitochondrial Ca2+ uniporter (MCU) protein. MCU exists as part of a heteromeric complex that consists of MICU1, MICU2, MCUb, MCUR1, EMRE, and SLC25A23 (4–15). Studies with isolated mitochondria and electrophysiological studies of XXX estimated that flux of Ca2+ ions through the MCU exceeds 10,000 Ca2+ ions per second (16). MCU-mediated mitochondrial Ca2+ uptake depends on the mitochondrial membrane potential (ΔΨm) and is partly inhibited at basal and low concentrations of cytosolic Ca2+ ([Ca2+]c) by the regulator MICU1 (8, 9, 17). Signaling by G protein-coupled receptors (GPCRs) or receptor tyrosine kinases that increase [Ca2+]c above 3 μM stimulates MCU current (IMCU), resulting in the accumulation of Ca2+ in the mitochondrial matrix (6, 8). Mitochondria that have accumulated Ca2+ exhibit higher mitochondrial bioenergetics through tricarboxylic acid (TCA) cycle and oxidative phosphorylation (18–20)XXX (XX). Because regulation of [Ca2+]c is critical for cell survival, one might predict that conditions that produced prolonged increases in [Ca2+]c may stimulate the expression of the genes encoding and the function of mitochondrial Ca2+-transporter proteins.
Ca2+-dependent transcription contributes to the regulation of cellular metabolism, proliferation, differentiation, and cell death (21, 22). Additionally, Ca2+-dependent transcription plays essential roles in controlling immune cell responses (23). Spatiotemporal changes in [Ca2+]c activate various transcription factors, including nuclear factor of activated T cells (NFAT), c-FOS, and cyclic AMP response element binding protein (CREB) (21, 22). In non-excitable cells, the major receptors that stimulate cytosolic Ca2+ signals are GPCRs and receptor tyrosine kinases. In both cases, cytosolic Ca2+ signals result from (i) inositol trisphosphate (IP3)-induced Ca2+ release (IICR) through ER-located IP3 receptors (IP3Rs), which are Ca2+-permeable channels, and (ii) store-operated Ca2+ entry (SOCE), which is mediated by STIM-induced activation of Orai channels [also known as Ca2+ release-activated Ca2+ (CRAC) channels] resulting from depletion of the ER Ca2+ store (21, 23–30). Mitochondria buffer cytosolic Ca2+ resulting from both IICR and SOCE, but whether expression of genes encoding proteins that mediate mitochondrial Ca2+ uptake are regulated by these Ca2+-responsive transcriptional circuits is unknown.
Here, we examined how Ca2+ signaling cascades affected the activity and abundance of MCU using chicken DT40 lymphocytes deficient in various components that mediate IICR or SOCE. Using STIM-, Orai-, and IP3R-knockout (KO) cells, we found that Ca2+ entry through STIM-activated Orai channels and Ca2+ release through IP3R channels enhanced mitochondrial uptake of Ca2+. Without IICR or SOCE, the cells did not produce spontaneous Ca2+ oscillations, MCU abundance and phosphorylation of CREB were reduced, and cellular metabolism was altered. Chromatin immunoprecipitation and reporter gene assays with HeLa cells indicated that CREB bound the mcu promoter. Re-establishment of cytosolic Ca2+ signals in IP3R- or Orai-knockout cells restored MCU abundance and activity and improved mitochondrial metabolism. These studies established crosstalk between cytoplasmic Ca2+ signaling and mitochondrial Ca2+ buffering mechanisms.
RESULTS
IP3Rs and CRAC channels alter MCU-mediated mitochondrial Ca2+ uptake rate in permeabilized cells
To determine how mitochondrial Ca2+ uptake was influenced by IICR and SOCE, we used permeabilized DT40 B lymphocytes genetically deficient for IP3R, STIM, or Orai. In addition to testing components of the SOCE complex and IP3Rs, we also examined the effect of knockout of the gene encoding phospholipase Cγ2 (PLCγ2), because this enzyme produces IP3 in DT40 cells that is prerequisite for IICR and SOCE activation (XX)(31). We measured mitochondrial Ca2+ uptake in digitonin-permeabilized IP3R1−/−/2−/−/3−/− triple knockouts (TKO), PLCγ2−/−, STIM1−/−, STIM2−/, Orai1−/−, Orai2−/−, and Orai1−/−/2−/− double knockouts (DKO) bathed in intracellular-like medium, containing mitochondrial substrate succinate, thapsigargin (Tg) to block uptake of Ca2+ into the ER by sarcoplasmic and ER Ca2+ (SERCA) pump, and Fura-2FF to detect changes in [Ca2+] (6, 32). Mitochondrial Ca2+ uptake was calculated from clearance of bath Ca2+ ([Ca2+]out) (see Materials and Methods). Because ΔΨm is a driving force for mitochondrial Ca2+ uptake, we confirmed that basal ΔΨm in the wild-type and knockout DT40 cells was similar (fig. S1 A–C).
After the permeabilized cells had reached a steady state, we applied six pulses of increased [Ca2+]out and monitored the reduction in [Ca2+]out following each pulse. We performed the experiments with permeabilized cells that had not been exposed to the Ca2+ ionophore ionomycin (Fig. 1A) and after chronic exposure of the cells prior to permeabilization to ionomycin to restore Ca2+ (Fig. 1B) (see Materials and Methods). Wild-type, STIM2 KO, and Orai2 KO exhibited similar mitochondrial Ca2+ uptake (Fig. 1A and C). In contrast, in IP3R TKO, PLCγ2 KO, STIM1 KO, Orai1 KO, and Orai1,2 DKO cells [Ca2+]out increased after each pulse, indicating compromised mitochondrial uptake (Fig. 1A and C). Both total accumulated [Ca2+]m and mitochondrial Ca2+ uptake rate in IP3R TKO, PLCγ2 KO, STIM1 KO, Orai1 KO, and Orai1,2 DKO were significantly decreased compared with that in the wild-type cells (Fig. 1C and D). Importantly, [Ca2+]out reduced after each pulse (fig. S2A) and the rate of mitochondrial Ca2+ uptake (fig. S2B) was similar in cells exposed to Tg alone or a combination of Tg and acidic intracellular compartment inhibitors (Brefeldin A and Bafilomycin A). Furthremore, the addition of the mitochondrial uncoupler (7) CCCP, which dissipatesΔΨm, resulted in the release of similar amounts of Ca2+ in cells exposed to Tg or Tg and Brefeldin A and Bafilomycin A (fig. S2C). These controls indicated that other organelles, such as endosomes, did not contribute to the clearance of [Ca2+]out in the permeabilized system.
Fig. 1.
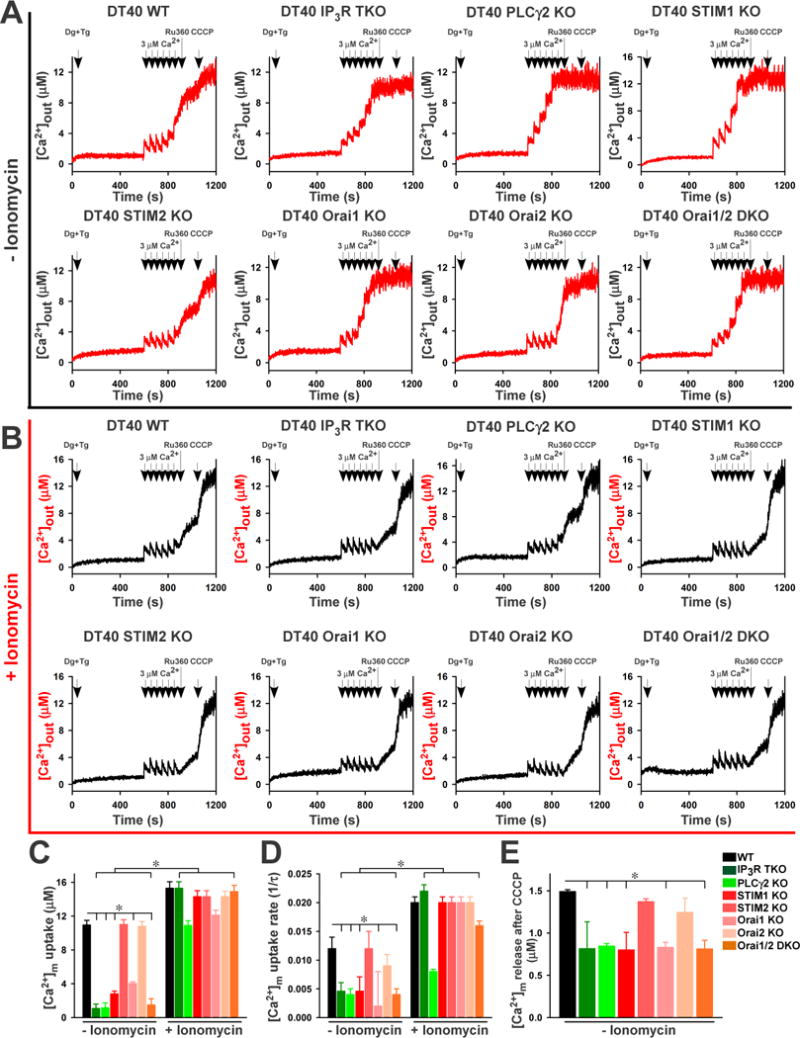
We examined the extent to which lack of IP3Rs and CRAC channel components affected basal matrix [Ca2+]m. We measured basal [Ca2+]m after dissipation of the ΔΨm with the CCCP and found that basal [Ca2+]m was significantly decreased in IP3R TKO, PLCγ2 KO, STIM1 KO, Orai1 KO, and Orai1,2 DKO cells (fig. S3 and Fig. 1E), suggesting that these cells lacked dynamic changes in [Ca2+]c and the associated signaling.
We hypothesized that the absence of signal-induced Ca2+ transients flux in IP3R TKO, PLCγ2 KO, STIM1 KO, Orai1 KO, and Orai1,2 DKO lymphocytes results in a slower rate of [Ca2+]m uptake. To investigate this hypothesis, we circumvented IICR and SOCE by chronic ionomycin treatment (2.5 nM; six days) to induce a direct increase in [Ca2+]c. Ionophores, such as ionomycin, stimulate lymphocytes by activating proliferation-inducing, Ca2+-dependent kinases (33–35). After chronic ionomycin pretreatment, we permeabilized the lymphocytes, added Tg to inhibit ER uptake of Ca2+, and monitored [Ca2+]out in response to pulses of Ca2+. The ionomycin pretreatment rescued mitochondrial Ca2+ uptake rate and accumulation in IP3R TKO, PLCγ2 KO, STIM1 KO, Orai1 KO, and Orai1,2 DKO cells to amounts comparable to those in wild-type cells (Fig. 1B, C and D). These results suggested that the Ca2+ signals produced by IICR and SOCE are important for coordinating [Ca2+]m uptake capacity with demand, which may reflect an effect on MCU activity.
IP3Rs and CRAC channel components affect MCU-mediated mitochondrial Ca2+ uptake and IMCU
To provide additional evidence that the results from the permeabilized cells represented altered mitochondrial Ca2+ uptake due to altered cytosolic Ca2+ dynamics, we examined mitochondrial Ca2+ dynamics in cells loaded with Ca2+ indicators that localized to the cytosol or mitochondria. We stimulated intact wild-type lymphocytes with immunoglobulin M (IgM), which produced a robust oscillating increase in [Ca2+]c and a steady increase in [Ca2+]m (fig. S4A). Consistent with IP3R requiring IP3 for activation, the lack of IP3 production in PLCγ2 KO in response to IgM resulted in no changes in [Ca2+]c (Fig. 2A, fig. S4A). Increased fluorescence of the mitochondria-localized fluorophore in response to IgM was substantially reduced in IP3R TKO, PLCγ2 KO, STIM1 KO, Orai1 KO, and Orai1,2 DKO lymphocytes (Fig. 2A, fig. S4A), indicating that without either IICR or SOCE mitochondrial Ca2+ uptake was reduced. Furthermore, ionomycin treatment restored mitochondrial Ca2+ uptake in STIM1 KO, Orai1 KO, and Orai1,2 DKO lymphocytes (Fig. 2A).
Fig. 2.
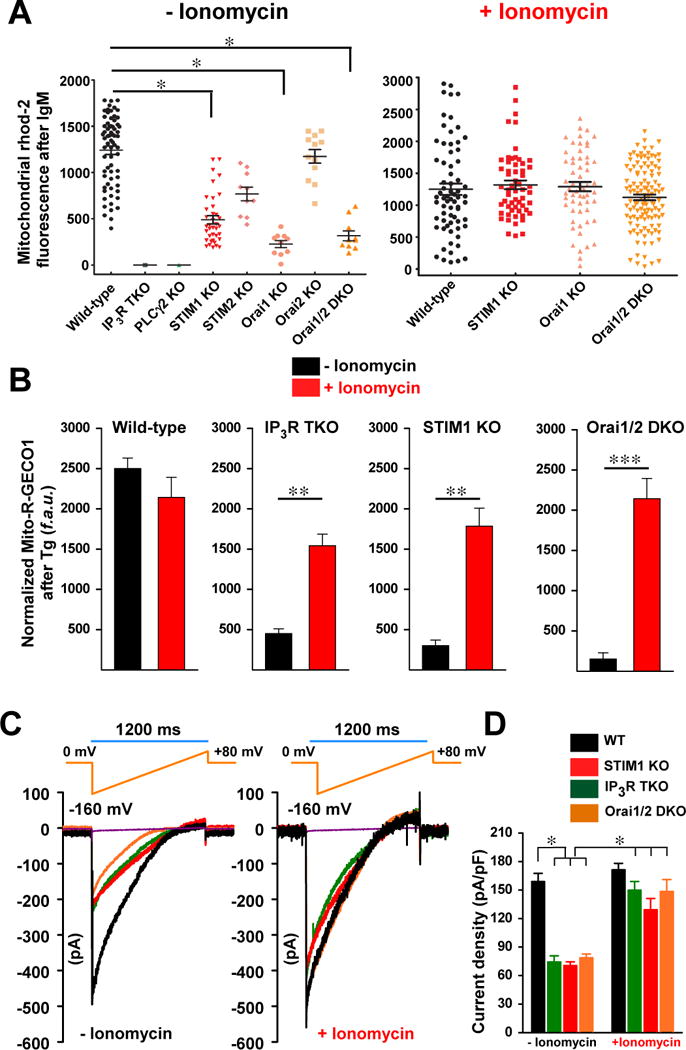
To further verify the defect of mitochondrial Ca2+ uptake in IP3R TKO, STIM1 KO, and Orai1,2 DKO cells, we measured mitochondrial Ca2+ uptake using the genetically encoded mitochondrial Ca2+ reporter, mito-R-GECO1, and recorded the mitochondrial fluorescence signal. Wild-type DT40 cells exposed to Tg exhibited a rapid increase in fluorescence that was similar without or with ionomycin pretreatment (Fig. 2B; fig. S4B). In contrast, mitochondrial Ca2+ uptake was significantly reduced in IP3R TKO, STIM1 KO, and Orai1,2 DKO lymphocytes, whereas pretreatment with ionomycin restored mitochondrial Ca2+ uptake in the KO lymphocytes (Fig. 2B; fig S4B). Under these conditions, wild-type or the KO DT40 cells treated with Tg exhibited similar cytosolic Ca2+ dynamics (fig. S5A–D).
We also measured MCU current (IMCU) in isolated mitoplasts from IP3R TKO, STIM1 KO, and Orai1,2 DKO lymphocytes. We compared the currents in cells that had or had not been pretreated with ionomycin for six days prior to mitoplast isolation. Consistent with [Ca2+]m imaging results, mitoplasts from lymphocytes of IP3R TKO, STIM1 KO, and Orai1,2 DKO had markedly reduced IMCU, whereas wild-type mitoplasts displayed classic IMCU (Fig. 2C and D). As expected, we observed a near complete restoration of IMCU in IP3R TKO, STIM1 KO, and Orai1,2 DKO mitoplasts after ionomycin pretreatment (Fig. 2C and D).
Impaired IP3Rs and CRAC-mediated Ca2+ entry reduces the expression and abundance of MCU and reduces CREB activation
One possible mechanism for the impaired mitochondrial Ca2+ uptake in IP3R TKO, PLCγ2 KO, STIM1 KO, Orai1 KO, and Orai1,2 DKO DT40 lymphocytes could be a reduction in the abundance of MCU. Indeed, Western blotting indicated that MCU abundance was low in IP3R TKO, PLCγ2 KO, STIM1 KO, Orai1 KO, and Orai1,2 DKO cells; whereas MCU was more abundant in wild-type, STIM2 KO, and Orai2 KO lymphocytes (Fig. 3, A and B). The abundance of mRNAs for MCU and the MCU paralog MCUb XXX MCUb in IP3R TKO and Orai1,2 DKO cells was also decreased compared to wild-type cells (Fig. 3C), suggesting that the decrease in MCU abundance may be due reduced gene expression. Wild-type and the KO cells had similar amounts of the MCU regulators MICU1 (Fig. 3D–F) and MCUR1 (fig. S6, A and B). Ionomycin pretreatment restored MCU protein (Fig. 3, A and B) and mRNA abundance (Fig. 3C) in IP3R and CRAC channel component KO cells. The MICU1 paralog MICU2 has nonredundant roles in some cells (12, 36), however, MICU2 was undetectable in DT40 cells possibly due to lack of antibody specificity.
Fig. 3.

To determine if the alterations in MCU abundance in the DT40 KO cells occurred in other cells deficient in components of the CRAC channel, we compared the phenotypes of STIM1or STIM2 KO DT40 cells with mouse embryonic fibroblasts with the comparable genetic KOs. In the DT40 lymphocytes, STIM1 KO but not STIM2 KO resulted in compromised mitochondrial Ca2+ uptake (Fig. 1) and reduced MCU abundance (Fig. 3), but not MCUR1 abundance (fig. S6). Consistent with these results, the abundance of MCU, but not MCUR1, was reduced in STIM1 KO but not in STIM2 KO mouse embryo fibroblasts (fig. S7).
To examine the possibility that a reduction in MCU could affect the abundance of IICR and CRAC components, we evaluated the effect of MCU knockdown on the expression and abundance of IP3R1, STIM1, and Orai1 in HeLa cells. Neither the mRNA nor the protein abundance of IP3R1, STIM1, and Orai1 were altered in MCU-knockdown cells (fig. S8).
Bioinformatic analysis of the human mcu promoter region revealed putative CREB binding sites. CREB is activated by phosphorylation at Ser133 by various signaling cascades, including extracellular signal-regulated kinases (ERKs), a Ca2+ and stress signaling pathway (37–41). Phosphorylated CREB activates transcription of numerous genes through cAMP response elements (CRE). We investigated whether the loss of IP3Rs and CRAC channel components disrupted CREB activity in the DT40 lymphocytes. We measured activation of CREB by monitoring the amount of Ser133-phosphorylated CREB by Western blotting with an antibody specific for phosphorylated-CREB (pCREB). Abundant pCREB was observed in wild-type, STIM2 KO, and Orai2 KO lymphocytes, whereas pCREB was barely detectable in IP3R TKO, PLCγ2 KO, STIM1 KO, Orai1 KO, and Orai1,2 DKO cells (Fig. 3, G and H). Similar results were observed in mouse embryonic fibroblasts lacking STIM1 but not those lacking STIM2 (fig. S9). Further, Increasing [Ca2+]c by bypassing IICR and SOCE with ionomycin increased pCREBin IP3R TKO, PLCγ2 KO, STIM1 KO, Orai1 KO, and Orai1,2 DKO cells (Fig. 3, G and H).
Because CREB phosphorylation is increased in response to increased cAMP, we measured MCU abundance in DT40 lymphocytes stimulated with forskolin to activate adenylate cyclase and increase cAMP. Similar to the effect of ionomycin, forskolin increased pCREB and MCU abundance in the KO cells to amounts indistinguishable from wild-type DT40 cells (fig. S10, A–D). ERK2 is the predominant ERK in DT40 lymphocytes (31, 42) and stimuli that increase ERK phosphorylation and activation also increase CREB activity. Therefore, we examined the ERK2 phosphorylation in the DT40 lymphocytes without or with ionomycin pretreatment, though DT40 lymphocytes predominantly express ERK2 Similar to the abundance of pCREB, the abundance of phosphorylated ERK2 was significantly decreased in IP3R TKO, PLCγ2 KO, STIM1 KO, Orai1 KO, and Orai1,2 DKO cells, and ionomycin pretreatment restored ERK2 phosphorylation to amounts similar to wild-type cells (Fig. 3, I and J). These data suggested that a Ca2+-responsive pathway, possibly involving ERK2, controls the abundance of MCU by regulating the activity of CREB.
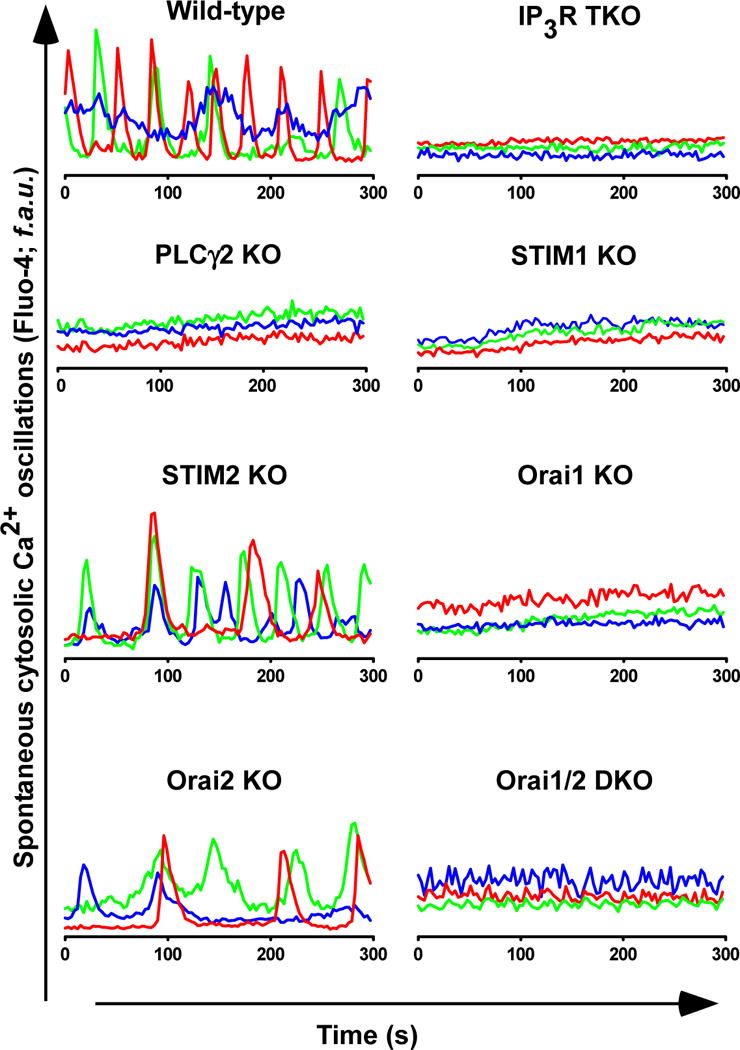
Because our data suggested that disruption of basal Ca2+ signaling, resulting in reduced activation of Ca2+-dependent transcriptional regulation, caused the reduced MCU abundance, we measured spontaneous cyctosolic Ca2+ transients using Fluo-4in the DT40 wild-type and KO lymphocytes. We observed Ca2+ oscillations in wild-type, STIM2 KO, and Orai2 KO lymphocytes but not in IP3R TKO, PLCγ2 KO, STIM1 KO, Orai1 KO, and Orai1,2 DKO cells (Fig. 4,). Because ionomycin pretreatment restored pCREB and ERK2 abundance and MCU abundance, the data indicated that ERK2 and CREB phosphorylation in DT40 lymphocytes depend on cytosolic Ca2+ dynamics and this pathway mediates CREB-induced expression of mcu.
Fig. 4.
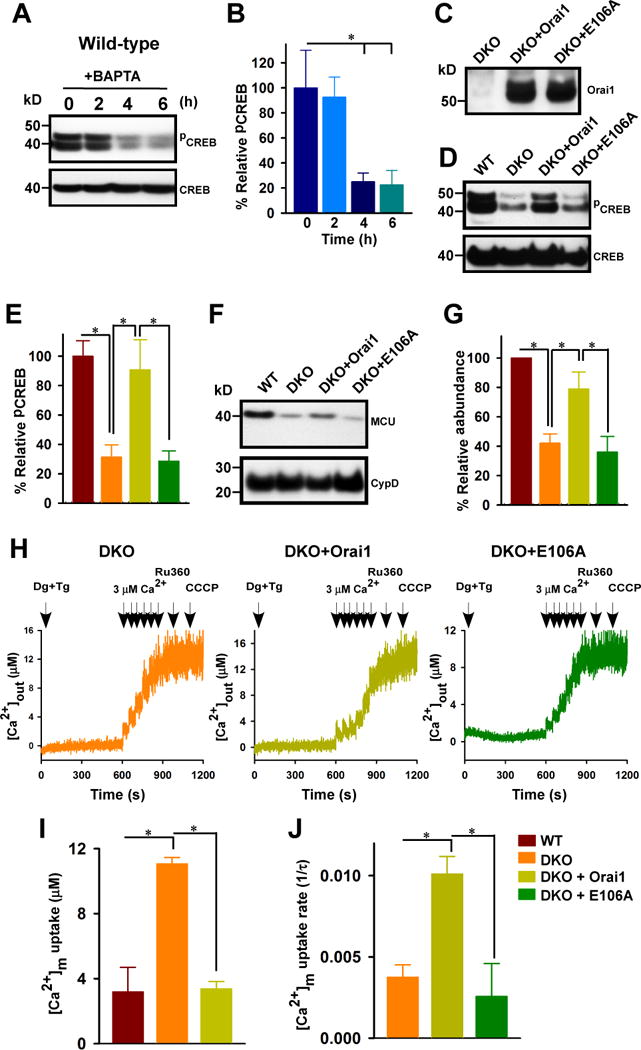
To examine the role of extracellular Ca2+ and specifically whether Orai1 and SOCE-mediated Ca2+ influx was necessary for Ca2+-dependent activation of CREB, we cultured wild-type DT40 cells in medium depleted of extracellular Ca2+ with the Ca2+ chelator BAPTA over the course of 0, 2, 4, and 6 hours. By 4 hours, the abundance of pCREB was significantly reduced (Fig. 5A, B). To determine if SOCE could restore pCREB, MCU abundance, and mitochondrial Ca2+ uptake in the Orai1/2 DKO cells, we expressed Orai1 or the loss of function mutant E106A in these cells. We confirmed by Western blot that the DKO cells lacked Orai1 and that both the wild-type Orai1 and E106A mutant were expressed in the cells (Fig. 5, C). Expression of wild-type Orai1, but not the E105A mutant, restored pCREB abundance to amounts similar to those in wild-type DT40 cells (Fig. 5, D and E) and also restored MCU abundance (Fig. 5F and G). Consistent with MCU abundance controlling the mitochondrial Ca2+ uptake in the cells, using a permeabilized cell system, we found that the expression of Orai1 in the DKO cells increased both the amount of Ca2+ accumulated by the mitochondria and the rate of uptake; whereas the E106A mutant did not rescue these mitochondrial phenotypes (Fig. 5, H, I, and J).
Fig. 5.
CREB binds the MCU promoter and induces gene expression
To examine a link between CREB phosphorylation and MCU expression, we performed chromatin immunoprecipitation (ChIP) assays. The the pCREB antiserum coimmunoprecipitated the mcu promoter sequence from HeLacells (Fig. 6, A and B). Stimulation of the cells with ionomycin, or forskolin or both increased the amount of MCU bound (Fig. 6A and B). These data support the model that ionomycin increased MCU abundance and mitochondrial Ca2+ by increasing the pCREB-mediated expression of MCU.
Fig. 6.
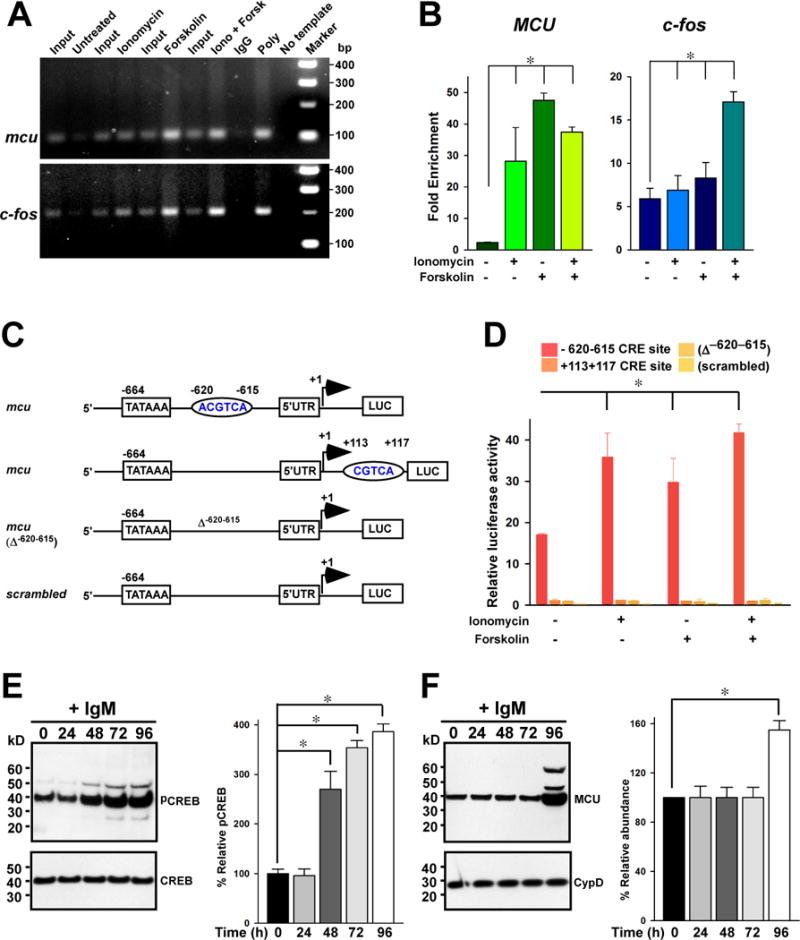
Bioinformatic analysis predicted two putative CRE sites at −620−615 bp (ACGTCA) and +113+117 bp (CGTCA) in the mcu gene. We generated luciferase reporter constructs of the mcu promoter CRE sites and expressed them in HeLa cells (Fig. 6C). One reported contained only the −620−615 CRE site, one contained only the +113+117 CRE site, one contained the region from −664 to the start site but the −620−615 site was deleted (Δ−620−615), and one contained a scrambled sequence of 664 bp. Only the −620−615 reporter exhibited expression in response to ionomycin, forskolin, or both (Fig. 6 D). Indeed, the −620−615 reporter elicited luciferase activity in unstimulated HeLa cells (Fig. 6D). These data provided additional evidence that CREB stimulates the transcription of mcu.
To examine effects of Ca2+ dynamics on transcription in a physiological setting, we stimulated wild-type DT40 lymphocytes with IgM (Fig. 6, E and F). Persistent stimulation with IgM triggered both the phosphorylation of CREB, which was increased within 48 hours and continued to increase through 96 hours, and increased MCU abundance, which appeared after 96 hours. These data suggested that the mitochondrial changes in MCU-dependent Ca2+ uptake may require long-term stimulation.
IICR- and SOCE-mediated Ca2+ signals determine mitochondrial reducing equivalents and cell fate
Mitochondrial Ca2+ accumulation from cytosolic Ca2+ transients regulates a range of mitochondrial enzymes that participate in NADH generation, the production of metabolic substrates, and the activity of the electron transport chain (20, 43, 44). Therefore, we assessed the effect of IICR- and SOCE-mediated Ca2+ signals on cellular [NAD(P)H] and metabolic enzyme activity. We measured the basal steady-state amount of NAD(P)H and basal TCA cycle-dependent NADH production in wild-type and the KO cells without and with pretreatment with ionomycin (Fig. 7A–D). We detected basal steady-state autofluorescence of NAD(P)H fluorimetrically at 350/460 nm (excitation/emission). Compared to wild-type DT40 cells, basal NAD(P)H was significantly lower NAD(P)H in IP3R TKO, PLCγ2 KO, STIM1 KO, Orai1 KO, and Orai1,2 DKO lymphocytes (Fig 7, A and C). As we predicted from the previous experiments, ionomycin treatment restored the amount of NAD(P)H to that comparable to wild-type cells for the IP3R TKO, STIM1 KO, Orai1 KO, and Orai1,2 DKO cells (Fig. 7, B and C). However, PLCγ2 KO lymphocytes exhibited reduced NAD(P)H even when treated with ionomycin, which may be due to the lack of PLCγ2-derived diacylglycerol dependent kinase signaling.
Fig. 7.
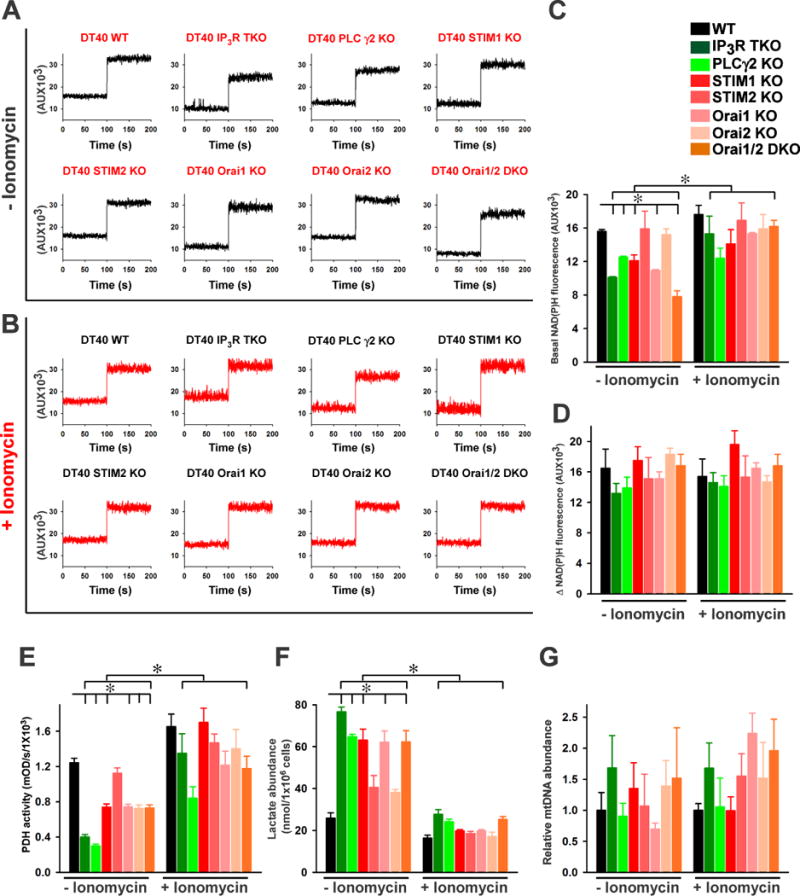
To measure the rate of NAD(P)H production, we inhibited the electron transport chain complex I with rotenone, which eliminates NADH consumption and quantified the change in NAD(P)H between the basal state and the inhibited state. We found that although there was variability in complex I-dependent NAD(P)H consumption among the cells of the various genotypes, these differences were not statistically significant and there was no significant difference between the groups with and without ionomycin pretreatment (Fig. 7, A to D). These results indicated that only NADH production was lower in DT40 KO lymphocytes.
The pyruvate dehydrogenase (PDH) complex generates acetyl-CoA for entry into the citric acid cycle (45), which mediates oxidative decarboxylation and produces NADH (19, 46, 47). PDH complex activity is stimulated by Ca2+, because Ca2+ stimulates PDH phosphatase, which dephosphorylates and activates PDH (19). To investigate the role of mitochondrial Ca2+ in this aspect of mitochondrial metabolism, we analyzed PDH activity in mitochondria isolated from wild-type and KO lymphocytes. Consistent with lower mitochondrial Ca2+ uptake in IP3R TKO, PLCγ2 KO, STIM1 KO, Orai1 KO, and Orai1,2 DKO lymphocytes, PDH activity was reduced (Fig. 7E). Mitochondria isolated from lymphocytes treated with ionomycin had significantly increased PDH activity (Fig. 7E). Reduced PDH activity often corresponds with an in lactate concentration due to increased pyruvate availability for the enzyme lactate dehydrogenase (LDH). Therefore, we measured lactate abundance in both control and ionomycin treated lymphocytes. Indeed, IP3R TKO, PLCγ2 KO, STIM1 KO, Orai1 KO, and Orai1,2 DKO lymphocytes had increased lactate levels, indicating increase concentration of lactate and ionomycin pretreatment reduced LDH activity, indicating lower concentrations of lactate (Fig. 7F).
The mitochondrial genome (mtDNA) encodes various subunits involved in oxidative phosphorylation and mitochondrial protein synthesis, therefore we measured mtDNA content relative to that of nuclear DNA in wild-type and the KO lymphocytes. The relative amount of mtDNA was highly variable among the different genotypes and within populations of cells of the same genotype, but the differences were not statistically significant (Fig. 7G), indicating that mtDNA maintenance or replication is independent of IICR and SOCE. Furthermore, the differences between cells pretreated with ionomycin and those not exposed to ionomycin were also not significant. Thus, these data indicated that differences in mtDNA were not responsible for the differences in NADH production and mitochondrial metabolism between wild-type cells and cells lacking IICR and SOCE.
Reduced mitochondrial Ca2+ uptake protects cells from oxidative stress-induced death
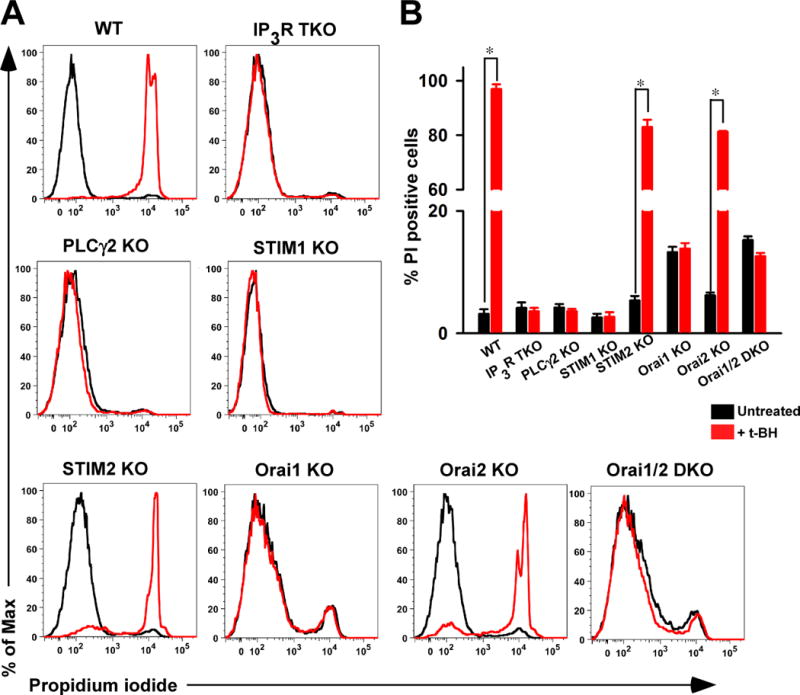
Although Ca2+ signals participate in gene transcription and cell proliferation, Ca2+ signals also play a crucial role in necrotic and apoptotic cell death as a consequence of mitochondrial Ca2+ overload (21, 42, 48–50). Given that IP3R TKO, PLCγ2 KO, STIM1 KO, Orai1 KO, and Orai1,2 DKO lymphocytes showed reduced mitochondrial Ca2+ uptake, we tested whether eliminating mitochondrial Ca2+ accumulation attenuated oxidant-induced cell death. Wild-type, STIM2 KO, and Orai2 KO lymphocytes exposed to t-butyl hydroperoxide for six hours showed a considerable number of cells that stained positive with propidium iodide, indicating that the cells had lost membrane integrity and weresusceptible to oxidative stress-induced cell death (Fig. 8, A and B). Strikingly, IP3R TKO, PLCγ2 KO, STIM1 KO, Orai1 KO, and Orai1,2 DKO lymphocytes were resistant to cell death induced by this oxidative stressor (Fig. 8, A and B). These results revealed that the cells with reduced capacity for mitochondrial Ca2+ uptake were protected from oxidative stress-induced cell death.
Fig. 8.
DISCUSSION
Ca2+ released by IP3Rs is rapidly cleared by PM-localized components and mitochondria, which decreases Ca2+ available for SERCA pumps to refill stores (22, 23, 51–56). These combined effects lead to extensive ER store depletion and an activation of CRAC channels (57, 58). When depolarized, mitochondria also inhibit CRAC channels in a Ca2+-independent manner (59), and respiring mitochondria enhance the kinetics and extent of slow inactivation of CRAC (53, 60, 61). The influence on slow inactivation of CRAC is mediated by Ca2+ uptake through MCU (4, 5). In addition to influencing the Ca2+-dependent and -independent gating of CRAC channels, mitochondria also play a role in STIM1 trafficking because strong mitochondrial depolarization reduces STIM1 puncta at ER-PM junctions without affecting its oligomerization (59). Mitochondrial Ca2+ buffering in the vicinity of the ER contributes to STIM1 oligomerization (62). Our results reveal that IICR- and SOCE-mediated Ca2+ signals also stimulate mitochondrial MCU activity, underscoring the interdependence and connectivity between these Ca2+ transport mechanisms. Here, we revealed that loss of either IP3Rs or the STIM1 and Orai1 channel complex in lymphocytes impaired the rate of mitochondrial Ca2+uptake and decreased IMCU as a result of the downregulation of the MCU pore subunit of the uniporter.
Increased [Ca2+]c resulting from either IICR or SOCE activates distinct cellular processes, including secretion, metabolism, proliferation, and cell survival (21, 63–66). Additionally, several studies have revealed that diverse Ca2+ signals differentially control gene expression profiles (67–69), and aberrant Ca2+-dependent gene regulation has been linked to debilitating human diseases, including cardiac hypertrophy, neurodegenerative disease, and severe combined immunodeficiency. IICR- and SOCE-mediated cytosolic Ca2+ signaling activates several transcription factors, including NFAT and CREB through either dephosphorylation or phosphorylation, respectively (22). Our results provide evidence that the reduced mitochondrial Ca2+ uptake was due to diminished MCU abundance, and this effect was due to decreased mcu expression mediated by the Ca2+-dependent transcription factor CREB. Cells lacking IICR or SOCE components had barely detectable CREB phosphorylation, decreased mcu expression and MCU abundance, and decreased mitochondrial Ca2+ uptake.
MCUb is a paralog of MCU that can function as a dominant-negative subunit, which reduces MCU complex activity (13). Deletion of MCU decreases MCUb protein abundance without altering MICU1 or MICU2 in HEK-293T cells (11). Our experiments indicate that loss of IICR- or SOCE-dependent cytosolic Ca2+ signals reduced the mRNAs encoding MCU and MCUb, but that of MICU1,suggesting that mcu and mcub but not micu1 expression is regulated by cytosolic Ca2+ transients. Although the abundance of both MCU and MCUb was reduced in in the KO lymphocytes, mcub does not appear to contain a CREB binding site, rather in silico analysis revealed that NFAT is likely the Ca2+-responsive transcription factor that regulates mcub.Thus, although both MCU and MCUb are transcriptionally controlled by cytosolic Ca2+ signals, their regulation is likely mediated by different transcription factors.
An interesting question is whether mitochondria contribute to diseases associated with phenotypes predominantly ascribed to deficiencies in STIM or Orai proteins, such as immunodeficiency, autoimmune hemolytic anemia, thrombocytopenia, muscular hypotonia, and disturbed enamel dentition (25, 70). Altered mitochondrial Ca2+ handling may impact STIM and Orai function in disease states. However, expression of genes encoding IICR or SOCE components was unaffected by knockdown of MCU, suggesting that reduced mitochondrial Ca2+ influx did not affect IICR or SOCE through a transcriptional circuit. This does not preclude transcriptional regulation of genes encoding IP3R, STIM, or Orai expression through other alterations in Ca2+ signaling or that reduced mitochondrial Ca2+ uptake effects IICR or SOCE through nontranscriptional pathways.
This study established a previously unknown link between cytoplasmic and mitochondrial Ca2+ regulatory mechanisms. We revealed that IICR- and SOCE-mediated Ca2+ signals stimulated CREB activation, which influenced Ca2+ uptake through the mitochondrial calcium uniporter through altered expression of mcu. Perturbation of this these cytosolic signals altered cellular metabolism. These results provide a potential mechanism for how the absence of IP3R or STIM and Orai channel components protects cells from mitochondrial Ca2+-induced permeability transition pore opening and cell death (71, 72) by decreasing the abundance of MCU. Thus, it is likely that the downregulation of mcu yields such protection (73). Moreover, our findings reveal that IICR and SOCE participate in basal calcium signaling that controls mitochondrial metabolism by maintaining the expression of MCU and thus mitochondrial calcium uptake. It also suggests that cells can adapt their mitochondrial uptake capacity to match the amount of calcium signaling the cell experiences.
MATERIALS AND METHODS
Cell culture
DT40 cells were maintained in suspension culture at 40°C in complete RPMI 1640 [RPMI 1640 media (GIBCO/BLR) supplemented with 10% (v/v) fetal bovine serum (FBS), 1% chicken serum, 2 mM glutamine, 1% antibiotics (Penicillin and streptomycin)]. For pretreatment with ionomycin, 2.5 nM was added to the medium for XX days. Mouse embryo fibroblasts derived from wild-type, STIM1 KO, and STIM2 KO mice were grown in complete DMEM medium ([DMEM media (GIBCO/BLR) supplemented with 10% (v/v) fetal bovine serum (FBS) and 1% antibiotics (Penicillin and streptomycin)]). HeLa-knockdown cells (negative shRNA and MCU KD) were grown in complete DMEM medium supplemented with puromycin (2 μg/ml). All rescue cells (DKO + Orai1, DKO + Orai1 E106A) were grown in complete RPMI 1640 supplemented with G418 (500 μg/ml). To generate Orai1 rescue cells, DT40 Orai1,2 DKO cells were electroporated with either wild-type Orai1 or Orai1 E106A plasmid constructs. After 48 hours the electroporated cells were selected with G418 (500 μg/ml) for 2 weeks and the stable clones were maintained in complete RPMI 1640 with G418.
Ca2+ uptake and ΔΨm measurement in the permeabilized-cell system
1×10⁷ cells were resuspended and permeabilized with 40 μg/ml digitonin in 1.5 ml of intracellular medium composed of 120 mM KCl, 10 mM NaCl, 1 mM KH2PO4, 20 mM Hepes-Tris, pH 7.2, and 2 μM thapsigargin to block the SERCA pump. Experiments were performed in the presence of 5 mM succinate at 37°C with constant stirring. For measuring mitochondrial Ca2+ uptake, the permeabilized cells were loaded with 1.0 μM Fura-2FF. Fluorescence was monitored in a multiwavelength excitation dual wavelength emission fluorimeter (Delta RAM, PTI). Extramitochondrial Ca2+ was recorded as an excitation ratio (340 nm/380 nm) and emission at 510 nm of Fura-2FF fluorescence. ΔΨm was measured using JC-1 (800 nm) as the ratio of the fluorescence of J-aggregate (570 nm excitation/595 nm emission) and monomer (490 nm excitation/535 nm emission) forms (74, 75). Six 3 μM Ca2+ pulses were added at 50 s interval starting at 600 s, and the changes in ΔΨm and extramitochondrial Ca2+ fluorescence were monitored. Mitochondrial Ca2+ uptake was derived from the decay of bath [Ca2+] after Ca2+ pulses. To exclude the Ca2+sequestration by intracellular acidic compartments, mitochondrial Ca2+ uptake was measured in the presence of Bafilomycin (1 μM), Brefeldin A (1 μM) or a combination of both (76). To verify the mitochondrial Ca2+ uptake, MCU blocker, Ru360 (1 μM) and mitochondrial uncoupler CCCP (3 μM) were added as indicated.
To assess the resting [Ca2+]m, DT40 lymphocytes were permeabilized with digitonin in intracellular-like medium containing the bath [Ca2+] indicator Fura2FF (1 μM). After baseline recording, CCCP (3 μM) was added at 150 s to release the mitochondrial Ca2+.
Cytosolic and mitochondrial Ca2+ dynamics
DT40 lymphocytes were transiently transfected with genetically encoded mitochondrial targeted Ca2+ sensor mito-R-GECO1 plasmid by electroporation using the Gene Pulser II electroporation system (Bio-Rad). After 48 hours, the transfected cells were plated on Cell-Tak (BD Biosciences, Bedford, MA) coated 25-mm glass coverslips for one hour. After 1 min of baseline recording, Tg (2 μM) was added, and the change of mito-R-GECO1 fluorescence was measured with 561 nm excitation on a Carl Zeiss META 510 confocal microscope equipped with a 40 × oil objective.
DT40 cells were plated on Cell-Tak-coated 25-mm glass coverslips and loaded with 2 μM Rhod-2 AM (50 min) and 5 μM Fluo-4 AM (30 min) in extracellular medium. After dye loading, cells were washed with dye free medium and placed on the microscope stage for imaging (6–8, 53, 72). After 1 min of baseline recording, IgM (1.5 μg/ml) was added and confocal images were recorded every 3s (510 Meta; Carl Zeiss) with 488 and 561 nm excitation using a 40 × oil objective to simultaneously monitor cytoplasmic and mitochondrial Ca2+ dynamics. Images were analyzed and quantified using ZEN 2010 software. To monitor the cyctosolic spontaneous Ca2+ oscillations, DT40 cells were loaded with cytosolic Ca2+ indicator Fluo-4 AM as described above. Fluo-4 loaded cells were placed on the microscope stage for monitoring Ca2+ oscillations.
Mitoplast patch-clamp recording
Mitoplast patch-clamp recordings were performed at 30°C as detailed previously with modifications (6, 14, 16, 77). Freshly prepared mitoplasts were stored at 4°C for about 60 – 90 minutes. Mitoplasts were placed upon the Cell-Tak coated coverslips and mounted on the microscope. The integrity of the mitoplasts was stable for 15 min at 30oC. Mitoplasts isolated from DT40 B-lymphocytes were bathed in a solution containing sodium gluconate (150 mM), KCl (5.4 mM), CaCl2 (5 mM), HEPES (10 mM), pH 7.2. The pipette solution contained sodium gluconate (150 mM), NaCl (5 mM), sucrose (135 mM), HEPES (10 mM), and EGTA (1.5 mM), pH 7.2. After formation of GΩ seals (20–35 MΩ), the mitoplasts were ruptured with a 200–400 mV pulse for 2 to 6 ms. Mitoplast capacitance was measured (2.5–3.0 pF). After capacitance compensation, mitoplasts were held at 0 mV and IMCU was elicited with a voltage ramp (from −160 mV to 80 mV, 120 mV/s).
Samples were discarded if the break-in took longer than 5s after addition of 5 mM Ca2+. Currents were recorded using an Axon200B patch-clamp amplifier with a Digidata 1320A acquisition board (pClamp 10.0 software; Axon Instruments). The pipette solution (5 mM Ca2+) was chosen based on previous measurements (6).
Western blotting analysis
Cell extracts were prepared from ionomycin-treated and untreated DT40 cells, HeLa NegShRNA, HeLa MCU KD (6), wild-type, STIM1 KO, and STIM2 KO mouse embryo fibroblasts using RIPA buffer (50 mM Tris-HCl, pH 7.4, 150 mM NaCl, 0.25% deoxycholic acid, 1 mM EDTA, 1% NP-40, protease inhibitor cocktail (Complete, Roche), and Halt phosphatase inhibitor cocktail (Thermo SCIENTIFIC)). Equal amounts of protein (25 μg/lane) were separated on 4–12% Bis –Tris polyacrylamide gel, transferred to a PVDF membrane, and probed with antibodies specific for MCU (Custom made antibody), MICU1 (1:1000, Cell Signaling Technology), MCUR1 (1:1000, Aviva Systems Biology), cyclophilin D (1:1000, Abcam), CREB (1:1000, Cell Signaling Technology), phosphorylated CREB (1:1000, Cell Signaling Technology), IP3R1 (1:2000, Bethyl Laboratories), STIM1 (1:1000, BD Transduction Laboratories), Orai1 (1:2000, Sigma Aldrich), ERK (1:2000, Thermo SCIENTIFIC, USA), and phosphorylated ERK (1:1000, Cell Signaling Technology). The polyclonal rabbit MCU antibody was custom prepared by YenZym Antibodies, LLC. The following MCU peptide was used for immunization with KLH conjugation: CGVSRHRQQQHHRTVHQR. The polyclonal antibody was affinity purified and the specificity was confirmed by ELISA.
NAD(P)H measurements
Ionomycin-treated and untreated DT40 cells (10 × 106 cells) were suspended in Hanks’ balanced salt solution (Sigma). Autofluorescence of NAD(P)H was monitored at 350/460 nm (excitation/emission) using a multiwavelength excitation, dual-wavelength emission fluorimeter (Delta RAM, PTI, Birmingham, NJ) (78). Experiments were performed at 37 °C.
Quantitative RT-PCR
Total RNA from DT40 lymphocytes and HeLa cells was isolated using RNeasy Mini Kit from Qiagen (Qiagen Sciences, Valencia, CA, USA) and reverse transcribed using iScript cDNA synthesis kit (Bio-Rad, Hercules, CA, USA). Real-time quantification was performed in a 20 μl reaction, 96-well format (0.2 μl cDNA; 300 nmol/L of forward and reverse primer; 1x iQ SYBR Green supermix (Biorad)) using the StepOnePlus™ Real-Time PCR Systems (Applied Biosystems). Specific primers that were used for the real-time PCR amplification included: Chicken MCU forward: 5′-TTG GCA GAG TGT GAG AGT GG-3’, Chicken MCU reverse: 5’-AAT TCC TCG GTC CTC TGC TT-3’, Chicken MCUb forward: 5’-AGG CTT CTA TGG GTT GGT TTA G-3’, Chicken MCUb reverse: 5’-CTC CAT GAT GTC CCA CGA ATA G-3’, Chicken MICU1 forward: 5’-CAG CCC TAC AAT CCC TAA GAA C-3’, Chicken MICU1 reverse: 5’-GGA GAA ATC GAA GAC GGA ACA-3’, Chicken GAPDH forward: 5’-GGA CAC TTC AAG GGC ACT GT-3’, Chicken GAPDH reverse: 5’-TCT CCA TGG TGG TGA AGA CA-3’. The relative amount of MCU, MCUb and MICU1 mRNA normalized to GAPDH was calculated using the StepOnePlus™ Software v2.3.
For quantification of mRNA encoding IP3R1 and CRAC components in HeLa MCU KD cells, Taqman probes for STIM1 (Life Technologies, Assay ID: Hs00162394_m1), ITPR1 (Life Technologies, Assay ID: Hs00181881_m1), and ORAI1 ((Life Technologies, Assay ID: Hs03046013_m1) were used. All data were normalized to human β-actin content (Life Technologies, human ACTB, endogenous Control, VIC®/MGB probe) and depicted as fold change over NegshRNA cells.
Chromatin immunoprecipitation (ChIP), quantitative PCR, and luciferase activity
HeLa cells were grown to ~80–90% confluency in a 150-mm culture dish containing 20 ml DMEM media. The cells were stimulated with ionomycin (2.5 μM) with or without forskolin (5 μM) for 30 min. ChIP assays were performed using Magna ChIP™ G kit (Millipore) according to manufacturer’s instruction. In brief, DNA-protein complexes were crosslinked and immunoprecipitated using ChIP-validated antibodies against RNA Polymerase II, pCREB (Cell signaling Technology), and negative control IgG. Immune complexes were extracted and analyzed by 2% agarose gel after PCR or by quantitative PCR using primers GPH1001674(-)01A (Qiagen) that flank specific regions in the MCU promoter and the SimpleChIP human c-FOS promoter primers (Cell Signaling Technology). Values were normalized by input DNA. Results were depicted as the fold enrichment over basal expression.
HeLa cells (1 × 10⁶) were transfected with luciferase reporter plasmids (4 μg) containing MCU promoter sequence with or without binding elements for CREB using Mirus LT-1 transfection reagent. After 48 hours, cells were stimulated with ionomycin (2.5 μM) with or without forskolin (5 μM) for 30 min. The cells were lysed, and luciferase activity was measured (LightSwitch Luciferase assay reagent™) using a plate reader (infinite M1000 PRO, TECAN).
Pyruvate dehydrogenase activity
Mitochondria isolated from DT40 lymphocytes were subjected to PDH enzyme activity in a microplate assay (Mitochondria isolation kit; #ab11070, abcam and PDH microplate assay kit, #ab109902, abcam). The activity is determined by the rate of conversion of NAD+ to NADH, which is coupled with reporter dye, and the absorbance change was recorded at 450 nm (infinite M1000 PRO, TECAN).
Measurement of lactate
The assay was performed using LDH assay kit (Pierce). 1 × 10⁴ cells were lysed with 10 × lysis buffer for 45 min. The lysate was centrifuged at 1,250 × g for 3 min, and the 50 μl of supernatant was transferred to a 96-well plate with the detection reagents. After incubation at room temperature for 30 min, the reaction was terminated, and the formazan was measured by spectrophotometric absorbance at 490 nm and 680 nm (infinite M1000 PRO, TECAN). The formation of formazan was proportional to the amount of lactate converted intopyruvate via reduction of NAD+ to NADH.
Measurement of mtDNA content
DNA was isolated from lymphocytes by SDS-Proteinase K digestion, and 2 μg DNA was digested by BamHI. Biological triplicate samples for wild-type and knockouts (with and without ionomycin) were resolved by electrophoresis through a 0.6% agarose gel in 0.5X TBE. Gels were processed and transferred by capillary action. The membrane was UV crosslinked and probed with a random-primed radiolabeled probe against the nuclear 18S rRNA gene. The signal was determined by photostimulated luminescence. The membrane was re-probed using random-primed PCR-amplified mtDNA fragments, and the relative abundance of mtDNA to nuclear DNA was calculated (7).
Cell viability measurement
DT40 lymphocytes were exposed to t-butyl hydroperoxide (200 μM) for six hours, then the cells were harvested and stained with propidium iodide, and cells were sorted with a BD FACS Canto (BD Biosciences) immediately. Dead cells were defined as propidium iodide positive. Relative propodium iodide staining was plotted on a logarithmic scale using Flow-Jo software.
Statistical analysis
Data from multiple experiments were quantified and illustrated as mean ± SEM, and differences between groups were analyzed by two-tailed paired t-test followed by a post hoc Bonferroni correction. P < 0.00625 was considered statistically significant. To determine the significance within groups, a one-way analysis of variance with Tukey correction was performed. P value < 0.05 was considered significant. The significance of mRNA and protein abundance was determined as P < 0.05 by Z test. Data were analyzed and plotted either with Graph pad Prism version 5.0 or Sigma Plot 11.0 software.
Supplementary Material
Acknowledgments
We thank Anjana Rao and Robert E. Campbell for sharing STIM knockout MEFs and mito-R-GECO1 plasmid construct, respectively. We also thank Farah Shaikh and Maggie Cheung for their technical assistance. We thank Dr. Huaqing Zhao for help with statistical analysis.
Funding: This research was funded by the National Institutes of Health (R01HL086699, R01HL119306, and R01GM109882 to MM).
Footnotes
Author contributions: S.S., S.R., N.E.H., and M.M. designed and performed experiments, analyzed data, and wrote the manuscript. X.Z. and J.Y.C. performed electrophysiology experiments and data analysis; J.E.K. and B.K. performed and interpreted the mtDNA analysis; K.J.H., S.G. and J.R. performed confocal imaging and luciferase assay; Y.B., Y.Z., D.L.G. and T.K. generated the DT40 knockout lymphocytes. N.R.J. and R.C. performed flow-cytometry analysis, D.L.G. and T.K. edited the manuscript. M.M. conceived the project and wrote the manuscript.
Competing interests: The authors declare that they have no competing interests.
REFERENCES AND NOTES
- 1.Drago I, Pizzo P, Pozzan T. After half a century mitochondrial calcium in- and efflux machineries reveal themselves. EMBO J. 2011;30:4119–4125. doi: 10.1038/emboj.2011.337. [DOI] [PMC free article] [PubMed] [Google Scholar]
- 2.Rizzuto R, De Stefani D, Raffaello A, Mammucari C. Mitochondria as sensors and regulators of calcium signalling. Nat Rev Mol Cell Biol. 2012;13:566–578. doi: 10.1038/nrm3412. [DOI] [PubMed] [Google Scholar]
- 3.Gunter TE, Pfeiffer DR. Mechanisms by which mitochondria transport calcium. Am J Physiol. 1990;258:C755–786. doi: 10.1152/ajpcell.1990.258.5.C755. [DOI] [PubMed] [Google Scholar]
- 4.Baughman JM, Perocchi F, Girgis HS, Plovanich M, Belcher-Timme CA, Sancak Y, Bao XR, Strittmatter L, Goldberger O, Bogorad RL, Koteliansky V, Mootha VK. Integrative genomics identifies MCU as an essential component of the mitochondrial calcium uniporter. Nature. 2011;476:341–345. doi: 10.1038/nature10234. [DOI] [PMC free article] [PubMed] [Google Scholar]
- 5.De Stefani D, Raffaello A, Teardo E, Szabo I, Rizzuto R. A forty-kilodalton protein of the inner membrane is the mitochondrial calcium uniporter. Nature. 2011;476:336–340. doi: 10.1038/nature10230. [DOI] [PMC free article] [PubMed] [Google Scholar]
- 6.Hoffman NE, Chandramoorthy HC, Shamugapriya S, Zhang X, Rajan S, Mallilankaraman K, Gandhirajan RK, Vagnozzi RJ, Ferrer LM, Sreekrishnanilayam K, Natarajaseenivasan K, Vallem S, Force T, Choi ET, Cheung JY, Madesh M. MICU1 motifs define mitochondrial calcium uniporter binding and activity. Cell reports. 2013;5:1576–1588. doi: 10.1016/j.celrep.2013.11.026. [DOI] [PMC free article] [PubMed] [Google Scholar]
- 7.Mallilankaraman K, Cardenas C, Doonan PJ, Chandramoorthy HC, Irrinki KM, Golenar T, Csordas G, Madireddi P, Yang J, Muller M, Miller R, Kolesar JE, Molgo J, Kaufman B, Hajnoczky G, Foskett JK, Madesh M. MCUR1 is an essential component of mitochondrial Ca2+ uptake that regulates cellular metabolism. Nat Cell Biol. 2012;14:1336–1343. doi: 10.1038/ncb2622. [DOI] [PMC free article] [PubMed] [Google Scholar]
- 8.Mallilankaraman K, Doonan P, Cardenas C, Chandramoorthy HC, Muller M, Miller R, Hoffman NE, Gandhirajan RK, Molgo J, Birnbaum MJ, Rothberg BS, Mak DO, Foskett JK, Madesh M. MICU1 is an essential gatekeeper for MCU-mediated mitochondrial Ca(2+) uptake that regulates cell survival. Cell. 2012;151:630–644. doi: 10.1016/j.cell.2012.10.011. [DOI] [PMC free article] [PubMed] [Google Scholar]
- 9.Csordas G, Golenar T, Seifert EL, Kamer KJ, Sancak Y, Perocchi F, Moffat C, Weaver D, de la Fuente Perez S, Bogorad R, Koteliansky V, Adijanto J, Mootha VK, Hajnoczky G. MICU1 Controls Both the Threshold and Cooperative Activation of the Mitochondrial Ca(2+) Uniporter. Cell Metab. 2013;17:976–987. doi: 10.1016/j.cmet.2013.04.020. [DOI] [PMC free article] [PubMed] [Google Scholar]
- 10.Perocchi F, Gohil VM, Girgis HS, Bao XR, McCombs JE, Palmer AE, Mootha VK. MICU1 encodes a mitochondrial EF hand protein required for Ca(2+) uptake. Nature. 2010;467:291–296. doi: 10.1038/nature09358. [DOI] [PMC free article] [PubMed] [Google Scholar]
- 11.Sancak Y, Markhard AL, Kitami T, Kovacs-Bogdan E, Kamer KJ, Udeshi ND, Carr SA, Chaudhuri D, Clapham DE, Li AA, Calvo SE, Goldberger O, Mootha VK. EMRE is an essential component of the mitochondrial calcium uniporter complex. Science. 2013;342:1379–1382. doi: 10.1126/science.1242993. [DOI] [PMC free article] [PubMed] [Google Scholar]
- 12.Plovanich M, Bogorad RL, Sancak Y, Kamer KJ, Strittmatter L, Li AA, Girgis HS, Kuchimanchi S, De Groot J, Speciner L, Taneja N, Oshea J, Koteliansky V, Mootha VK. MICU2, a paralog of MICU1, resides within the mitochondrial uniporter complex to regulate calcium handling. PLoS One. 2013;8:e55785. doi: 10.1371/journal.pone.0055785. [DOI] [PMC free article] [PubMed] [Google Scholar]
- 13.Raffaello A, De Stefani D, Sabbadin D, Teardo E, Merli G, Picard A, Checchetto V, Moro S, Szabo I, Rizzuto R. The mitochondrial calcium uniporter is a multimer that can include a dominant-negative pore-forming subunit. EMBO J. 2013;32:2362–2376. doi: 10.1038/emboj.2013.157. [DOI] [PMC free article] [PubMed] [Google Scholar]
- 14.Hoffman NE, Chandramoorthy HC, Shanmughapriya S, Zhang XQ, Vallem S, Doonan PJ, Malliankaraman K, Guo S, Rajan S, Elrod JW, Koch WJ, Cheung JY, Madesh M. SLC25A23 augments mitochondrial Ca2+ uptake, interacts with MCU, and induces oxidative stress-mediated cell death. Mol Biol Cell. 2014;25:936–947. doi: 10.1091/mbc.E13-08-0502. [DOI] [PMC free article] [PubMed] [Google Scholar]
- 15.Marchi S, Pinton P. The mitochondrial calcium uniporter complex: molecular components, structure and physiopathological implications. J Physiol. 2014;592:829–839. doi: 10.1113/jphysiol.2013.268235. [DOI] [PMC free article] [PubMed] [Google Scholar]
- 16.Kirichok Y, Krapivinsky G, Clapham DE. The mitochondrial calcium uniporter is a highly selective ion channel. Nature. 2004;427:360–364. doi: 10.1038/nature02246. [DOI] [PubMed] [Google Scholar]
- 17.Logan CV, Szabadkai G, Sharpe JA, Parry DA, Torelli S, Childs AM, Kriek M, Phadke R, Johnson CA, Roberts NY, Bonthron DT, Pysden KA, Whyte T, Munteanu I, Foley AR, Wheway G, Szymanska K, Natarajan S, Abdelhamed ZA, Morgan JE, Roper H, Santen GW, Niks EH, van der Pol WL, Lindhout D, Raffaello A, De Stefani D, den Dunnen JT, Sun Y, Ginjaar I, Sewry CA, Hurles M, Rizzuto R, Consortium UK, Duchen MR, Muntoni F, Sheridan E. Loss-of-function mutations in MICU1 cause a brain and muscle disorder linked to primary alterations in mitochondrial calcium signaling. Nature genetics. 2014;46:188–193. doi: 10.1038/ng.2851. [DOI] [PubMed] [Google Scholar]
- 18.Hajnoczky G, Robb-Gaspers LD, Seitz MB, Thomas AP. Decoding of cytosolic calcium oscillations in the mitochondria. Cell. 1995;82:415–424. doi: 10.1016/0092-8674(95)90430-1. [DOI] [PubMed] [Google Scholar]
- 19.Glancy B, Balaban RS. Role of mitochondrial Ca2+ in the regulation of cellular energetics. Biochemistry. 2012;51:2959–2973. doi: 10.1021/bi2018909. [DOI] [PMC free article] [PubMed] [Google Scholar]
- 20.Denton RM. Regulation of mitochondrial dehydrogenases by calcium ions. Biochim Biophys Acta. 2009;1787:1309–1316. doi: 10.1016/j.bbabio.2009.01.005. [DOI] [PubMed] [Google Scholar]
- 21.Berridge MJ, Bootman MD, Roderick HL. Calcium signalling: dynamics, homeostasis and remodelling. Nat Rev Mol Cell Biol. 2003;4:517–529. doi: 10.1038/nrm1155. [DOI] [PubMed] [Google Scholar]
- 22.Soboloff J, Rothberg BS, Madesh M, Gill DL. STIM proteins: dynamic calcium signal transducers. Nat Rev Mol Cell Biol. 2012;13:549–565. doi: 10.1038/nrm3414. [DOI] [PMC free article] [PubMed] [Google Scholar]
- 23.Hogan PG, Lewis RS, Rao A. Molecular basis of calcium signaling in lymphocytes: STIM and ORAI. Annu Rev Immunol. 2010;28:491–533. doi: 10.1146/annurev.immunol.021908.132550. [DOI] [PMC free article] [PubMed] [Google Scholar]
- 24.Vig M, Peinelt C, Beck A, Koomoa DL, Rabah D, Koblan-Huberson M, Kraft S, Turner H, Fleig A, Penner R, Kinet JP. CRACM1 is a plasma membrane protein essential for store-operated Ca2+ entry. Science. 2006;312:1220–1223. doi: 10.1126/science.1127883. [DOI] [PMC free article] [PubMed] [Google Scholar]
- 25.Feske S, Gwack Y, Prakriya M, Srikanth S, Puppel SH, Tanasa B, Hogan PG, Lewis RS, Daly M, Rao A. A mutation in Orai1 causes immune deficiency by abrogating CRAC channel function. Nature. 2006;441:179–185. doi: 10.1038/nature04702. [DOI] [PubMed] [Google Scholar]
- 26.Roos J, Digregorio PJ, Yeromin AV, Ohlsen K, Lioudyno M, Zhang S, Safrina O, Kozak JA, Wagner SL, Cahalan MD, Velicelebi G, Stauderman KA. STIM1, an essential and conserved component of store-operated Ca2+ channel function. J Cell Biol. 2005;169:435–445. doi: 10.1083/jcb.200502019. [DOI] [PMC free article] [PubMed] [Google Scholar]
- 27.Liou J, Kim ML, Heo WD, Jones JT, Myers JW, Ferrell JE, Jr, Meyer T. STIM is a Ca2+ sensor essential for Ca2+-store-depletion-triggered Ca2+ influx. Curr Biol. 2005;15:1235–1241. doi: 10.1016/j.cub.2005.05.055. [DOI] [PMC free article] [PubMed] [Google Scholar]
- 28.Zhang SL, Yeromin AV, Zhang XH, Yu Y, Safrina O, Penna A, Roos J, Stauderman KA, Cahalan MD. Genome-wide RNAi screen of Ca(2+) influx identifies genes that regulate Ca(2+) release-activated Ca(2+) channel activity. Proc Natl Acad Sci U S A. 2006;103:9357–9362. doi: 10.1073/pnas.0603161103. [DOI] [PMC free article] [PubMed] [Google Scholar]
- 29.Luik RM, Wang B, Prakriya M, Wu MM, Lewis RS. Oligomerization of STIM1 couples ER calcium depletion to CRAC channel activation. Nature. 2008;454:538–542. doi: 10.1038/nature07065. [DOI] [PMC free article] [PubMed] [Google Scholar]
- 30.McNally BA, Somasundaram A, Yamashita M, Prakriya M. Gated regulation of CRAC channel ion selectivity by STIM1. Nature. 2012;482:241–245. doi: 10.1038/nature10752. [DOI] [PMC free article] [PubMed] [Google Scholar]
- 31.Jiang A, Craxton A, Kurosaki T, Clark EA. Different protein tyrosine kinases are required for B cell antigen receptor-mediated activation of extracellular signal-regulated kinase, c-Jun NH2-terminal kinase 1, and p38 mitogen-activated protein kinase. J Exp Med. 1998;188:1297–1306. doi: 10.1084/jem.188.7.1297. [DOI] [PMC free article] [PubMed] [Google Scholar]
- 32.Hawkins BJ, Levin MD, Doonan PJ, Petrenko NB, Davis CW, Patel VV, Madesh M. Mitochondrial complex II prevents hypoxic but not calcium- and proapoptotic Bcl-2 protein-induced mitochondrial membrane potential loss. J Biol Chem. 2010;285:26494–26505. doi: 10.1074/jbc.M110.143164. [DOI] [PMC free article] [PubMed] [Google Scholar]
- 33.Chatila T, Silverman L, Miller R, Geha R. Mechanisms of T cell activation by the calcium ionophore ionomycin. J Immunol. 1989;143:1283–1289. [PubMed] [Google Scholar]
- 34.Luckasen JR, White JG, Kersey JH. Mitogenic properties of a calcium ionophore, A23187. Proc Natl Acad Sci U S A. 1974;71:5088–5090. doi: 10.1073/pnas.71.12.5088. [DOI] [PMC free article] [PubMed] [Google Scholar]
- 35.Truneh A, Albert F, Golstein P, Schmitt-Verhulst AM. Early steps of lymphocyte activation bypassed by synergy between calcium ionophores and phorbol ester. Nature. 1985;313:318–320. doi: 10.1038/313318a0. [DOI] [PubMed] [Google Scholar]
- 36.Patron M, Checchetto V, Raffaello A, Teardo E, Vecellio Reane D, Mantoan M, Granatiero V, Szabo I, De Stefani D, Rizzuto R. MICU1 and MICU2 finely tune the mitochondrial Ca2+ uniporter by exerting opposite effects on MCU activity. Mol Cell. 2014;53:726–737. doi: 10.1016/j.molcel.2014.01.013. [DOI] [PMC free article] [PubMed] [Google Scholar]
- 37.Impey S, McCorkle SR, Cha-Molstad H, Dwyer JM, Yochum GS, Boss JM, McWeeney S, Dunn JJ, Mandel G, Goodman RH. Defining the CREB regulon: a genome-wide analysis of transcription factor regulatory regions. Cell. 2004;119:1041–1054. doi: 10.1016/j.cell.2004.10.032. [DOI] [PubMed] [Google Scholar]
- 38.Yamamoto KK, Gonzalez GA, Biggs WH, 3rd, Montminy MR. Phosphorylation-induced binding and transcriptional efficacy of nuclear factor CREB. Nature. 1988;334:494–498. doi: 10.1038/334494a0. [DOI] [PubMed] [Google Scholar]
- 39.Sheng M, McFadden G, Greenberg ME. Membrane depolarization and calcium induce c-fos transcription via phosphorylation of transcription factor CREB. Neuron. 1990;4:571–582. doi: 10.1016/0896-6273(90)90115-v. [DOI] [PubMed] [Google Scholar]
- 40.Uchiyama T, Yoshikawa F, Hishida A, Furuichi T, Mikoshiba K. A novel recombinant hyperaffinity inositol 1,4,5-trisphosphate (IP(3)) absorbent traps IP(3), resulting in specific inhibition of IP(3)-mediated calcium signaling. J Biol Chem. 2002;277:8106–8113. doi: 10.1074/jbc.M108337200. [DOI] [PubMed] [Google Scholar]
- 41.Kornhauser JM, Cowan CW, Shaywitz AJ, Dolmetsch RE, Griffith EC, Hu LS, Haddad C, Xia Z, Greenberg ME. CREB transcriptional activity in neurons is regulated by multiple, calcium-specific phosphorylation events. Neuron. 2002;34:221–233. doi: 10.1016/s0896-6273(02)00655-4. [DOI] [PubMed] [Google Scholar]
- 42.Limnander A, Depeille P, Freedman TS, Liou J, Leitges M, Kurosaki T, Roose JP, Weiss A. STIM1, PKC-delta and RasGRP set a threshold for proapoptotic Erk signaling during B cell development. Nature immunology. 2011;12:425–433. doi: 10.1038/ni.2016. [DOI] [PMC free article] [PubMed] [Google Scholar]
- 43.Satrustegui J, Pardo B, Del Arco A. Mitochondrial transporters as novel targets for intracellular calcium signaling. Physiol Rev. 2007;87:29–67. doi: 10.1152/physrev.00005.2006. [DOI] [PubMed] [Google Scholar]
- 44.Territo PR, Mootha VK, French SA, Balaban RS. Ca(2+) activation of heart mitochondrial oxidative phosphorylation: role of the F(0)/F(1)-ATPase. Am J Physiol Cell Physiol. 2000;278:C423–435. doi: 10.1152/ajpcell.2000.278.2.C423. [DOI] [PubMed] [Google Scholar]
- 45.Karpova T, Danchuk S, Kolobova E, Popov KM. Characterization of the isozymes of pyruvate dehydrogenase phosphatase: implications for the regulation of pyruvate dehydrogenase activity. Bba-Proteins Proteom. 2003;1652:126–135. doi: 10.1016/j.bbapap.2003.08.010. [DOI] [PubMed] [Google Scholar]
- 46.Pan X, Liu J, Nguyen T, Liu C, Sun J, Teng Y, Fergusson MM, Rovira II, Allen M, Springer DA, Aponte AM, Gucek M, Balaban RS, Murphy E, Finkel T. The physiological role of mitochondrial calcium revealed by mice lacking the mitochondrial calcium uniporter. Nat Cell Biol. 2013;15:1464–1472. doi: 10.1038/ncb2868. [DOI] [PMC free article] [PubMed] [Google Scholar]
- 47.White C, Li C, Yang J, Petrenko NB, Madesh M, Thompson CB, Foskett JK. The endoplasmic reticulum gateway to apoptosis by Bcl-X(L) modulation of the InsP3R. Nat Cell Biol. 2005;7:1021–1028. doi: 10.1038/ncb1302. [DOI] [PMC free article] [PubMed] [Google Scholar]
- 48.Orrenius S, Zhivotovsky B, Nicotera P. Regulation of cell death: the calcium-apoptosis link. Nat Rev Mol Cell Biol. 2003;4:552–565. doi: 10.1038/nrm1150. [DOI] [PubMed] [Google Scholar]
- 49.Duchen MR. Mitochondria and calcium: from cell signalling to cell death. J Physiol. 2000;529 Pt 1:57–68. doi: 10.1111/j.1469-7793.2000.00057.x. [DOI] [PMC free article] [PubMed] [Google Scholar]
- 50.Halestrap AP. Mitochondrial calcium in health and disease. Biochim Biophys Acta. 2009;1787:1289–1290. doi: 10.1016/j.bbabio.2009.07.011. [DOI] [PubMed] [Google Scholar]
- 51.Putney JW, Jr, Broad LM, Braun FJ, Lievremont JP, Bird GS. Mechanisms of capacitative calcium entry. J Cell Sci. 2001;114:2223–2229. doi: 10.1242/jcs.114.12.2223. [DOI] [PubMed] [Google Scholar]
- 52.Feske S. Calcium signalling in lymphocyte activation and disease. Nat Rev Immunol. 2007;7:690–702. doi: 10.1038/nri2152. [DOI] [PubMed] [Google Scholar]
- 53.Hoth M, Fanger CM, Lewis RS. Mitochondrial regulation of store-operated calcium signaling in T lymphocytes. J Cell Biol. 1997;137:633–648. doi: 10.1083/jcb.137.3.633. [DOI] [PMC free article] [PubMed] [Google Scholar]
- 54.Rizzuto R, Pozzan T. Microdomains of intracellular Ca2+: molecular determinants and functional consequences. Physiol Rev. 2006;86:369–408. doi: 10.1152/physrev.00004.2005. [DOI] [PubMed] [Google Scholar]
- 55.Jouaville LS, Ichas F, Holmuhamedov EL, Camacho P, Lechleiter JD. Synchronization of calcium waves by mitochondrial substrates in Xenopus laevis oocytes. Nature. 1995;377:438–441. doi: 10.1038/377438a0. [DOI] [PubMed] [Google Scholar]
- 56.Santo-Domingo J, Demaurex N. Calcium uptake mechanisms of mitochondria. Biochim Biophys Acta. 2010;1797:907–912. doi: 10.1016/j.bbabio.2010.01.005. [DOI] [PubMed] [Google Scholar]
- 57.Gilabert JA, Parekh AB. Respiring mitochondria determine the pattern of activation and inactivation of the store-operated Ca2+ current I-CRAC. Embo Journal. 2000;19:6401–6407. doi: 10.1093/emboj/19.23.6401. [DOI] [PMC free article] [PubMed] [Google Scholar]
- 58.Gilabert JA, Bakowski D, Parekh AB. Energized mitochondria increase the dynamic range over which inositol 1,4,5-trisphosphate activates store-operated calcium influx. EMBO J. 2001;20:2672–2679. doi: 10.1093/emboj/20.11.2672. [DOI] [PMC free article] [PubMed] [Google Scholar]
- 59.Singaravelu K, Nelson C, Bakowski D, de Brito OM, Ng SW, Di Capite J, Powell T, Scorrano L, Parekh AB. Mitofusin 2 Regulates STIM1 Migration from the Ca2+ Store to the Plasma Membrane in Cells with Depolarized Mitochondria. Journal of Biological Chemistry. 2011;286 doi: 10.1074/jbc.M110.174029. [DOI] [PMC free article] [PubMed] [Google Scholar]
- 60.Gilabert JA, Parekh AB. Respiring mitochondria determine the pattern of activation and inactivation of the store-operated Ca(2+) current I(CRAC) EMBO J. 2000;19:6401–6407. doi: 10.1093/emboj/19.23.6401. [DOI] [PMC free article] [PubMed] [Google Scholar]
- 61.Parekh AB. Mitochondrial regulation of store-operated CRAC channels. Cell Calcium. 2008;44:6–13. doi: 10.1016/j.ceca.2007.12.006. [DOI] [PubMed] [Google Scholar]
- 62.Deak AT, Blass S, Khan MJ, Groschner LN, Waldeck-Weiermair M, Hallstrom S, Graier WF, Malli R. Inositol-1,4,5-trisphosphate (IP3)-mediated STIM1 oligomerization requires intact mitochondrial Ca2+ uptake. J Cell Sci. 2014 doi: 10.1242/jcs.149807. [DOI] [PMC free article] [PubMed] [Google Scholar]
- 63.Kar P, Nelson C, Parekh AB. CRAC channels drive digital activation and provide analog control and synergy to Ca(2+)-dependent gene regulation. Curr Biol. 2012;22:242–247. doi: 10.1016/j.cub.2011.12.025. [DOI] [PubMed] [Google Scholar]
- 64.Di Capite J, Ng SW, Parekh AB. Decoding of cytoplasmic Ca(2+) oscillations through the spatial signature drives gene expression. Curr Biol. 2009;19:853–858. doi: 10.1016/j.cub.2009.03.063. [DOI] [PubMed] [Google Scholar]
- 65.Parekh AB, Muallem S. Ca(2+) signalling and gene regulation. Cell Calcium. 2011;49:279. doi: 10.1016/j.ceca.2011.01.002. [DOI] [PubMed] [Google Scholar]
- 66.Futatsugi A, Nakamura T, Yamada MK, Ebisui E, Nakamura K, Uchida K, Kitaguchi T, Takahashi-Iwanaga H, Noda T, Aruga J, Mikoshiba K. IP3 receptor types 2 and 3 mediate exocrine secretion underlying energy metabolism. Science. 2005;309:2232–2234. doi: 10.1126/science.1114110. [DOI] [PubMed] [Google Scholar]
- 67.Pulver RA, Rose-Curtis P, Roe MW, Wellman GC, Lounsbury KM. Store-operated Ca2+ entry activates the CREB transcription factor in vascular smooth muscle. Circ Res. 2004;94:1351–1358. doi: 10.1161/01.RES.0000127618.34500.FD. [DOI] [PubMed] [Google Scholar]
- 68.Wheeler DG, Groth RD, Ma H, Barrett CF, Owen SF, Safa P, Tsien RW. Ca(V)1 and Ca(V)2 channels engage distinct modes of Ca(2+) signaling to control CREB-dependent gene expression. Cell. 2012;149:1112–1124. doi: 10.1016/j.cell.2012.03.041. [DOI] [PMC free article] [PubMed] [Google Scholar]
- 69.Joiner ML, Koval OM, Li J, He BJ, Allamargot C, Gao Z, Luczak ED, Hall DD, Fink BD, Chen B, Yang J, Moore SA, Scholz TD, Strack S, Mohler PJ, Sivitz WI, Song LS, Anderson ME. CaMKII determines mitochondrial stress responses in heart. Nature. 2012;491:269–273. doi: 10.1038/nature11444. [DOI] [PMC free article] [PubMed] [Google Scholar]
- 70.Picard C, McCarl CA, Papolos A, Khalil S, Luthy K, Hivroz C, LeDeist F, Rieux-Laucat F, Rechavi G, Rao A, Fischer A, Feske S. STIM1 mutation associated with a syndrome of immunodeficiency and autoimmunity. N Engl J Med. 2009;360:1971–1980. doi: 10.1056/NEJMoa0900082. [DOI] [PMC free article] [PubMed] [Google Scholar]
- 71.Hawkins BJ, Irrinki KM, Mallilankaraman K, Lien YC, Wang Y, Bhanumathy CD, Subbiah R, Ritchie MF, Soboloff J, Baba Y, Kurosaki T, Joseph SK, Gill DL, Madesh M. S-glutathionylation activates STIM1 and alters mitochondrial homeostasis. J Cell Biol. 2010;190:391–405. doi: 10.1083/jcb.201004152. [DOI] [PMC free article] [PubMed] [Google Scholar]
- 72.Madesh M, Hawkins BJ, Milovanova T, Bhanumathy CD, Joseph SK, Ramachandrarao SP, Sharma K, Kurosaki T, Fisher AB. Selective role for superoxide in InsP3 receptor-mediated mitochondrial dysfunction and endothelial apoptosis. J Cell Biol. 2005;170:1079–1090. doi: 10.1083/jcb.200505022. [DOI] [PMC free article] [PubMed] [Google Scholar]
- 73.Marchi S, Lupini L, Patergnani S, Rimessi A, Missiroli S, Bonora M, Bononi A, Corra F, Giorgi C, De Marchi E, Poletti F, Gafa R, Lanza G, Negrini M, Rizzuto R, Pinton P. Downregulation of the mitochondrial calcium uniporter by cancer-related miR-25. Curr Biol. 2013;23:58–63. doi: 10.1016/j.cub.2012.11.026. [DOI] [PMC free article] [PubMed] [Google Scholar]
- 74.Madesh M, Hajnoczky G. VDAC-dependent permeabilization of the outer mitochondrial membrane by superoxide induces rapid and massive cytochrome c release. J Cell Biol. 2001;155:1003–1015. doi: 10.1083/jcb.200105057. [DOI] [PMC free article] [PubMed] [Google Scholar]
- 75.Irrinki KM, Mallilankaraman K, Thapa RJ, Chandramoorthy HC, Smith FJ, Jog NR, Gandhirajan RK, Kelsen SG, Houser SR, May MJ, Balachandran S, Madesh M. Requirement of FADD, NEMO, and BAX/BAK for aberrant mitochondrial function in tumor necrosis factor alpha-induced necrosis. Mol Cell Biol. 2011;31:3745–3758. doi: 10.1128/MCB.05303-11. [DOI] [PMC free article] [PubMed] [Google Scholar]
- 76.Brailoiu GC, Gurzu B, Gao X, Parkesh R, Aley PK, Trifa DI, Galione A, Dun NJ, Madesh M, Patel S, Churchill GC, Brailoiu E. Acidic NAADP-sensitive calcium stores in the endothelium: agonist-specific recruitment and role in regulating blood pressure. J Biol Chem. 2010;285:37133–37137. doi: 10.1074/jbc.C110.169763. [DOI] [PMC free article] [PubMed] [Google Scholar]
- 77.Fieni F, Lee SB, Jan YN, Kirichok Y. Activity of the mitochondrial calcium uniporter varies greatly between tissues. Nature communications. 2012;3:1317. doi: 10.1038/ncomms2325. [DOI] [PMC free article] [PubMed] [Google Scholar]
- 78.Jones RG, Bui T, White C, Madesh M, Krawczyk CM, Lindsten T, Hawkins BJ, Kubek S, Frauwirth KA, Wang YL, Conway SJ, Roderick HL, Bootman MD, Shen H, Foskett JK, Thompson CB. The proapoptotic factors Bax and Bak regulate T Cell proliferation through control of endoplasmic reticulum Ca(2+) homeostasis. Immunity. 2007;27:268–280. doi: 10.1016/j.immuni.2007.05.023. [DOI] [PMC free article] [PubMed] [Google Scholar]
Associated Data
This section collects any data citations, data availability statements, or supplementary materials included in this article.